
Radar Simulators Market Size and Share
Market Overview
| Study Period | 2020 - 2031 |
|---|---|
| Market Size (2026) | USD 2.65 Billion |
| Market Size (2031) | USD 3.57 Billion |
| Growth Rate (2026 - 2031) | 6.12 % |
| Fastest Growing Market | Asia Pacific |
| Largest Market | North America |
| Market Concentration | Medium |
Major Players *Disclaimer: Major Players sorted in no particular order Image © Mordor Intelligence. Reuse requires attribution under CC BY 4.0. | |
Radar Simulators Market Analysis by Mordor Intelligence
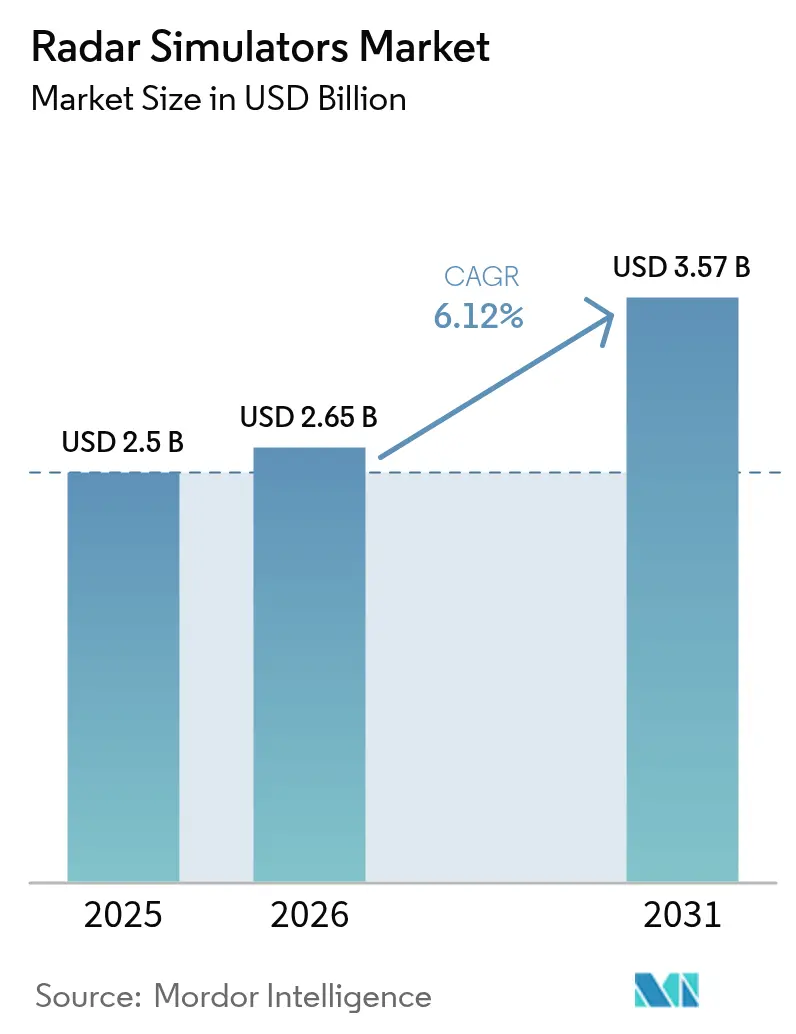
Radar simulators market size in 2026 is estimated at USD 2.65 billion, growing from 2025 value of USD 2.50 billion with 2031 projections showing USD 3.57 billion, growing at 6.12% CAGR over 2026-2031. Escalating defense modernization, heightened geopolitical tensions, and growing civil aviation safety mandates underpin this expansion. Milestones in software-defined radar and artificial intelligence (AI) are widening the gap between traditional hardware-centric trainers and flexible, upgrade-ready digital twins. Procurement authorities now view high-fidelity simulators as strategic force multipliers that lower operating costs, extend platform lifecycles, and accelerate readiness. Vendors capable of delivering open-architecture, cyber-secure solutions are gaining preference among defense ministries and commercial operators.[1]Source: Stockholm International Peace Research Institute, “East Asia Military Spending Reaches $411 Billion in 2023,” sipri.org
Key Report Takeaways
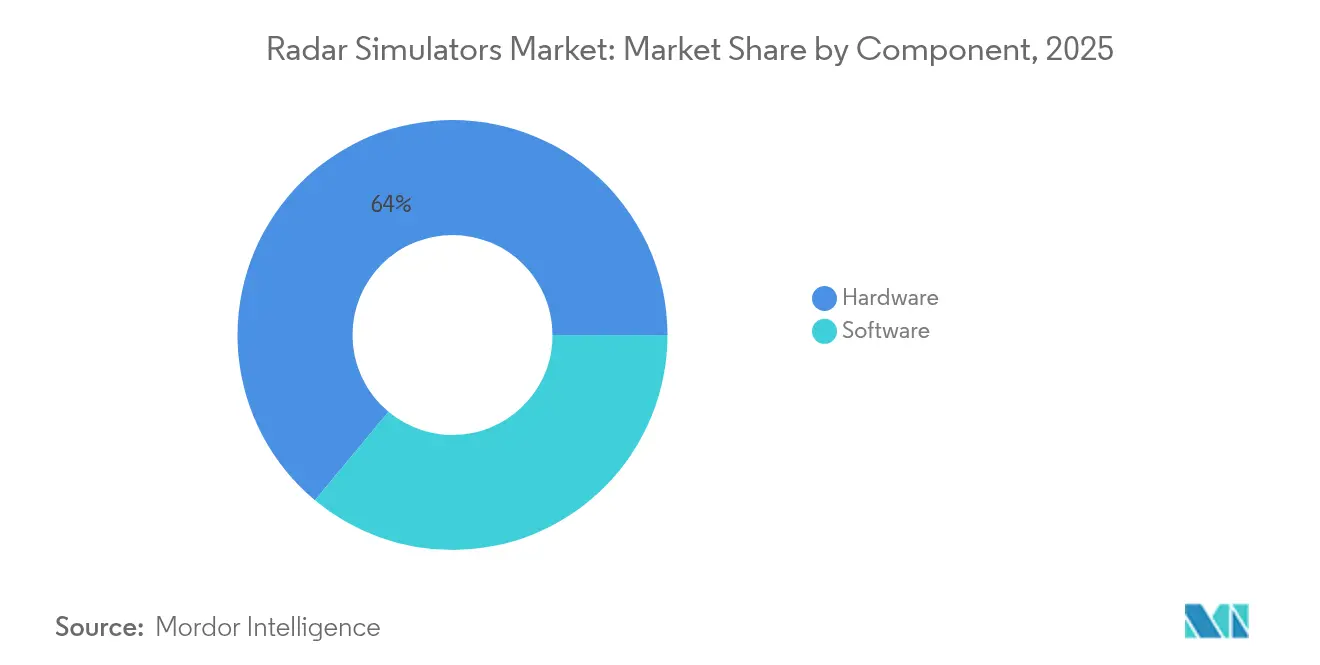
- By component, hardware commanded 63.95% of the radar simulation market share in 2025, whereas software is projected to expand at an 8.20% CAGR to 2031.
- By platform, ground-based systems led with 47.45% revenue share in 2025; naval-based solutions are advancing at a 7.15% CAGR through 2031.
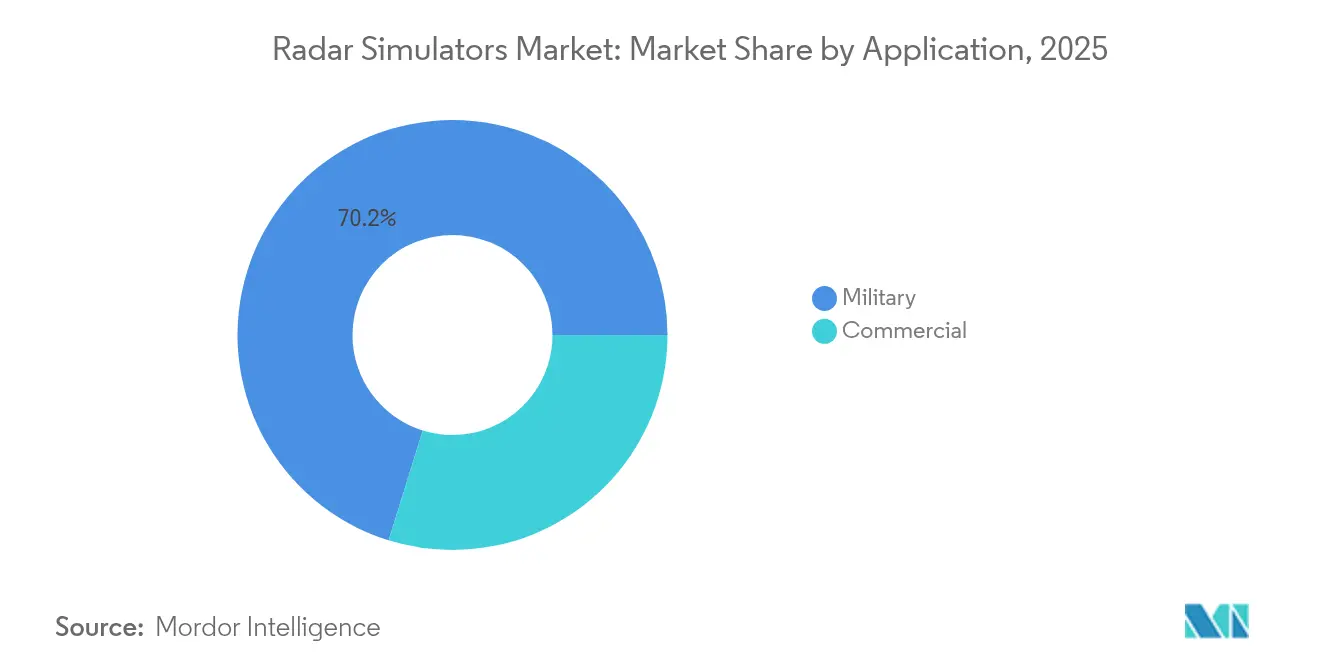
- By application, military training accounted for a 70.20% share of the radar simulation market size in 2025, and commercial use cases are growing at an 7.85% CAGR to 2031.
- By end-user sector, defense ministries held 57.30% of demand in 2025, while commercial airlines and ANSPs exhibit the highest projected CAGR at 8.05% through 2031.
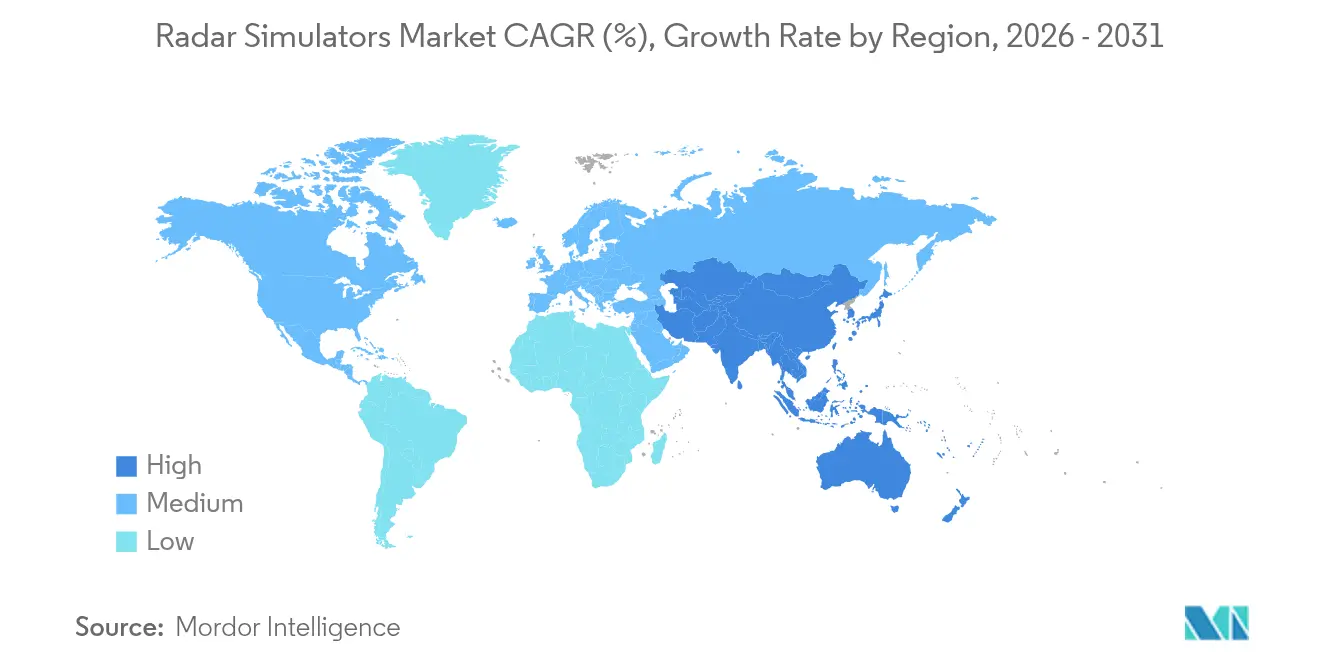
- By geography, North America commanded a 42.10% share in 2025; Asia-Pacific is forecasted to register the highest 8.05% CAGR over 2026-2031.
Note: Market size and forecast figures in this report are generated using Mordor Intelligence’s proprietary estimation framework, updated with the latest available data and insights as of 2026.
Market Trends and Insights
Drivers Impact Analysis of Radar Simulators Market*
| Driver | (~)% Impact on CAGR Forecast | Geographic Relevance | Impact Timeline |
|---|---|---|---|
| Growth in defense spending on simulator-based radar training | +1.8% | Global, with concentration in North America and Asia-Pacific | Medium term (2-4 years) |
| Increasing adoption of software-defined radar architectures | +1.5% | North America and Europe, expanding to Asia-Pacific | Long term (≥ 4 years) |
| Demand for affordable multi-mission training across services | +1.2% | Global | Short term (≤ 2 years) |
| Surge in AI-enabled cognitive radar test requirements | +1.0% | North America and Europe | Long term (≥ 4 years) |
| Need for spectrum-coexistence testing with 5G/6G networks | +0.7% | Global, with early adoption in developed markets | Medium term (2-4 years) |
| Expansion of digital-twin frameworks in radar development | +0.6% | North America and Europe | Long term (≥ 4 years) |
| Source: Mordor Intelligence | |||
Growth in Defense Spending on Simulator-Based Radar Training
Defense allocations continue to rise, funneling funds toward training ecosystems replicating live threat spectra without consumable outlays. East Asia’s military spending reached USD 411 billion in 2023, climbing 6.2% year-on-year, with China alone estimating USD 314 billion and sustaining 7% annual growth. Japan’s 2024 defense budget jumped 21% to USD 55.3 billion, the largest increase since 1952. South Korea earmarked KRW 567.70 billion (USD 404.77 million) for its L-SAM II radar program, embedding end-to-end simulation from the outset.[2]Source: Defense News Staff, “Japan’s 2024 Defense Budget Increases 21% to $55.3 Billion,” defensenews.com These investments fuel the radar simulation market demand because militaries prioritize cost-effective, always-available virtual ranges. Sophisticated trainers limit flight-hour consumption, defer equipment fatigue, and enable 24/7 curriculum delivery, making them indispensable in contemporary readiness planning.
Increasing Adoption of Software-Defined Radar Architectures
Software-defined radar reconfigures waveforms through firmware updates rather than hardware swaps, slashing integration timelines and expediting threat file rollout. IEEE 2024 demonstrations achieved real-time pulse compression on commodity processors, proving parity with custom ASIC solutions.[3]Source: IEEE Editors, “Software-Defined Radar Architectures and Real-Time Processing,” ieeexplore.ieee.org Cognitive radar concepts, which optimize transmissions in flight, require simulators that support rapid loop-back testing of adaptive logic. Defense laboratories now field unified workstations where operators can sequentially emulate surface-search, fire-control, and counter-battery modes, cutting training infrastructure footprints. This flexibility accelerates cycle times between algorithm updates and live deployments, reinforcing demand for open-architecture simulators throughout the radar simulation market.
Demand for Affordable Multi-Mission Training Across Services
Armed forces seek integrative trainers who combine air, land, and sea scenarios. CAE’s Naval Combat Systems Simulator supports anti-submarine, air-defense, and surface-warfare drills from a shared console, demonstrating multi-mission efficiency. The US Marine Corps (USMC) allocates more syllabus hours to synthetic F-35 environments than live flights, citing safety, availability, and cost benefits. Such cross-domain platforms enhance interoperability, allowing joint task forces to rehearse composite operations without geographic colocation or excessive per-branch spending. Consequently, the radar simulation market experiences sustained tailwinds as militaries replace siloed legacy trainers with enterprise-wide, license-driven ecosystems.
Surge in AI-Enabled Cognitive Radar Test Requirements
Machine-learning algorithms enter fielded radars, forcing test facilities to replicate adversarial jamming and deceptive signatures within controlled settings. HENSOLDT’s 2024 quantum-radar research underlines the importance of synthetic environments capable of generating millions of clutter variations. Simulators must now model closed-loop decision cycles where AI modifies waveforms in real time. Vendors integrating GPU-accelerated scene generation with reinforcement-learning frameworks gain competitive traction, as program offices demand quantitative evidence of algorithm robustness before fleet release. The radar simulation market, therefore, absorbs an additional layer of complexity, further elevating software value over raw hardware horsepower.
Restraints Impact Analysis of Radar Simulators Market*
| Restraint | (~)% Impact on CAGR Forecast | Geographic Relevance | Impact Timeline |
|---|---|---|---|
| High capital cost of high-fidelity HIL simulators | -1.3% | Global, particularly affecting smaller defense contractors | Short term (≤ 2 years) |
| Stringent export-control and cybersecurity compliance | -0.9% | Global, with varying regional requirements | Medium term (2-4 years) |
| Shortage of validated real-world RF environment datasets | -0.8% | Global, with acute challenges in contested environments | Medium term (2-4 years) |
| Real-time FPGA/GPU integration complexity | -0.6% | Global, particularly affecting advanced simulation platforms | Long term (≥ 4 years) |
| Source: Mordor Intelligence | |||
High Capital Cost of High-Fidelity HIL Simulators
A comprehensive hardware-in-the-loop bench, driven by RF front-ends, shielded ranges, and high-speed FPGAs replicating microsecond timing, can exceed USD 10 million. Small contractors and emergent nations struggle to finance such setups, often settling for reduced realism that limits scenario breadth. Although cloud-hosted soft-loop alternatives appeal on cost, many militaries still demand signal-level stimulation accuracy that only dedicated benches deliver. This capital barrier slows procurement decisions and keeps portions of the radar simulation market underserved.
Stringent Export-Control and Cybersecurity Compliance
Simulators capable of modeling classified radar modes fall under ITAR and EAR, complicating multinational collaboration. Compliance with MIL-STD-461F electromagnetic limits and EUROCAE ED-203A cybersecurity frameworks adds months to development cycles. Vendors must embed encryption, external-media controls, and tamper logging, raising cost and technical complexity. Smaller firms often partner with primes to navigate these hurdles, which can stifle innovation and extend time-to-market across the radar simulation market.
*Our forecasts treat driver/restraint impacts as directional, not additive. The impact forecasts reflect baseline growth, mix effects, and variable interactions.
Radar Simulators Market Segment Analysis
By Component:
Software Gains Ground Despite Hardware DominanceHardware retained 63.95% of the radar simulation market share in 2025, underscoring the enduring need for real-time RF generation, precise timing, and low-latency FPGAs. Nonetheless, software revenues are rising at an 8.20% CAGR because algorithmic ingenuity now dictates scenario fidelity. Modern frameworks like SA-Radar allow attribute-controllable waveform libraries that users can drag-and-drop into curricula without additional circuit boards.
In the next five years, leading integrators will likely shift toward slimmed-down modular hardware married to subscription-based software models, echoing trends in virtual flight training. This transition helps end-users avoid forklift upgrades as threat libraries evolve. In parallel, open APIs promote third-party plug-ins, spawning an ecosystem of value-added analytic tools, automated grading engines, and AI-based instructors, broadening the radar simulation market’s revenue beyond initial hardware deliveries.



By Platform:
Naval Systems Drive Growth Amid Ground-Based LeadershipGround-based trainers held a 47.45% share because fixed installations accommodate large antenna arrays, ample cooling, and high-power amplifiers without size constraints. They remain essential for integrated air-and-missile defense schools, where crews practice track fusion, cross-domain engagement, and electronic countermeasure tactics.
Naval platforms, meanwhile, deliver the fastest 7.15% CAGR as littoral conflicts and anti-access strategies force fleets to master complex electromagnetic environments. Rheinmetall’s maritime suite simulates sea-clutter dynamics and ducting impacts, preparing crews for real-world detection challenges. CAE’s naval trainer condenses anti-submarine, air-defense, and surface-strike modules into a portable console, streamlining shipboard deployment. Airborne trainers continue to serve fighter and surveillance communities, but on-board embedded training curbs external simulator growth, stabilizing the segment’s radar simulation market share.
By Application:
Commercial Training Uptick Challenges Military DominanceMilitary use retained 70.20% of the radar simulation market size in 2025 because combat readiness relies on advanced live-virtual-constructive networking. Nevertheless, commercial adoption accelerates at 7.85% CAGR as airlines and ANSPs embrace synthetic environments for regulatory compliance.
ICAO’s competency-based training frameworks require evidence that pilots and controllers can manage radar-dependent procedures. SkyRadar’s academic kits introduce ab initio students to primary-surveillance concepts, while Airways International’s TotalControl addresses terminal-area radar management. This regulatory pressure propels civil operators toward turnkey packages that include airport and weather-radar emulation, helping to diversify revenue streams across the radar simulation market.
By End-User Sector:
Airlines Challenge Defense Procurement PatternsDefense ministries purchased 57.30% of solutions in 2025, favoring enterprise agreements with indefinite-delivery contracts that guarantee lifecycle support. Yet commercial airlines and ANSPs show the strongest 8.05% CAGR as they expand fleets and adopt performance-based navigation.
EUROCAE cybersecurity guidelines mandate isolated labs where airlines can validate radar-linked avionics against intrusion scenarios. As a result, carriers budget for dedicated radar simulation suites to satisfy audit requirements and minimize operational disruptions. Aerospace OEMs and MROs, meanwhile, integrate simulators into engineering benches for radar line-replaceable unit (LRU) validation, contributing a steady but smaller slice of the radar simulation market.
Geography Analysis
North America Radar Simulators Market
North America’s dominance in the radar simulators market derives from robust defense allocations, advanced research institutions, and stringent air traffic safety regulations. The US DoD’s modeling and simulation directive promotes virtual training to reduce live-fire costs, ensuring stable multi-year procurement. Domestic primes deliver turnkey packages integrating missile defense, electronic warfare (EW), and space surveillance modules, encouraging allied foreign military sales that further entrench regional leadership.
APAC Radar Simulators Market
Asia-Pacific’s growth trajectory pivots on geopolitical flashpoints and rapid capability modernization. China’s steady 7% budget increase drives investment in digital training to support anti-stealth radar brigades. Japan and South Korea prioritize maritime domain awareness, integrating radar simulators into fleet combat systems to offset the expenses of live-sea trials. Australia collaborates with US allies on joint simulations for Indo-Pacific contingencies, while India scales indigenous trainer production to replace aging imported assets.
EMEA and South America Radar Simulators Market
Europe balances steady defense outlays with rigorous civil-aviation oversight that necessitates continuous radar-simulator enhancements. Thales and Leonardo anchor the supplier base, advancing software-defined cores that comply with EU cyber mandates. Middle Eastern nations procure comprehensive air-defense training suites linked to Patriot and THAAD batteries, whereas Africa and South America adopt niche solutions aligned with budget realities, such as coastal-surveillance radar trainers for maritime security missions.

Regulatory Landscape
In civil aviation, radar simulators and simulated ATC environments are increasingly shaped by flight simulation and cybersecurity frameworks. In April 2026, the European Union published Commission Implementing Regulation (EU) 2026/781 (EASA domain), amending (EU) No 1178/2011 and (EU) No 965/2012 and introducing updated qualification requirements for flight simulation training devices (FSTDs). The changes push training organizations toward demonstrable capability and task-to-tool alignment rather than relying only on type-based checks. For simulated ATC environments, ARINC 439 serves as a key consensus standard, while interoperability and surveillance-related technical baselines referenced across programs include ICAO Doc 9871 and EUROCAE ED-101 (RTCA DO-260C) for ADS-B/SSR context.
In the United States, FAA Tower Simulation Systems (TSS) provide a concrete regulatory and program anchor for radar-linked controller training modernization. The FAA Reauthorization Act of 2024 is driving expansion, with an agency target of 95 facilities by end-2025 and broader NAS integration by 2028. On the defense side, radar and IFF simulation is constrained by export-control and classified-mode handling (ITAR/EAR), along with military interoperability standards such as NATO STANAG 4193 and DoD AIMS 17-1000, which govern Mode 5 and secure national modes and limit broad commercial distribution of high-tier military simulation capabilities.
Value Chain Analysis
The radar simulators value chain starts with requirements definition and standards alignment (for example, ICAO Doc 9871 for civil surveillance context and STANAG 4193/DoD AIMS 17-1000 for IFF-related test and training). It then moves into scenario and sensor-model development, real-time signal generation, and system integration into training ecosystems. Upstream inputs include RF and timing subsystems (high-speed data converters, FPGA/GPU compute, precision clocks), emitter and channel models, clutter and propagation libraries, and cyber-hardening toolchains for accreditation. For higher-end defense use cases, a common integration path is Hardware-in-the-Loop (HWIL), using Open Systems Architecture Sensor Models (OSM) and Open Systems Architecture Signal Injectors (OSI) to connect synthetic radar environments to tactical hardware and mission systems.
Midstream, primes and specialist vendors package these elements into configurable benches or deployable training suites. They validate performance through customer acceptance tests and security frameworks, including RMF-aligned controls where applicable. This flow is visible in recent activity, including May 2025 when RTX launched an advanced radar simulator modeled on the AN/TPY-2 radar for the U.S. Missile Defense Agency, and February 2025 when L3Harris completed the first flight of its all-digital Viper Shield EW suite on a Block 70 F-16. Downstream value is realized through installation, instructor/operator tools, threat and scenario updates, and long-term sustainment, with bottlenecks often centered on AESA-fidelity modeling, real-time integration complexity, and cybersecurity accreditation timelines.
Competitive Landscape
The radar simulators market remains moderately consolidated. L3Harris Technologies Corporation, RTX Corporation, and CAE Inc. exploit vertical portfolios that combine hardware benches, scenario databases, and multi-year service contracts. Their global support networks and compliance infrastructure create high switching costs for defense ministries.
Mid-tier specialists differentiate themselves through focused R&D. Cambridge Pixel offers software-only radar-signal generators that run on commercial graphics cards, thereby lowering the entry barriers for academia and small operators. SkyRadar tailors modular labs for aviation colleges, seeding early-career familiarity with its ecosystem. Buffalo Computer Graphics specializes in maritime radar simulation, catering to naval training schools that seek turnkey bridge simulators. These firms often partner with primes for integration into larger deals, yet maintain autonomy through intellectual property niches.
Technology roadmaps converge on AI-driven scenario generation, automated performance analytics, and cloud-deployable microservices. Suppliers lacking machine-learning capabilities risk erosion of premium margins as customers equate static playback functions with commodity status. Compliance mastery with ITAR, EAR, and emerging cybersecurity directives further differentiates incumbents, throttling new entrants who lack the resources to navigate these regulatory mazes.
Radar Simulators Industry Leaders
RTX Corporation
CAE Inc.
Mercury Systems, Inc.
Adacel Technologies Limited
L3Harris Technologies, Inc.
- *Disclaimer: Major Players sorted in no particular order

Radar Simulators Market Companies Covered in this Report
- L3Harris Technologies, Inc.
- RTX Corporation
- CAE Inc.
- Mercury Systems, Inc.
- Adacel Technologies Limited
- Applied Research International Pvt. Ltd.
- Buffalo Computer Graphics, Inc.
- Cambridge Pixel Ltd.
- Textron Systems Corporation (Textron Inc.)
- Cobham Ultra SeniorCo S.à r.l.
- Northrop Grumman Corporation
- Thales Group
- Leonardo DRS, Inc. (Leonardo S.p.A.)
- ANSYS, Inc.
- Keysight Technologies, Inc.
- HENSOLDT AG

Market Opportunities and Future Outlook
Opportunities are expanding where radar simulation is being pulled into day-to-day training throughput constraints and validated for operational use, including ATC and integrated air-defense training. The FAA Tower Simulation Systems (TSS) expansion program, driven by the FAA Reauthorization Act of 2024, provides a sustained demand signal for simulation infrastructure tied to controller training capacity. In parallel, EASA’s April 2026 Implementing Regulation (EU) 2026/781 updates FSTD qualification expectations and supports broader adoption of capability-focused simulation. These anchors reward vendors that can package compliant simulated surveillance environments, measurable performance assessment, and cybersecurity controls into turnkey offerings for airlines, ANSPs, and training academies.
Defense training and test ranges are also creating whitespace around threat-representative radar and EW environments that support digital-twin workflows and software-defined radar evolution. In February 2026, Eviden highlighted deployment of its ARPEGE surface-to-air radar threat simulation system during a NATO Tactical Leadership Program exercise at Los Llanos air base (Spain, November 2025), illustrating interest in portable, exercise-ready threat simulation that can be integrated with live flying and mission rehearsal. Government procurement signals point to continued modernization of radar modeling and simulation stacks, including U.S. programs using Multi-Mode Radar Simulator (MMRS) software licenses for the Joint Simulation Environment and sole-source notices for radar simulator platforms in specialized maritime labs. Together, these developments reinforce demand for software-centric upgrades, open-architecture interfaces, and HWIL-ready modules rather than only new standalone trainer builds.
Recent Industry Developments in Radar Simulators Market
- June 2026: RTX (Raytheon) was awarded a USD 515 million contract from the U.S. Navy for the SPY-6 family of radars. The scale of SPY-6 production and integration work strengthens the pull for radar-mode validation, signal environment emulation, and crew training content that mirrors fielded capability, supporting adjacent demand for radar simulation and test tools.
- May 2026: CAE and Saab signed a teaming agreement to jointly pursue Canada’s Airborne Early Warning and Control (AEW&C) program based on the GlobalEye platform. The partnership explicitly includes integrated training and simulation, reinforcing the trend toward bundled platform-plus-synthetic-training offers for complex surveillance and mission-system ecosystems.
- June 2025: The Indian Air Force handed over RADSIM, an indigenously developed radar simulator, to the Indian Coast Guard. The transfer expanded access to high-fidelity radar and ATC training within India’s maritime and airspace operating environment, supporting local capability building and reducing reliance on imported training systems.


Radar Simulators Market Report Scope and Research Methodology
Market Definition and Coverage
This market covers radar simulation solutions used to emulate radar signals and operating conditions, so teams can train operators, test systems, and validate performance without relying on live radar ranges.
Scope exclusions: We exclude general flight simulators and purely synthetic training content that does not simulate radar behavior and returns.
Segments Covered in This Report
- By Component
- Hardware
- Software
- By Platform
- Ground-based
- Airborne-based
- Naval-based
- By Application
- Commercial
- Military
- By End-User Sector
- Defense Ministries and Armed Forces
- Aerospace OEMs and MROs
- Commercial Airlines and ANSPs
- By Geography
- North America
- United States
- Canada
- Mexico
- Europe
- United Kingdom
- France
- Germany
- Russia
- Rest of Europe
- Asia-Pacific
- China
- India
- Japan
- South Korea
- Rest of Asia-Pacific
- South America
- Brazil
- Rest of South America
- Middle East and Africa
- Middle East
- Saudi Arabia
- Israel
- United Arab Emirates
- Rest of Middle East
- Africa
- South Africa
- Rest of Africa
- Middle East
- North America
Data Sources, Market Sizing, and Validation
Desk Research
Desk research was used to ground the model in real demand and budget signals before assumptions were carried into the forecast years. We reviewed public defense budget documents and procurement releases, along with sources such as SIPRI trend data, ITU spectrum allocations, and ICAO publications, which together provide context for civil training and surveillance modernization. Where available, export and import direction was checked using customs statistics, and context was strengthened through peer-reviewed aerospace and defense journals.
We also used public company filings and investor presentations to understand program exposure, product positioning, and revenue language that distinguishes simulator offerings from adjacent training tools. News and financials databases helped track contract awards, facility upgrades, and delivery timelines, and patent databases were used to see where radar signal generation and digital modeling work is concentrating. These desk inputs were then used to set reasonable ranges for pricing, platform mix, and upgrade cycles. The sources listed here are illustrative, and many other public references were also used for data collection, cross-checking, and clarification.
Primary Interviews and Surveys
Primary work focused on interviews and structured surveys with defense training stakeholders, aerospace testing teams, system integrators, and simulator and subsystem suppliers, so we could validate what is being bought and why. Since this is a global market, we also balanced discussions across major buying regions to pressure test platform priorities (airborne, ground, and naval) and the split between training and system testing use cases.
Distribution of primary research fieldwork respondents
| Company type | Respondent position | Region |
|---|---|---|
| Top tier: 26% | CXOs: 19% | APAC: 39% |
| Mid tier: 53% | Functional/Unit leaders: 21% | EMEA: 36% |
| Smaller Players: 21% | Managers: 60% | Americas: 25% |
Market-Sizing & Forecasting
Sizing starts with a top-down build where defense and civil training demand is reconstructed using procurement and modernization signals, then mapped to simulator adoption across airborne, ground, and naval radar environments. The model uses inputs such as radar platform upgrade cycles, training hours and throughput needs, typical simulator refresh periods, and the split of spend between hardware and software, which together define the addressable demand pool.
To keep totals realistic, we corroborated outputs with selective bottom-up approximations, such as sampled average selling prices multiplied by expected unit volumes for major program types, plus channel checks on delivery lead times and configuration depth. When a direct unit view was not possible for a country or program, gaps were handled using proxy indicators like fleet size, training infrastructure density, and known procurement intensity, then normalized back to the regional pattern. For forecasting, scenario analysis was used, supported by expert views on defense budget direction, trainer capacity additions, and the pace of radar digitization. Scenarios are then blended into a single central case.
Data Validation & Update Cycle
Validation was handled through multiple checks so results did not rely on a single dataset or one interview stream. Our team compared model outputs against independent signals like contract flow, delivery timelines, and implied spend per platform, and then reviewed outliers where a region or platform grew faster than underlying demand indicators.
Before sign-off, assumptions are re-tested across analysts, and re-contact is triggered when key inputs shift, such as large procurement announcements or program delays. Reports are refreshed annually, and interim updates are done when material events change the outlook. Before delivery, a fresh pass is completed so clients receive the latest updated view.
Mordor Intelligence's Radar Simulators Market Size Compared Against Other Published Estimates
Published market sizes for radar simulators often do not match because each study may start from a different year, count a different mix of simulator functions, and apply different pricing and currency timing assumptions. Differences can also come from how much of the installed base upgrade cycle is treated as new demand versus maintenance activity.
The spread is usually explained by scope choices and how the demand pool is constructed, such as whether adjacent training systems are included, whether civil air navigation training is counted in full, and how software updates are priced over time. Exchange rate timing, treatment of multi-year contracts, and the refresh cadence of public procurement inputs can also move a value up or down.
Benchmark comparison
| Source | Market Size | Gaps in Research Methodology |
|---|---|---|
| Mordor Intelligence | USD 2.65 B (2026) | |
| Global Consultancy A | USD 3.13 B (2024) | Uses a different base year and can capture a broader revenue envelope by bundling simulator related integration and training services into the headline, which increases the apparent current value. |
| Industry Publisher B | USD 2.59 B (2025) | Uses a 2025 base year and may apply a more conservative adoption curve for modernization programs, which can reduce near-term spend that is otherwise expected to occur through upgrade cycles. |
The table shows that the gap is largely about timing and what is counted, and in Mordor Intelligence's model the value is anchored to simulator hardware and software tied directly to radar training and system testing needs across platforms, with adjacent training tools left out unless radar signal emulation is clearly part of the deliverable. With that discipline, the number stays traceable to procurement signals, platform demand indicators, and repeatable pricing logic, which makes year-to-year updates easier to audit.


Key Questions Answered in the Report
What is the current value of the global radar simulators market?
The radar simulators market is valued at USD 2.65 billion in 2026 and is projected to expand to USD 3.57 billion by 2031.
Which component segment is growing fastest?
Software is the fastest-growing component, advancing at an 8.20% CAGR through 2031 as algorithmic sophistication outpaces hardware additions.
Why are naval radar simulators seeing strong demand?
Increasing maritime tensions and the need to rehearse multi-domain operations without costly sea trials are driving naval simulator demand at a 7.15% CAGR.
How are commercial airlines utilizing radar simulation?
Airlines and ANSPs employ simulators for pilot and controller certification, meeting regulatory mandates while reducing training costs and improving safety.
Which region is expected to record the highest growth?
Asia-Pacific is forecasted to grow at an 8.05% CAGR, driven by escalating defense budgets in China, Japan, India, and South Korea.
What key factors constrain market expansion?
High upfront costs for hardware-in-the-loop benches and complex export-control plus cybersecurity regulations limit adoption, particularly among small vendors.
Page last updated on:





