Weapon Locating Radar Market Size and Share
Market Overview
| Study Period | 2019 - 2030 |
|---|---|
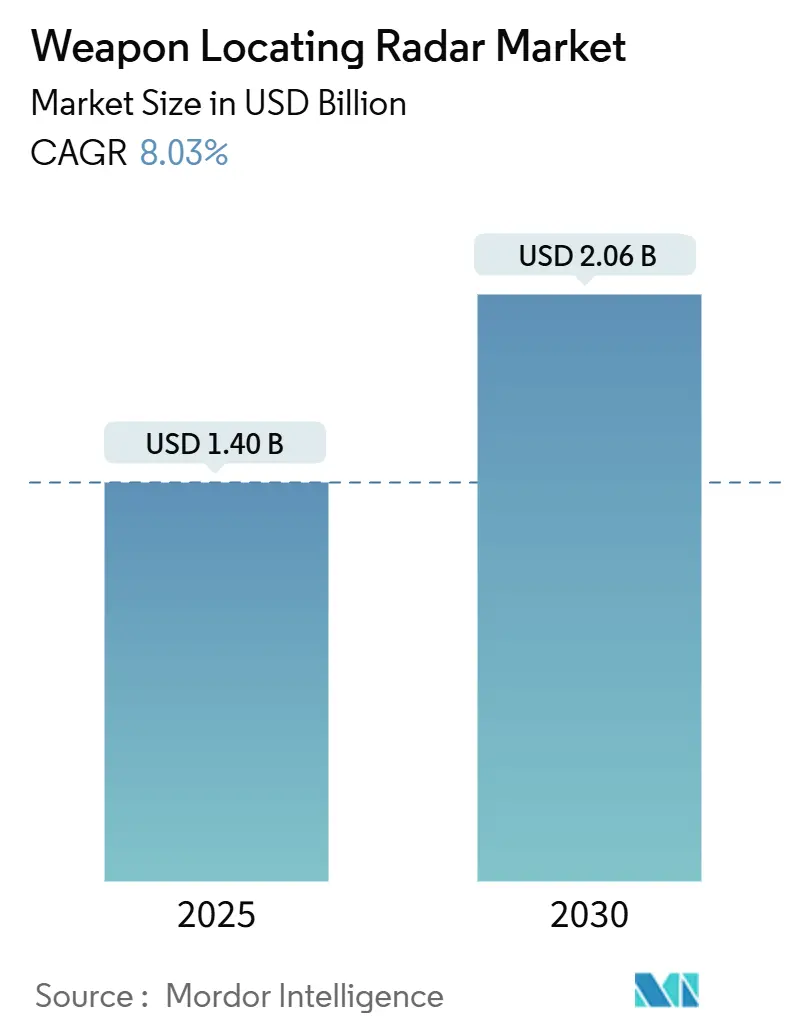
| Market Size (2025) | USD 1.40 Billion |
| Market Size (2030) | USD 2.06 Billion |
| Growth Rate (2025 - 2030) | 8.03% CAGR |
| Fastest Growing Market | Asia Pacific |
| Largest Market | North America |
| Market Concentration | Medium |
Major Players *Disclaimer: Major Players sorted in no particular order Image © Mordor Intelligence. Reuse requires attribution under CC BY 4.0. | |
Weapon Locating Radar Market Analysis by Mordor Intelligence
The weapon locating radar market size stood at USD 1.40 billion in 2025 and is projected to reach USD 2.06 billion by 2030, reflecting an 8.03% CAGR through the forecast period. High-intensity conflicts have underlined the urgency of modernizing counter-battery sensors, pushing defense ministries toward solutions that detect rocket, artillery, and mortar (RAM) fire while surviving enemy suppression. Medium-range systems remain the most widely deployed, yet extended-range variants attract fresh investment as planners seek earlier warning against long-range precision fires. Active phased-array radars dominate installed fleets, but passive and passive-coherent technologies gain traction because they reduce electromagnetic signatures that invite targeting. Platform diversification is accelerating: ground-based arrays still form the backbone, airborne systems register the fastest growth, and naval operators adopt multifunction radars that cover littoral fires and air threats. Across all regions, spectrum congestion, lifecycle cost escalation linked to gallium-nitride (GaN) upgrades, and the growing danger of loitering munitions shape procurement decisions.
Key Report Takeaways
- By range, medium-range equipment accounted for 38.95% of the weapon locating radar market share in 2024, while extended-range systems are forecasted to grow at a 9.21% CAGR to 2030.
- By radar type, active phased-array technology held 50.66% share of the weapon locating radar market size in 2024; passive/passive-coherent designs are advancing at 9.10% CAGR through 2030.
- By platform, ground-based assets commanded 67.75% of the weapon locating radar market share in 2024, whereas airborne platforms are on course for a 9.42% CAGR through 2030.
- By frequency band, C-band systems led with 52.62% revenue share in 2024; “other” experimental bands are projected to post an 8.65% CAGR by 2030.
- By Geography, North America captured 30.67% of 2024 revenue, and Asia-Pacific is predicted to expand at an 8.91% CAGR during the forecast period.
Global Weapon Locating Radar Market Trends and Insights
Drivers Impact Analysis*
| Driver | (~) % Impact on CAGR Forecast | Geographic Relevance | Impact Timeline |
|---|---|---|---|
| Rising demand for counter-battery detection in modern high-intensity conflicts | +2.1% | Eastern Europe, Middle East, Indo-Pacific | Short term (≤ 2 years) |
| Expansion of multi-mission AESA radars with integrated surveillance functions | +1.8% | North America, European Union, APAC allies | Medium term (2-4 years) |
| Acceleration of artillery modernization and force-structure upgrades worldwide | +1.5% | Global | Medium term (2-4 years) |
| Growing adoption of mobile, network-centric sensor architectures | +1.3% | APAC, MEA, South America | Long term (≥ 4 years) |
| Integration of AI-driven analytics for enhanced trajectory prediction and targeting | +1.0% | North America, EU, select APAC | Long term (≥ 4 years) |
| Increasing deployment of passive and bi-static radar techniques to minimize detection | +0.8% | Global | Medium term (2-4 years) |
| Source: Mordor Intelligence | |||
Rising demand for counter-battery detection in high-intensity conflicts
Combat experience in Ukraine showed that artillery capable of firing beyond 50 kilometers can inflict severe damage if not countered quickly, motivating NATO and partner nations to purchase radars that locate firing units in seconds instead of minutes. Losses of Russian Zoopark-1M units highlighted the radar assets' value and vulnerability. This led to operational concepts that field multiple smaller sensors, acoustic arrays, and low-probability-of-intercept (LPI) systems in layered networks. Procurement timelines have shortened, with emergency buys moving ahead of multi-year development cycles. The resulting pull-through effect drives immediate orders for mobile fleets that reposition after every mission firing, closing a long-standing survivability gap. Programs in Poland, the Baltics, South Korea, and Israel echo the urgency felt across forward-postured formations.
Expansion of multi-mission AESA radars with integrated surveillance functions
GaN-based active electronically scanned arrays (ESA) combine counter-battery tracking, air surveillance, and missile defense into a single unit, allowing commanders to consolidate sensors and cut sustainment loads. Raytheon’s Lower Tier Air and Missile Defense Sensor demonstrates 360-degree coverage against artillery shells and cruise missiles. At the same time, General Atomics equips the Gray Eagle ER unmanned aircraft with a lightweight digital AESA that cues kinetic interceptors. Nations under tight defense budgets prefer one sensor that can serve multiple battalions over several single-mission radars, but this concentration of capability also creates a high-value target. To mitigate the risk, operators disperse antenna panels and rely on software-defined beam management that continues functioning even when a face is damaged.
Acceleration of artillery modernization and force-structure upgrades
Self-propelled howitzers such as CAESAR, K9 Thunder, and Archer drive demand for radars able to operate on the move while providing near-real-time firing solutions. Artillery transformation programs in the US, Germany, and Australia push range envelopes toward 70 kilometers, forcing radar designers to extend instrumented ranges and refine trajectory algorithms. Digitally networked guns require sensors that publish target coordinates directly into fire-control systems, reducing sensor-to-shooter timelines to seconds. As a result, radar contracts are increasingly bundled with gun purchases, ensuring that each artillery regiment receives organic counter-battery assets. Compliance with NATO standardization agreements steers technical specifications toward standard data formats that facilitate coalition operations.
Growing adoption of mobile, network-centric sensor architectures
Static sensors invite precision strikes by loitering munitions; therefore, armies invest in easily towed or truck-mounted radars complemented by dispersed acoustic or seismic nodes that mesh through secure software-defined radios.[1]Elbit Systems, “C4I for Artillery Modernization,” elbitsystems.com Elbit’s C4I suite in Europe provides automatic hand-off between sensors, creating overlapping fields of view that persist even if one node is lost. Power-efficient processing hardware supports off-grid deployments, while AI-assisted sensor-fusion tools surface only the most relevant tracks to operators. The approach shifts the radar’s role from a standalone asset to an edge node in a larger kill chain, enabling the distributed fires doctrine adopted by US and Australian forces. Such mobility places new constraints on antenna weight and setup time, spurring innovation in lightweight composite structures and mast-mounted panels that unfold autonomously.
Restraints Impact Analysis*
| Restraint | (~) % Impact on CAGR Forecast | Geographic Relevance | Impact Timeline |
|---|---|---|---|
| Spectrum congestion and rising co-site interference challenges | −1.2% | Global | Short term (≤ 2 years) |
| Elevated life-cycle costs associated with GaN-based AESA upgrades | −0.9% | North America, EU | Medium term (2-4 years) |
| Stringent export-control regimes restricting international technology transfer | −0.7% | Global | Long term (≥ 4 years) |
| Rising vulnerability of radar assets to cost-effective loitering munitions | −0.6% | Active conflict zones | Short term (≤ 2 years) |
| Source: Mordor Intelligence | |||
Spectrum congestion and rising co-site interference challenges
Weapon locating radars often operate beside electronic warfare (EW) pods, satellite terminals, and 5G macro-cells, exposing them to performance-degrading interference.[2]IEEE Xplore, “GaN AESA Reliability Findings,” ieee.org DARPA’s Shared Spectrum Access program demonstrated adaptive waveforms that mitigate blockage, yet field introduction remains limited. To claim a clear channel, armies sometimes relocate radars farther from command posts, stretching power and data links. Cognitive algorithms that hop across micro-bands improve survivability but require certified frequency-management software, adding cost and training overhead. As national regulators auction legacy military bands to telecom operators, radars must migrate upward in frequency, driving redesigns of antenna apertures and amplifiers.
Elevated life-cycle costs associated with GaN-based AESA upgrades
GaN delivers higher power density and bandwidth, but replacement transmit-receive modules are expensive and must be sourced from secure foundries that meet defense trust protocols. Field technicians need new certifications to handle electrostatic discharge-sensitive chips, and spares pipelines often extend 18 months due to raw gallium sourcing issues. Life-extension kits for legacy S-band radars sometimes exceed 40% of new-build cost, forcing ministries to defer upgrades or freeze fleet sizes. Budget planners weigh whether the performance boost—more extended range, tighter beams, better clutter rejection—justifies reduced unit counts, a calculus that tempers overall fleet expansion.
*Our forecasts treat driver/restraint impacts as directional, not additive. The impact forecasts reflect baseline growth, mix effects, and variable interactions.
Segment Analysis
By Range: Extended Reach Drives Innovation
Medium-range systems captured 38.95% of 2024 revenue because they balance coverage and mobility for brigade-level formations. Even so, extended-range variants are forecast to post a 9.21% CAGR through 2030 as operators demand earlier threat detection beyond 100 kilometers, giving ample time for counterfires or missile interceptions. The weapon locating radar market size for extended-range equipment is set to add USD 0.24 billion between 2025 and 2030, supported by US Extended Range Cannon Artillery and South Korean K239 Chunmoo rocket programs.
Like hyper-velocity glide shells, faster projectiles require sensors with greater elevation coverage and refined Doppler processing. Saab’s Giraffe 4A tracks extend to 400 kilometers, integrating with national air-defense networks that cue interceptor missiles.[3]Saab AB, “Giraffe 4A Extended Range Test Results,” saab.com Operators also pair extended-range radars with satellites and high-altitude drones in multi-orbit architectures, creating layered sensing that improves resilience against jamming or kinetic attack. Advanced networking standards allow these far-sighted radars to disseminate cross-border launch points in seconds, supporting strategic deterrence objectives.


By Radar Type: Passive Systems Gain Momentum
Active phased-array designs held 50.66% of 2024 spending, yet passive and passive-coherent modalities will expand at a 9.10% CAGR because they emit no radio-frequency energy and avoid anti-radiation missiles. The weapon locating radar market share of passive equipment is projected to hit 21% by 2030, replacing legacy short-range fire-finder radars in high-threat zones.
IEEE field trials show that distributed passive receivers synchronized with commercial broadcast towers can localize artillery within 30 meters. Microflown AVISA’s 6,000-node acoustic array in Ukraine demonstrated practical deployment at scale, feeding coordinates to tube artillery within two minutes of detection. Passive systems shift cost from microwave hardware toward high-end processors and edge analytics, stimulating partnerships between radar primes and IT firms. Governments embrace the concept because loss of a sensor does not expose units to significant financial risk, unlike the multimillion-dollar replacement cost of an AESA panel.
By Platform: Airborne Solutions Accelerate
Due to mature logistics and established tactics, ground-based systems held 67.75% of the market share in 2024. Still, airborne payloads are expected to grow at a 9.42% CAGR as forces seek 360-degree coverage over mountainous or urban terrain.[4]General Atomics Aeronautical, “Gray Eagle ER Radar Integration,” ga-asi.com The weapon locating radar market tied to airborne systems is projected to reach USD 550 million by 2030, driven by UAV-mounted arrays that linger above 20,000 feet.
Persistent overwatch shortens the kill chain by spotting muzzle flashes and launch plumes in real time. General Atomics’ Gray Eagle ER platform links directly to fire-direction centers, cutting sensor-to-shooter latency below 20 seconds. Rotary-wing radars like Leonardo’s Osprey enable amphibious task forces to protect beachheads from indirect fire. The airborne trend imposes new power-weight tradeoffs: developers experiment with gallium-oxide transistors that promise higher efficiency, and modular panel designs that allow radars to fold into long-endurance UAV bays.

By Frequency Band: Spectrum Innovation Emerges
C-band products led with 52.62% share in 2024, aided by legacy infrastructure and well-understood propagation physics. However, the “other” category—Ka-band, Ku-band, and cognitive hopping solutions—will grow at 8.65% CAGR, unlocking fresh capacity as lower bands saturate.
Although more sensitive to rain fade, Ka-band beams deliver sharper elevation accuracy, enabling accurate impact prediction for long-range rockets. DARPA tests prove software-defined radars can jump between narrow sub-bands in milliseconds, coexisting with civilian 5G macro-cells without mutual interference. Regulatory bodies increasingly authorize conditional military use above 26 GHz, opening paths for next-generation arrays that integrate seamlessly with communications gateways for combined sensing-and-communications (SAC) roles.
Geography Analysis
North America retained 30.67% revenue share in 2024, owing to USD 400.60 million annual spending on mobile short-range air-defense radars and the US Army’s push to network artillery sensors across Joint All-Domain Command and Control nodes. Canada’s NORAD modernization demands sensors to watch Arctic launch corridors, while Mexico’s border security program asks for mobile mortar-tracking radars. The continent’s weapon locating radar market benefits from trusted domestic semiconductor supply chains that secure GaN amplifier production.
Asia-Pacific represents the fastest-advancing geography, with an 8.91% CAGR forecast. Territorial friction in the South and East China Seas, plus border stand-offs on the Himalayan frontier, accelerate indigenous design programs in China, India, South Korea, Japan, and Australia. South Korea’s export of Cheongung-II multi-function radar valued at USD 867 million to Saudi Arabia illustrates the region’s growing competitiveness. Australia’s CEA Technologies packages active arrays and counter-UAV sensors on armored vehicles as part of Project Land 19, showing commitment to home-grown solutions.
Europe focuses on post-Ukraine rearmament that channels funds into mobile counter-battery fleets interoperable across NATO brigades. Germany, France, and the United Kingdom coordinate requirements to share spare parts and training pipelines, reducing long-term costs. HENSOLDT’s EUR 350 million (USD 414.59 million) ECRS Mk1 radar contract and the United Kingdom’s purchase of 25 Serpens close-find radars confirm sustained momentum. Smaller allies Latvia and Slovenia pool orders for TRML-4D units, leveraging economies of scale. The European Defence Fund earmarks passive-coherent research grants aligning with survivability lessons learned on the Eastern Front.


Competitive Landscape
Industry concentration is moderate: the top five suppliers account for most worldwide revenue. RTX Corporation, Lockheed Martin Corporation, Thales Group, Saab AB, and Bharat Electronics Limited dominate high-power active arrays. At the same time, niche specialists like Microflown AVISA and CEA Technologies capture share in passive and short-range segments. Competitive intensity rises because mid-tier manufacturers from South Korea, Turkey, and Israel capitalize on export-control gaps to sell sovereign solutions.
Strategic moves cluster around multifunction integration. Lockheed Martin Corporation embeds weapon-location algorithms into its Sentinel A4 air-defense radar, and RTX Corporation migrates counter-battery modes onto LTAMDS, reducing separate fleet requirements. Partnerships between primes and cloud providers target AI-accelerated trajectory prediction: Northrop Grumman teams with AWS for machine-learning inference at the edge. Meanwhile, disruptors pursue acoustic or infrared modalities that complement RF-based detection.
Pricing pressures mount as customers compare GaN upgrades with buying new passive swarms. To protect margin, incumbents offer performance-based logistics, guaranteeing radar availability above 95% in exchange for multiyear support contracts. Some Western OEMs accept licensed local assembly—Hanwha’s Saudi localization plan is a precedent—to meet domestic-content rules and sidestep import caps.
Weapon Locating Radar Industry Leaders
Lockheed Martin Corporation
RTX Corporation
Saab AB
Thales Group
Bharat Electronics Limited
- *Disclaimer: Major Players sorted in no particular order


Recent Industry Developments
- March 2025: Bharat Electronics Limited delivered the 49th Swathi weapon, locating the radar for the Indian Army and strengthening its defense capabilities along disputed borders. This delivery concludes the batch of 12 radars ordered by the army in March 2023.
- September 2024: Saab AB delivered five Arthur weapon-locating radar systems to the British Army. These advanced systems enhance the army's capability to identify and respond effectively to artillery threats.


Global Weapon Locating Radar Market Report Scope
| Short Range |
| Medium Range |
| Long Range |
| Extended Range |
| Active Phased Array |
| Passive/Passive-Coherent |
| Others |
| Ground |
| Airborne |
| Naval |
| L-/S-band |
| C-band |
| Others |
| North America | United States | |
| Canada | ||
| Mexico | ||
| Europe | United Kingdom | |
| France | ||
| Germany | ||
| Italy | ||
| Spain | ||
| Rest of Europe | ||
| Asia-Pacific | China | |
| India | ||
| Japan | ||
| South Korea | ||
| Australia | ||
| Rest of Asia-Pacific | ||
| South America | Brazil | |
| Argentina | ||
| Rest of South America | ||
| Middle East and Africa | Middle East | United Arab Emirates |
| Saudi Arabia | ||
| Rest of Middile East | ||
| Africa | South Africa | |
| Rest of Africa | ||
| By Range | Short Range | ||
| Medium Range | |||
| Long Range | |||
| Extended Range | |||
| By Radar Type | Active Phased Array | ||
| Passive/Passive-Coherent | |||
| Others | |||
| By Platform | Ground | ||
| Airborne | |||
| Naval | |||
| By Frequency Band | L-/S-band | ||
| C-band | |||
| Others | |||
| By Geography | North America | United States | |
| Canada | |||
| Mexico | |||
| Europe | United Kingdom | ||
| France | |||
| Germany | |||
| Italy | |||
| Spain | |||
| Rest of Europe | |||
| Asia-Pacific | China | ||
| India | |||
| Japan | |||
| South Korea | |||
| Australia | |||
| Rest of Asia-Pacific | |||
| South America | Brazil | ||
| Argentina | |||
| Rest of South America | |||
| Middle East and Africa | Middle East | United Arab Emirates | |
| Saudi Arabia | |||
| Rest of Middile East | |||
| Africa | South Africa | ||
| Rest of Africa | |||


Key Questions Answered in the Report
How large is the weapon locating radar market in 2025?
The weapon locating radar market size stood at USD 1.40 billion in 2025 and is projected to reach USD 2.06 billion by 2030, reflecting an 8.03% CAGR through the forecast period.
Which range category is growing fastest?
Extended-range radars are expanding at 9.21% CAGR because they detect threats beyond 100 kilometers.
Why are passive radars gaining importance?
Passive and passive-coherent systems avoid emitting RF energy, improving survivability against anti-radiation weapons.
Which region leads demand growth?
Asia-Pacific shows the fastest rise, with an 8.91% CAGR driven by territorial tensions and modernization.
What are the main cost challenges for operators?
GaN-based AESA upgrades impose high lifecycle expenses due to specialized components and secure supply chains.
Page last updated on:


