Military Radars Market Size and Share
Market Overview
| Study Period | 2019 - 2031 |
|---|---|
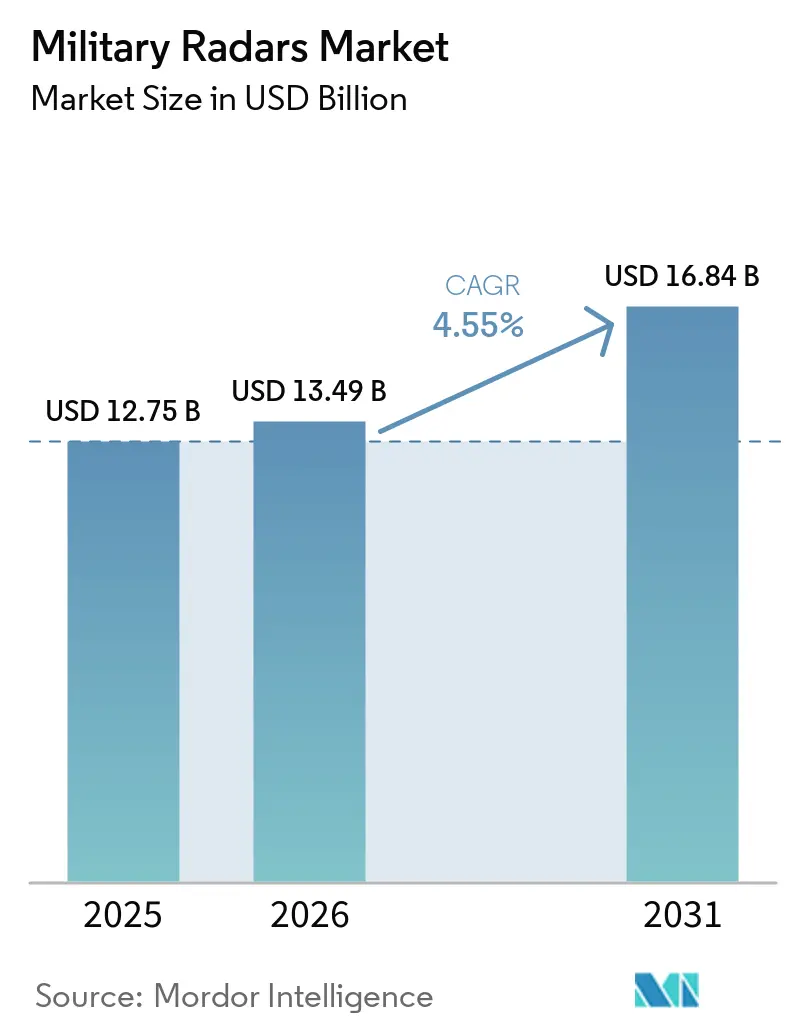
| Market Size (2026) | USD 13.49 Billion |
| Market Size (2031) | USD 16.84 Billion |
| Growth Rate (2026 - 2031) | 4.55% CAGR |
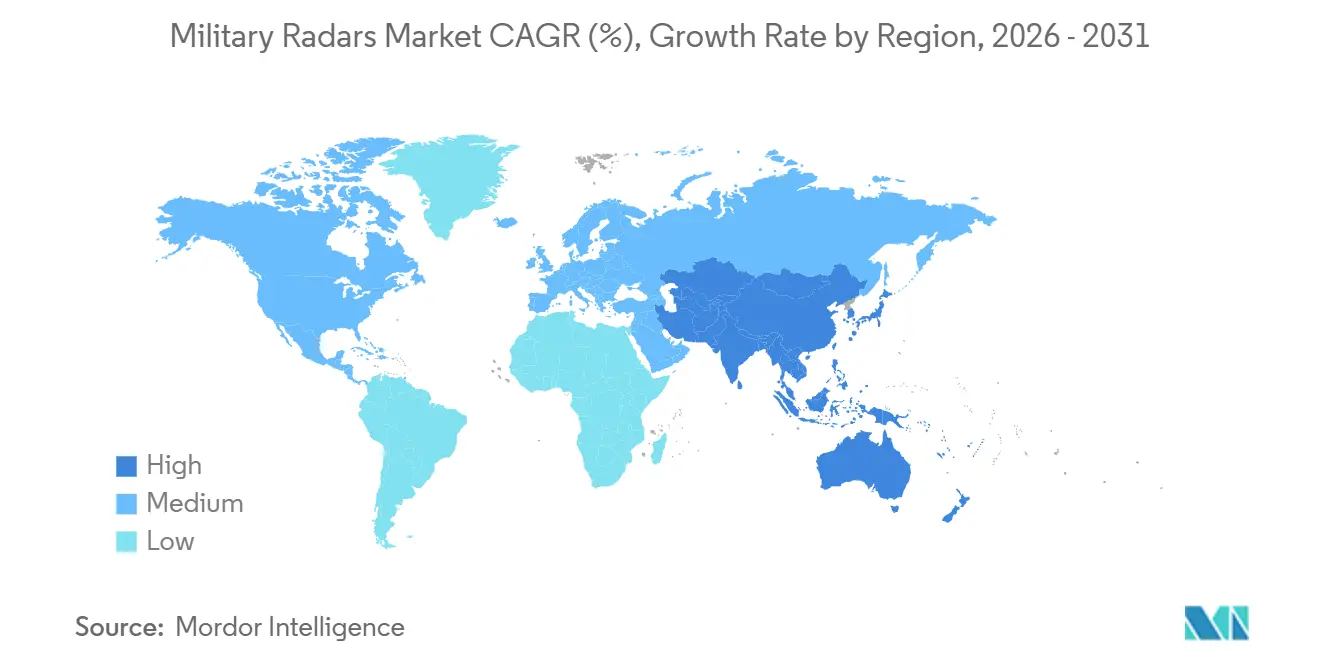
| Fastest Growing Market | Asia-Pacific |
| Largest Market | North America |
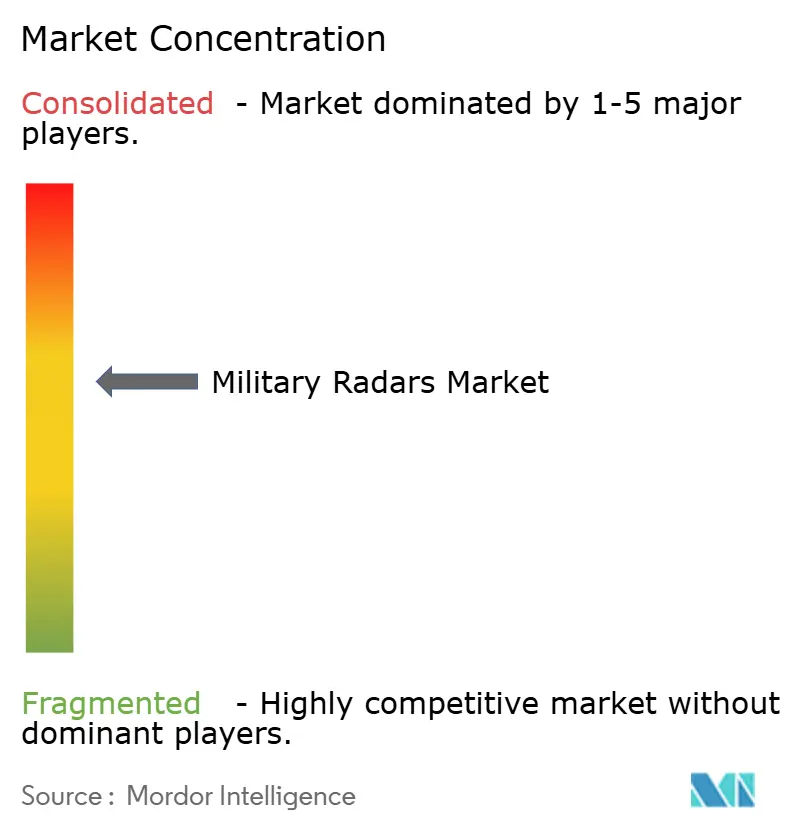
| Market Concentration | Medium |
Major Players *Disclaimer: Major Players sorted in no particular order Image © Mordor Intelligence. Reuse requires attribution under CC BY 4.0. | |
Military Radars Market Analysis by Mordor Intelligence
The military radars market size is expected to grow from USD 12.75 billion in 2025 to USD 13.49 billion in 2026 and is forecast to reach USD 16.84 billion by 2031 at a 4.55% CAGR over 2026-2031. Demand is shifting from platform-centric purchases to network-enabled sensor ecosystems that link radar outputs across air, land, sea, space, and cyber domains to support real-time joint decision-making. Growth is driven by open architectures, multi-function AESA adoption, and digital signal processing advancements, enhancing range, discrimination, coverage, and enabling faster software-based upgrades through improved technical capabilities. Regions with recapitalization programs emphasize air and missile defense, early warning, and counter-drone missions, necessitating 360-degree surveillance and rapid tracking updates to enhance operational readiness and situational awareness. Suppliers are responding with modular building blocks and software-defined features to shorten upgrade cycles and protect installed bases.
Key Report Takeaways
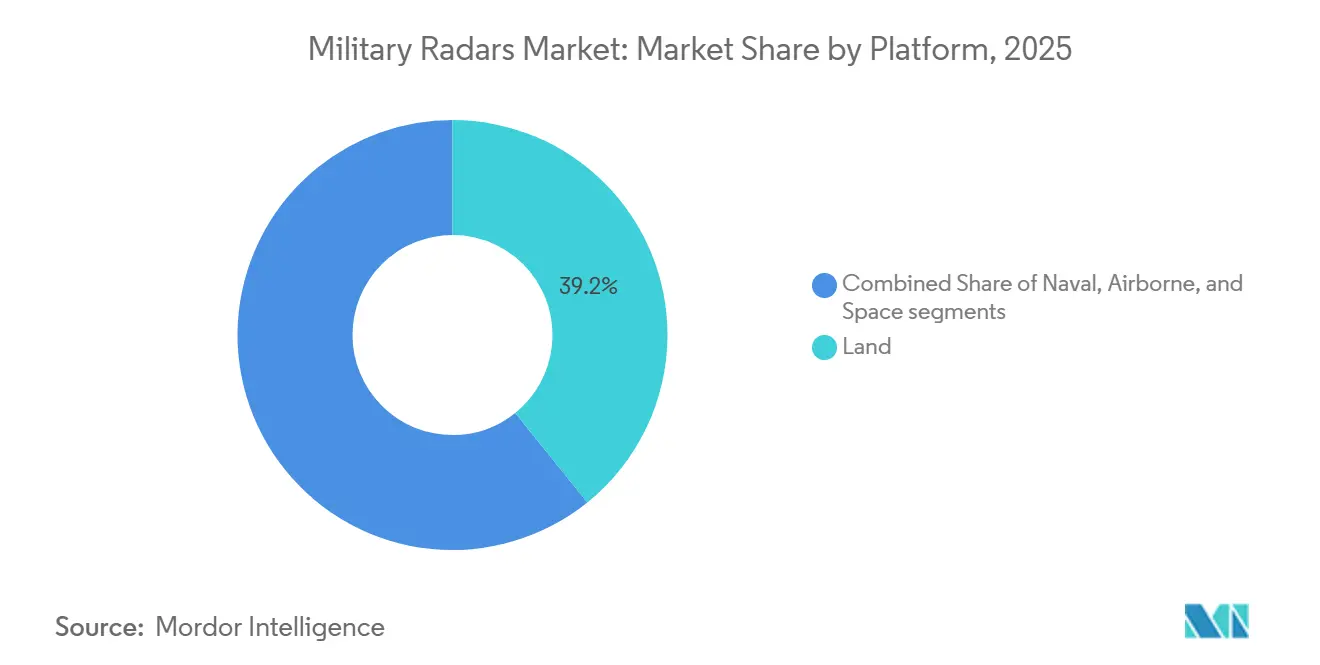
- By platform, land systems accounted for 39.21% of revenue in 2025, while airborne platforms are forecasted to grow at a 6.15% CAGR through 2031.
- By product type, tracking and fire control captured a 31.57% share in 2025, and surveillance and airborne early warning are projected to grow at a 6.45% CAGR to 2031.
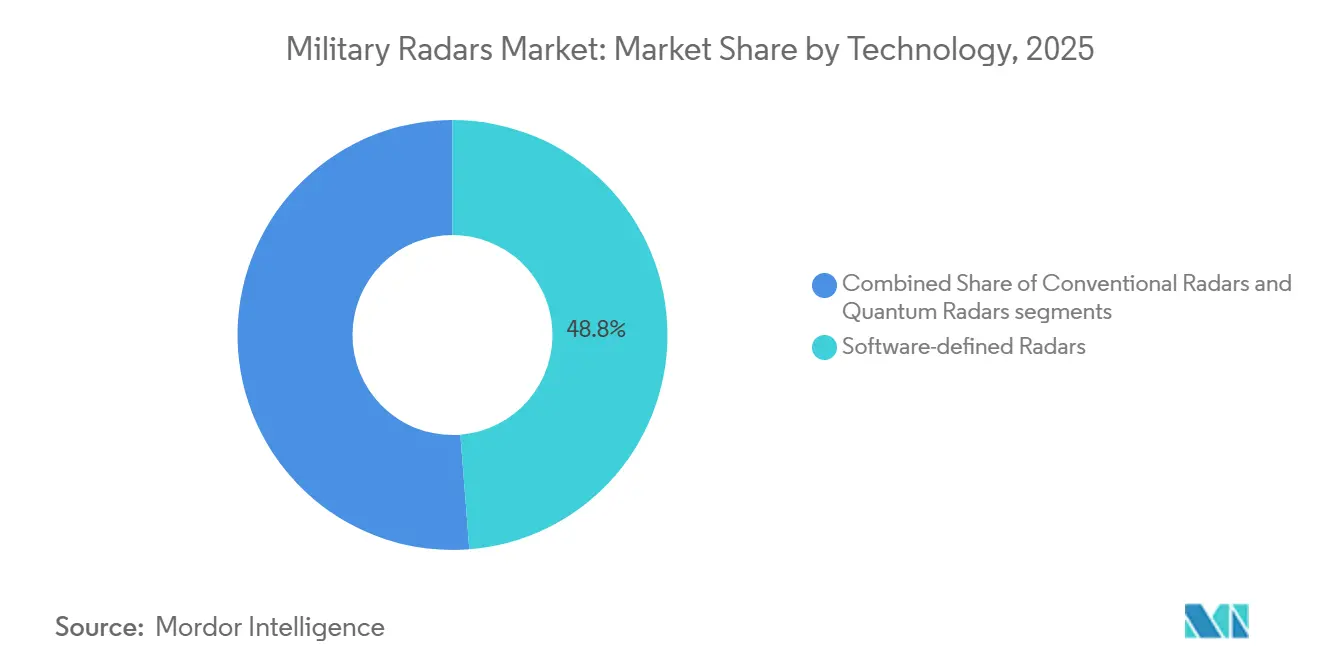
- By technology, software-defined radars held 48.75% share in 2025, while quantum radars are projected to grow at a 5.85% CAGR through 2031.
- By range, long-range systems accounted for a 41.25% share in 2025, and medium-range systems are set to advance at a 5.33% CAGR through 2031.
- By component, antennas held a 26.85% share in 2025, and signal processors are expected to record the fastest growth at a 6.73% CAGR through 2031.
- By geography, North America accounted for 37.38% of the military radars market share in 2025, and Asia-Pacific is forecasted to be the fastest-growing region at a 7.12% CAGR through 2031.
Note: Market size and forecast figures in this report are generated using Mordor Intelligence’s proprietary estimation framework, updated with the latest available data and insights as of 2026.
Global Military Radars Market Trends and Insights
Drivers Impact Analysis*
| Driver | % Impact on CAGR Forecast | Geographic Relevance | Impact Timeline |
|---|---|---|---|
| Growing geopolitical tensions and defense modernization budgets | +1.8% | Global, with concentration in NATO members, Indo-Pacific (Japan, South Korea, Australia), and Middle East | Medium term (2-4 years) |
| Rapid deployment needs for counter-UAS and hypersonic threats | +1.2% | North America, Europe, Asia-Pacific, with early adoption in Israel and UAE | Short term (≤ 2 years) |
| Shift toward multi-function AESA and software-defined radar | +1.0% | Global, led by US, European consortia, and emerging defense exporters (South Korea, Turkey) | Medium term (2-4 years) |
| Integration of radar data into joint all-domain command-and-control (JADC2) | +0.9% | North America and Five Eyes nations, expanding to NATO and Indo-Pacific allies | Long term (≥ 4 years) |
| Modular open systems architecture (MOSA) driving lifecycle cost savings | +0.5% | US and NATO member states implementing Title 10 USC mandates | Long term (≥ 4 years) |
| Under-ice and arctic surveillance requirements due to polar route opening | +0.3% | Arctic rim nations (US, Canada, Norway, Russia), with spillover to Nordic states | Long term (≥ 4 years) |
| Source: Mordor Intelligence | |||
Growing Geopolitical Tensions and Defense Modernization Budgets
Procurement pipelines prioritize advanced air and missile defense systems, early warning technologies, and multi-mission radar solutions, supported by contracts for interceptors and sensors essential to developing comprehensive layered defense frameworks. Lockheed Martin’s USD 9.8 billion award in September 2025 for 1,970 PAC-3 MSE missiles reflects a sustained push to harden air and missile defense postures while scaling production capacity.[1]Lockheed Martin, “US Army Awards Lockheed Martin USD 9.8B Contract to Bolster Missile Defense with PAC-3 MSE,” lockheedmartin.com BAE Systems’ full-rate production contract for 40 ECRS Mk2 AESA radars for Royal Air Force Typhoons, with service entry by decade’s end, underscores Europe’s strategic investment in advanced airborne sensor technologies to strengthen air dominance capabilities. Independent oversight emphasized improved planning to leverage MOSA benefits across weapon system portfolios, prioritizing modular radar designs for rapid technology insertion. These initiatives align modernization budgets with the Military Radars market, where multi-mission coverage and software-defined upgrades are integral to advancing operational capabilities and ensuring technological adaptability.
Rapid Deployment Needs for Counter-UAS and Hypersonic Threats
Operational requirements are converging on radars that detect small drones at short ranges while tracking complex high-speed threats at longer ranges within the same networked architecture. L3Harris Technologies, Inc. underscores the role of sensing architectures in hypersonic defense, integrating onboard processing and kill chain systems to streamline target engagement timelines.[2]L3Harris Communications, “Hypersonics: Driving Innovation in Defense,” L3Harris Capabilities, l3harris.com Investments are enhancing radar capabilities in detection, tracking, and engagement, fostering consistent growth in the military radars market as multi-threat environments become integral to operational planning.
Shift Toward Multi-Function AESA and SDR
Multi-function AESA radars enable concurrent surveillance, tracking, and fire-control tasks, while software updates add mission features without requiring wholesale hardware replacement. HENSOLDT showcased a software-defined defense approach that uses containerized applications to promote interoperability and upgradeability across heterogeneous sensors, pointing to faster integration cycles in the military radars market. Efficiency and thermal considerations drive design decisions, as GaN devices enable higher power and efficiency but demand advanced cooling and scalable power management systems to accommodate increasing element counts in dense AESA arrays. The adoption of element-level digital beamforming and wider instantaneous bandwidths increases reliance on high-speed data converters and embedded computing, driving demand for signal processing chain components integral to these advanced system architectures.
Integration of Radar Data Into JADC2 Architecture
Integration of radar data into Joint All-Domain Command and Control (JADC2) mission systems is moving toward common operating pictures built from multiple radar sources, with cloud-enabled and edge-enabled fusion workflows now tested across services and allies. Lockheed Martin Corporation demonstrated 5G-enabled multi-domain operations, integrating air, land, sea, space, and cyber sensors into resilient networks and redefining radars as primary sources of fused tracks rather than isolated data feeds. Open-architecture policies mandate interoperable hardware and software interfaces in new programs, aligning MOSA requirements with JADC2 objectives to streamline integration and sustainment processes and ensure compliance with technical interoperability standards.
Restraints Impact Analysis*
| Restraint | % Impact on CAGR Forecast | Geographic Relevance | Impact Timeline |
|---|---|---|---|
| Supply chain constraints for GaN semiconductor materials | −0.6% | North America, Europe, extended global reach | Short term (≤ 2 years) |
| Spectrum allocation pressures from commercial 5G/6G roll-outs | −0.4% | North America, Asia-Pacific, global | Medium term (2–4 years) |
| Cyber vulnerabilities in network-centric radar architectures | −0.3% | NATO and Five Eyes countries | Medium term (2–4 years) |
| Capital intensive testing and certification for multi-band systems | −0.3% | Europe, North America | Long term (≥ 4 years) |
| Source: Mordor Intelligence | |||
Supply Chain Constraints for GaN Semiconductor Materials
The gallium supply chain introduces fragility to radar production, given GaN's centrality to high-power, high-frequency operation and the concentration of primary gallium refining. Constraints in the gallium value chain and semiconductor supply risks may disrupt radar subsystem delivery and costs. Program designers address this by implementing modular architectures and standards-based embedded computing, enabling substitution and multi-sourcing. This strategy aligns with MOSA objectives, ensuring resilient sustainment and adaptability in technical systems. GaN's efficiency and thermal performance advantages support radar adoption, though cost and availability constraints may affect platform selection and upgrade timelines in the military radars market.
Spectrum Allocation Pressures from Commercial 5G/6G Rollouts
Mid-band frequencies attractive for mobile broadband often overlap with radar allocations, raising coexistence challenges in dense urban corridors and around critical infrastructure. European defense research prioritizes multiband operation and intelligent spectrum management within next-generation radar concepts, a signal that spectrum scarcity is an integral design assumption for future systems. As mission owners seek uninterrupted detection performance, vendors are increasing their emphasis on adaptive waveforms, digital beamforming, and interference rejection techniques, which connect capability advances with regulatory realities in the military radars market. Program sponsors and integrators are also moving toward open interfaces that support rapid insertion of spectrum-sharing solutions, which aligns spectrum policy dialogues with MOSA-driven product roadmaps.
*Our forecasts treat driver/restraint impacts as directional, not additive. The impact forecasts reflect baseline growth, mix effects, and variable interactions.
Segment Analysis
By Platform: Mobile Sensors Rebalance Legacy Land Dominance
Land systems commanded 39.21% of the military radars market in 2025 as mobile AESA deployments matured and nations prioritized ground-based air defense coverage within layered defense architectures. Airborne platforms are projected to grow the fastest at a 6.15% CAGR, supported by fighter, ISR, and AEW upgrades that integrate multi-mode AESA radars to enhance both surveillance and engagement functions. Naval modernization continues, with shipboard strategic radars moving to scalable arrays and software-defined features to extend sensitivity and range under heavy clutter conditions. Space-based sensing remains small in value terms but is strategically vital for space domain awareness and for detecting orbital activities that ground-based optical sensors miss, a role complemented by ground UHF surveillance, such as Thales. The military radars market emphasizes platform-agnostic integration, prioritizing common data models and scalable processing solutions to ensure adaptability and interoperability across operational domains.
Airborne growth is reinforced by investments in next-generation fighter radars and electronic architectures that support aggressive electronic protection and multiple concurrent modes of operation. The Royal Air Force’s ECRS Mk2 AESA production contract illustrates the importance of agile airborne sensors, including electronic attack features integrated alongside advanced search and track.[3]BAE Systems Media Team, “Investment to Deliver Advanced New Radar for Royal Air Force Typhoons,” BAE Systems News, baesystems.com Land forces continue shifting to digital AESA designs with higher element counts and full-azimuth coverage, serving as both air-surveillance and fire-control nodes within integrated air and missile defense networks.


By Product Type: Multifunction Arrays Become Program Baselines
Tracking and fire control systems held a 31.57% share in 2025, reflecting their central role in guiding interceptors and enabling engagement-quality tracking within air and missile defense architectures. Surveillance and airborne early warning are forecast to outpace other categories at a 6.45% CAGR as programs invest in wide-area coverage, long-range detection, and resilient performance under jamming and clutter. Israel Aerospace Industries delivered its 250th Multi-Mission Radar in June 2025, highlighting the global demand for multi-mission surveillance systems capable of monitoring dense target sets in complex threat environments. Multifunction radars integrating missions on a single aperture are prioritized for upgradeability and reduced logistics, ensuring efficient lifecycle cost management within the military radars market.
Surveillance programs are also expanding into regional industrial cooperation and local manufacturing to shorten supply timelines and advance sovereignty goals. Counter-drone radars remain a focus for rapid fielding. Still, programs are consolidating around multi-mission solutions that can detect small RCS objects while contributing to a wider air picture, which favors software-defined upgrades that keep pace with threat evolution. This combination of surveillance priority, multifunction integration, and industrial collaboration supports steady value creation in the military radars market.
By Technology: Software Definition Dominates as Quantum Emerges
Software-defined radars accounted for 48.75% of technology share in 2025, indicating a clear preference for architectures that deliver capability growth through software and modular hardware updates. Conventional radars still compete in missions where acquisition budgets favor mature performance at lower price points, while quantum concepts remain in R&D with staged paths toward operational testing and evaluation. HENSOLDT's software-defined defense demonstrations highlight the use of containerized applications and open interface standards to expedite the integration of diverse sensors. This approach is reflected across its airborne and ground-based radar portfolios.
Quantum radars are advancing at a 5.62% CAGR, driven by their potential for sensing advantages in contested environments. However, near-term procurement efforts remain focused on field-proven AESA systems, which offer the flexibility of software-based upgrades rather than relying on hardware refresh cycles. The technology roadmap highlights software-defined approaches leading the military radars market, while quantum concepts advance through targeted prototypes and collaborative experiments, emphasizing innovation through strategic development and partnerships.
By Range: Medium Segments Reinforce Layered Defense
Long-range systems led with 41.25% share in 2025, serving strategic surveillance and early warning missions for aircraft, missiles, and orbital activity tracking. Medium-range radars are expected to grow the fastest, at a 5.33% CAGR, as operators seek to fill coverage gaps, improve discrimination, and add persistent 360-degree tracking without the footprint of the largest arrays. Thales unveiled AURORE in 2025, Europe’s largest UHF space surveillance radar, which supports continuous monitoring of low Earth orbit objects and demonstrates how long-range radars are evolving to address space and hypersonic-relevant tracking tasks. As medium-range systems adopt digital beamforming and GaN-based amplification, they present a compelling balance of coverage, sensitivity, and deployment agility for integrated air and missile defense architectures. The military radars market is therefore aligning range-class choices with broader mission portfolios to ensure continuous coverage across altitudes and engagement zones.
R&D priorities include multiband operation and intelligent spectrum management to ensure radars maintain fidelity under interference and congestion, as emphasized in the European defense research funding priorities for 2025. Vendors are tuning medium-range portfolios toward multi-role delivery that combines surveillance, tracking, and cueing to interceptors, a configuration that shortens kill chains without relying exclusively on strategic sensors. The proliferation of these systems drives program sponsors to prioritize seamless integration with command-and-control infrastructures and coalition data exchanges, ensuring consistent growth in the military radars market.
By Component: Processing Elements Capture Margins
Antennas held a 26.85% share of components in 2025, driven by the broad adoption of AESA architectures and the shift to GaN-powered transmit/receive modules that enable higher power density in compact form factors. Thermal management and power regulation advances remain essential for multi-mission radars, where device efficiency and cooling strategies impact size, weight, and power, especially on airborne platforms. The military radars market is placing greater emphasis on processors, converters, and firmware that unlock higher functional density from a given aperture.
Signal processors are forecast to be the fastest-growing component, with a 6.73% CAGR, as elemental digital beamforming increases the need for data conversion and parallel processing to support multiple beams and modes concurrently. Open standards in embedded computing, such as VPX and OpenVPX within MOSA-aligned integrations, define vendor interface design and upgrade configurations for line-replaceable units. These standards are pivotal in the military radars market, enabling rapid translation of component-level advancements into operational capabilities and thereby enhancing value capture and technological adaptability.
Geography Analysis
North America held 37.38% of the military radars market in 2025, driven by large installed bases and modernization programs across air and missile defense. Asia-Pacific is the fastest-growing region, with a 7.12% CAGR through 2031, as regional programs scale airborne and ground-based coverage and advance indigenous radar capabilities. Japan's Aegis System-Equipped Vessels are expected to be commissioned later this decade, supported by AN/SPY-7(V)1 deliveries that enhance naval air and missile defense capabilities in the region. These developments align with the military radars market's continued procurement of 360-degree arrays and multi-mission sensors for both established and growing fleets.
Europe maintains steady momentum supported by national procurements and EU-level funding that prioritizes radar capability and sovereignty goals. Thales secured contracts with the Qatar Emiri Air Force in January 2026, including Ground Master family radars and extended maintenance support, which underscores export demand for multi-mission coverage within integrated air defense. Industrial expansion continues in the Gulf, where Thales and Tawazun agreed to set up local Ground Master production by 2027, linking regional sustainment and manufacturing to delivery schedules. Together, these developments support a diversified demand base in the military radars market as European and Middle Eastern defense priorities converge on multi-mission radars and open systems.
Middle East and selected emerging markets sustain procurement focused on layered air defense, maritime surveillance, and border security. Local production commitments, paired with service agreements, aim to stabilize availability and lifecycle readiness, a pattern evident across multiple regional awards and MOUs. North American and European vendors continue to compete through technology leadership and open-architecture roadmaps. At the same time, Asia-Pacific suppliers build scale and portfolio depth through indigenous programs and exports, trends that together shape the regional mix of the military radars market.

Competitive Landscape
The military radars market is moderately concentrated, with key players such as Lockheed Martin Corporation, RTX Corporation, Northrop Grumman Corporation, BAE Systems plc, and Israel Aerospace Industries Ltd. accounting for a significant share of the projected 2025 revenue. Prime contractors maintain leadership through broad portfolios and deep integration capabilities, while regional champions and specialized integrators grow share in targeted niches.
Lockheed Martin’s agreement in January 2026 with the US government to expand PAC-3 MSE production to 2,000 missiles per year by 2033 illustrates how capacity expansions in adjacent segments influence radar-linked demand for engagement-quality tracking and cueing. RTX Corporation is scaling air defense production and modernization activities, including the FAA’s selection of Collins Aerospace for next-generation cooperative and non-cooperative surveillance radars under the radar system replacement program, which showcases dual-use capability that also benefits military applications.
Evolving standards and procurement policies are reshaping competitive strategy toward open, upgradeable, and interoperable designs that can scale across platforms and coalitions. Independent oversight has pushed for better planning to realize MOSA’s promised benefits, a dynamic that favors primes and integrators with proven open-architecture track records and supplier networks. Collectively, these developments indicate steady, moderate concentration in the military radars market with strong positions for established primes and meaningful openings for regionally focused and technology-led challengers.
Military Radars Industry Leaders
Lockheed Martin Corporation
Northrop Grumman Corporation
RTX Corporation
BAE Systems plc
Israel Aerospace Industries Ltd.
- *Disclaimer: Major Players sorted in no particular order

Recent Industry Developments
- April 2026: The Indian Ministry of Defence (MoD) formalized a contract worth INR 1,950 crores (approximately USD 210 million) to develop and supply cutting-edge mountain radars tailored for the Indian Air Force.
- September 2025: The Polish Armaments Group (PGZ-Narew consortium) signed a USD 1.6 billion contract to supply 46 passive-location radars for Poland's short-range air and missile defense system.
- July 2025: The Indian MoD awarded Bharat Electronics Limited a contract worth approximately INR 2,000 crore (USD 240 million) to supply air defense fire control radars to the Indian Army.
- April 2025: The Swedish Defence Materiel Administration (FMV) awarded a contract to Thales Group to supply its Ground Master 200 MM/C multirole compact radars.


Global Military Radars Market Report Scope
Military radars are specialized electronic systems that use radio waves to detect, track, and identify objects such as aircraft, missiles, ships, and vehicles. By gauging an object's distance, direction, speed, and altitude, these radars furnish vital data for surveillance, early warnings, and weapon control, underscoring their importance in national defense and battlefield awareness. Engineered for mobility and all-weather operation, these advanced systems adeptly manage multiple targets, bolstering operations across air defense and border security.
The military radars market is segmented by platform, product type, technology, range, component, and geography. By platform, the market is segmented into land, naval, airborne, and space. By product type, the market is segmented into surveillance and airborne early warning radars, tracking and fire control radars, multifunction radars, weapon locating and C-RAM radars, ground penetrating radars, weather radars, counter-drone radars, and others. By technology, the market is segmented into software-defined radars, conventional radars, and quantum radars. By range, the market is segmented into short-range, medium-range, and long-range. By component, the market is segmented into antennas, transmitters, receivers, signal processors, power amplifiers, stabilization systems, and others. The report also covers the market sizes and forecasts for the military radars market in major countries across different regions. For each segment, the market size is provided in terms of value (USD).
| Land |
| Naval |
| Airborne |
| Space |
| Surveillance and Airborne Early Warning Radars |
| Tracking and Fire Control Radars |
| Multifunction Radars |
| Weapon Locating and C-RAM Radars |
| Ground Penetrating Radars |
| Weather Radars |
| Counter-Drone Radars |
| Other |
| Software-Defined Radars |
| Conventional Radars |
| Quantum Radars |
| Short-range |
| Medium-range |
| Long-range |
| Antenna |
| Transmitter |
| Receiver |
| Signal Processor |
| Power Amplifier |
| Stabilization Systems |
| Others |
| North America | United States | |
| Canada | ||
| Mexico | ||
| Europe | United Kingdom | |
| France | ||
| Germany | ||
| Russia | ||
| Rest of Europe | ||
| Asia-Pacific | China | |
| India | ||
| Japan | ||
| South Korea | ||
| Australia | ||
| Rest of Asia-Pacific | ||
| South America | Brazil | |
| Rest of South America | ||
| Middle East and Africa | Middle East | United Arab Emirates |
| Saudi Arabia | ||
| Israel | ||
| Rest of Middle East | ||
| Africa | South Africa | |
| Rest of Africa | ||
| By Platform | Land | ||
| Naval | |||
| Airborne | |||
| Space | |||
| By Product Type | Surveillance and Airborne Early Warning Radars | ||
| Tracking and Fire Control Radars | |||
| Multifunction Radars | |||
| Weapon Locating and C-RAM Radars | |||
| Ground Penetrating Radars | |||
| Weather Radars | |||
| Counter-Drone Radars | |||
| Other | |||
| By Technology | Software-Defined Radars | ||
| Conventional Radars | |||
| Quantum Radars | |||
| By Range | Short-range | ||
| Medium-range | |||
| Long-range | |||
| By Component | Antenna | ||
| Transmitter | |||
| Receiver | |||
| Signal Processor | |||
| Power Amplifier | |||
| Stabilization Systems | |||
| Others | |||
| By Geography | North America | United States | |
| Canada | |||
| Mexico | |||
| Europe | United Kingdom | ||
| France | |||
| Germany | |||
| Russia | |||
| Rest of Europe | |||
| Asia-Pacific | China | ||
| India | |||
| Japan | |||
| South Korea | |||
| Australia | |||
| Rest of Asia-Pacific | |||
| South America | Brazil | ||
| Rest of South America | |||
| Middle East and Africa | Middle East | United Arab Emirates | |
| Saudi Arabia | |||
| Israel | |||
| Rest of Middle East | |||
| Africa | South Africa | ||
| Rest of Africa | |||


Key Questions Answered in the Report
What is the current size of the military radars market and how fast is it growing?
The military radars market size is USD 12.75 billion in 2025 and is projected to reach USD 16.84 billion by 2031 at a 4.55% CAGR.
Which segments are growing fastest in military radars and why?
Airborne platforms, surveillance and AEW products, medium-range systems, and signal processors are growing fastest due to multi-mission demand, 360-degree coverage, and software-defined upgrades.
Which regions lead demand and growth for military radars?
North America holds the largest share at 37.38% in 2025 while Asia-Pacific is the fastest growing at a 7.12% CAGR through 2031.
How are open architectures changing military radars procurement?
MOSA and related standards encourage interoperable, upgradeable radars, reducing vendor lock-in and speeding insertion of new waveforms and processors.
What technologies are most influential in military radars today?
Multi-function AESA, GaN power devices, software-defined radar, and advanced signal processors drive performance, with quantum concepts progressing through research.
What recent deals illustrate momentum in military radars?
Awards include PAC-3 MSE scale-up, FAA radar modernization with RTX’s Condor Mk3 and ASR-XM, ECRS Mk2 production, AURORE space surveillance deployment, and IAI’s 250th MMR delivery.
Page last updated on:


