Market Overview
| Study Period | 2019 - 2031 |
|---|---|
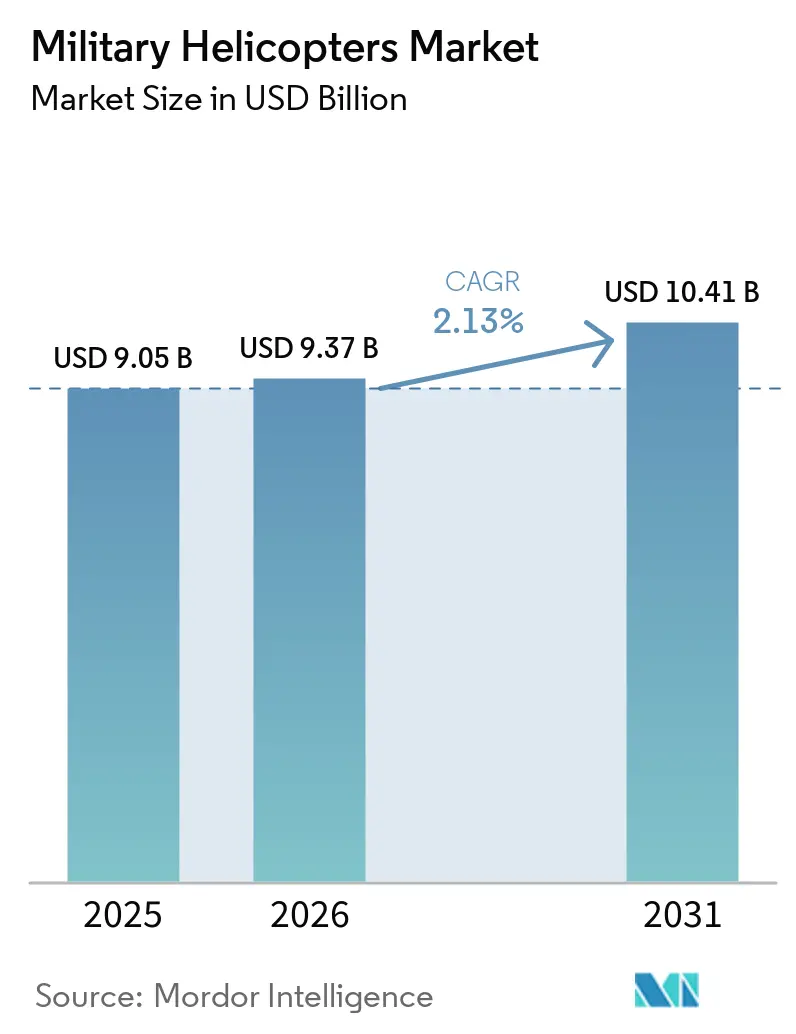
| Market Size (2026) | USD 9.37 Billion |
| Market Size (2031) | USD 10.41 Billion |
| Growth Rate (2026 - 2031) | 2.13% CAGR |
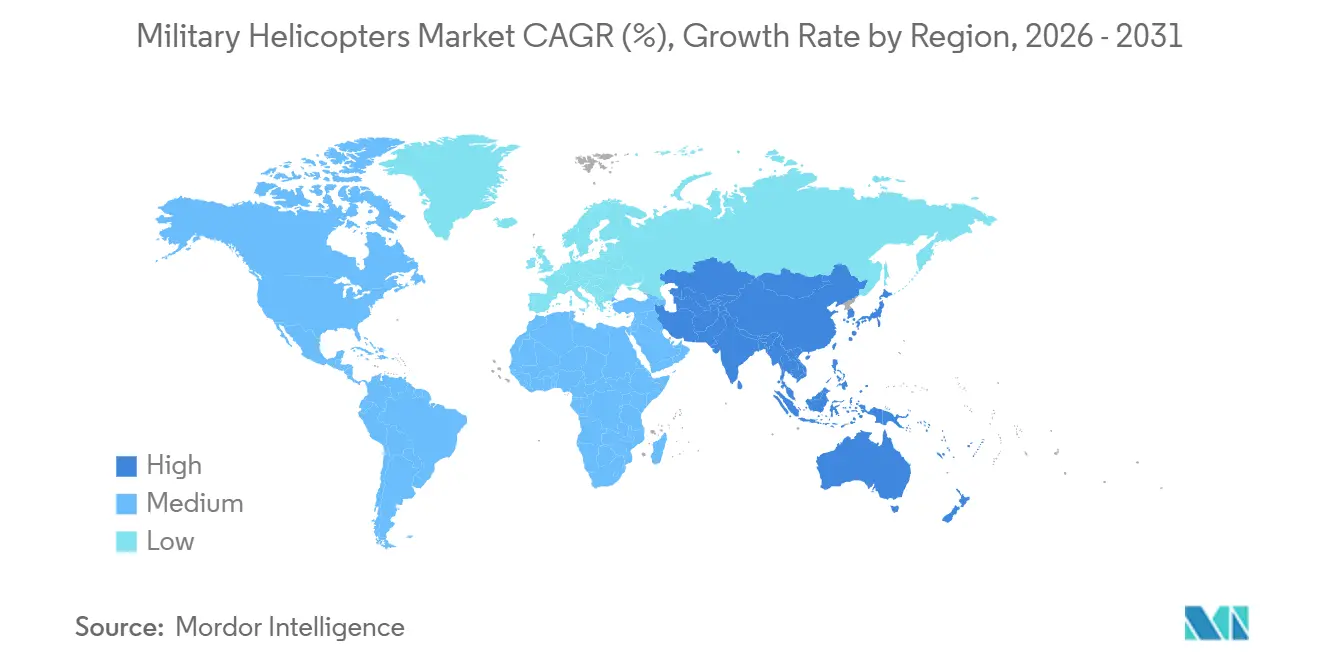
| Fastest Growing Market | Asia Pacific |
| Largest Market | North America |
| Market Concentration | Medium |
Major Players *Disclaimer: Major Players sorted in no particular order Image © Mordor Intelligence. Reuse requires attribution under CC BY 4.0. | |
Military Helicopters Market Analysis by Mordor Intelligence
The military helicopters market size is expected to grow from USD 9.05 billion in 2025 to USD 9.37 billion in 2026 and is forecasted to reach USD 10.41 billion by 2031 at a 2.13% CAGR over 2026-2031. Accelerated fleet modernization programs, rising defense budgets in key regions, and a growing demand for multi-mission modular platforms are driving the global military helicopters market. These platforms support a range of functions, including troop transport, combat support, reconnaissance, and disaster response, all within a single architecture. Procurement momentum is bolstered by the adoption of Future Vertical Lift (FVL) initiatives, enhanced integration of manned-unmanned teaming (MUM-T) capabilities, and a growing reliance on predictive maintenance and health-monitoring systems. These advancements aim to boost operational readiness and minimize downtime. Yet, the market faces challenges: high lifecycle and sustainment costs, budgetary constraints in various defense ministries, stringent export-control and technology-transfer regulations, and mounting competition from armed UAVs, which are increasingly dominating ISR and attack missions. Looking ahead, the market is poised to transition towards digitally enabled, software-defined rotorcraft ecosystems. Key trends shaping future demand include a pronounced focus on open-system avionics, autonomous teaming, hybrid-electric propulsion concepts, and localized manufacturing partnerships, especially in the Asia-Pacific region. These trends underscore the importance of technological interoperability, survivability in contested environments, and modular upgradeability.
Key Report Takeaways
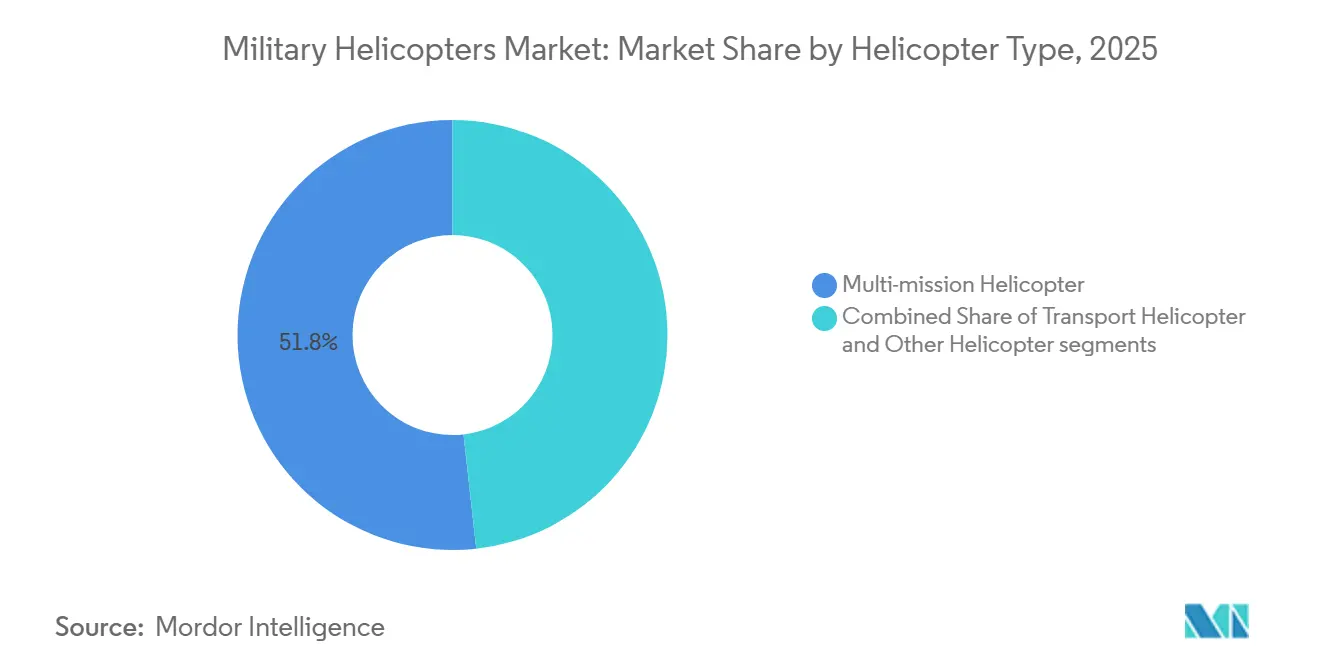
- By helicopter type, multi-mission helicopters led with 51.76% revenue share in 2025, while transport helicopters are forecasted to expand at a 5.73% CAGR through 2031.
- By end user, Army Aviation accounted for 42.83% in 2025, while the Air Force segment is expected to grow at the highest CAGR of 4.24% through 2031.
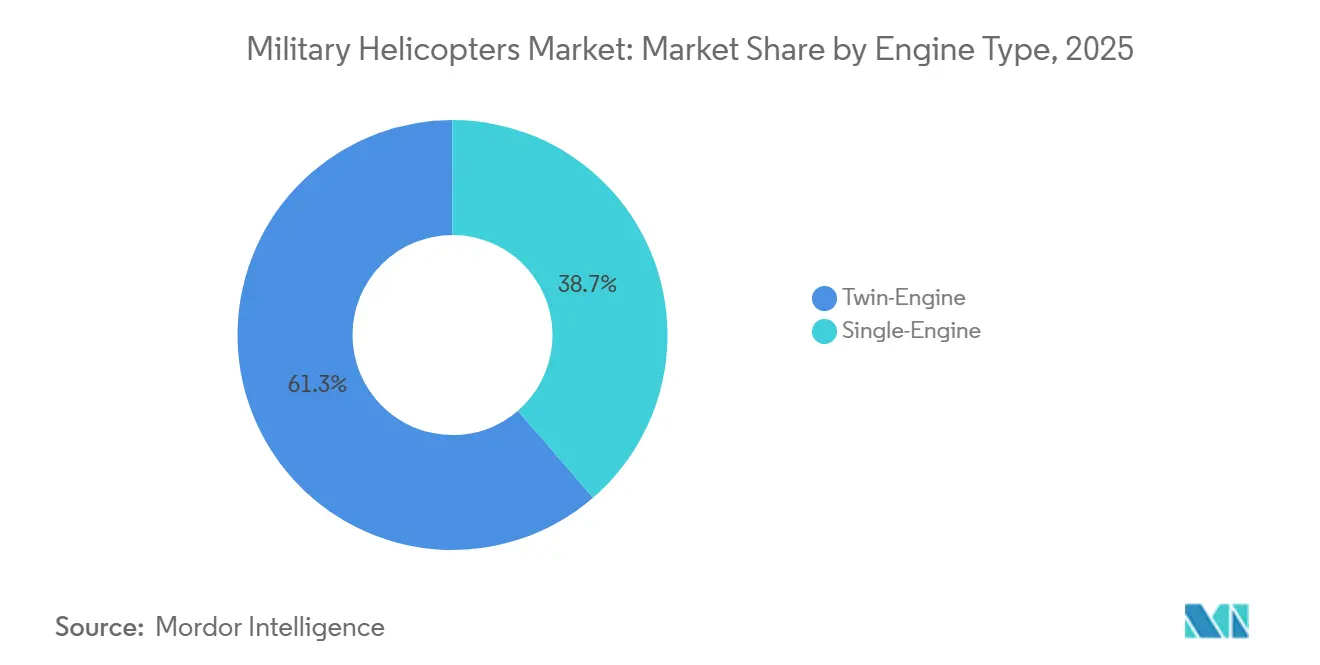
- By engine type, twin-engine platforms commanded 61.34% in 2025, while single-engine variants are projected to grow at a 3.12% CAGR to 2031.
- By application, combat and close air support accounted for 43.89% in 2025, while troop transport is advancing at a 4.76% CAGR to 2031.
- By geography, North America accounted for 45.23% in 2025, while Asia-Pacific is forecasted to expand at a 5.65% CAGR through 2031.
Note: Market size and forecast figures in this report are generated using Mordor Intelligence’s proprietary estimation framework, updated with the latest available data and insights as of 2026.
Global Military Helicopters Market Trends and Insights
Drivers Impact Analysis*
| Driver | (~) % Impact on CAGR Forecast | Geographic Relevance | Impact Timeline |
|---|---|---|---|
| Accelerated rotorcraft modernization programs | +0.8% | Global, concentrated in North America, Europe, Asia-Pacific | Medium term (2-4 years) |
| Shift toward multi-mission modular platforms | +0.5% | Global, particularly North America, Middle East, Asia-Pacific | Medium term (2-4 years) |
| Future Vertical Lift (FVL) and similar next-gen initiatives | +0.4% | North America, with secondary influence in allied nations | Long term (≥ 4 years) |
| Rapid adoption of manned-unmanned teaming (MUM-T) concepts | +0.3% | North America, Europe, Asia-Pacific, Middle East | Medium term (2-4 years) |
| Fleet-wide demand for predictive maintenance and health monitoring | +0.2% | Global, with early adoption in North America and Europe | Short term (≤ 2 years) |
| Push for hybrid-electric propulsion to cut logistic fuel burden | +0.1% | North America, Europe, with pilot programs in Asia-Pacific | Long term (≥ 4 years) |
| Source: Mordor Intelligence | |||
Accelerated Rotorcraft Modernization Programs Drive Immediate Procurements
Rotorcraft operators shifted to integrated modernization, adopting open architectures, mission computers, and cyber-hardened data buses to streamline the effective deployment of capabilities. The US Army’s foundational Black Hawk modernization effort in August 2025 demonstrates how model-based systems engineering and digital backbones are accelerating iterative avionics changes in line with MOSA principles.[1] Lockheed Martin News Team, “Lockheed Martin Sikorsky Awarded New Army Contract for Black Hawk Modernization Efforts,” Lockheed Martin, lockheedmartin.com The MOSA approach is reinforced by modular avionics programs such as Collins Aerospace Mosarc, which provides the architecture for scalable sensors, data links, and health monitoring, thereby shortening integration cycles. Special operations recapitalization is also moving forward, as reflected in the five MH-47G Block II aircraft ordered in 2025, which sustain heavy-lift, precision infiltration, and exfiltration capacity with upgraded digital systems. Collectively, these actions signal that the military helicopters market favors upgradeable baselines with room for software-defined capabilities that align with rapid software release cycles.
Shift Toward Multi-Mission Modular Platforms
Defense planners favor multi-mission helicopters for their adaptability through reconfigurable interiors and mission kits, optimizing operational efficiency while minimizing impacts on training pipelines and spare parts management. European procurement demonstrates this pattern, with Germany adding 20 H145M helicopters to expand flexible light-attack and support roles that benefit from common training and maintenance.[2]Airbus Press Office, “Germany Orders 20 Additional Airbus H145M Helicopters,” Airbus, airbus.com Multi-mission logic also supports long-range search-and-rescue and combat support, as seen in Morocco's order for 10 H225M helicopters configured for combat search-and-rescue missions. Modular open systems are essential for enabling MOSA-compatible avionics and facilitating the rapid integration of sensors, countermeasures, or datalinks across standardized airframes. This approach reduces sustainment complexity and enhances mission versatility, aligning with the military helicopters market's focus on common architectures to optimize fleet-wide operational efficiency and adaptability within a unified strategy.
Future Vertical Lift (FVL) Initiatives Redefine Long-Term Procurement Roadmaps
The Future Long-Range Assault Aircraft (FLRAA) advanced to Milestone B in August 2024, initiating engineering and manufacturing development aligned with a 2026 first flight and 2028 low-rate production path, shortening the time to field next-generation assault capability. The Modular Open Systems Approach (MOSA) in Future Vertical Lift (FVL) programs ensures upgradeability and repairability, mitigating the challenges of software and hardware lock-in. As the military helicopters market plans fleet operations through the 2050s, FVL-aligned digital architectures are driving avionics refresh cycles, optimizing sustainment for both current platforms and next-generation aircraft.
Rapid Adoption of Manned-Unmanned Teaming (MUM-T) Expands Mission Envelopes
A demonstration for the US Marine Corps integrated commercial autonomy software into existing helicopter platforms, enabling automated takeoff and landing, reducing cockpit workload, and validating the retrofit's operational feasibility for immediate mission requirements. Platform-agnostic teaming concepts are evolving as OEMs integrate fighters, helicopters, and remote carriers using compact airborne data links and onboard processing. These systems enhance operations by identifying threats, managing airborne assets, extending sensor range, distributing risk, and enabling logistics or target designation in contested environments, while ensuring crewed rotorcraft retain decision-making authority. As integration advances, the military helicopters market prioritizes reliable data links, robust autonomy and safety frameworks, and adaptable, modular avionics that support new teaming functionalities via software updates.
Restraints Impact Analysis*
| Restraint | (~) % Impact on CAGR Forecast | Geographic Relevance | Impact Timeline |
|---|---|---|---|
| High total lifecycle cost and stretched defense budgets | -0.6% | Global, most acute in Europe, South America, and smaller Asia-Pacific nations | Short term (≤ 2 years) |
| Stringent export-control and technology-transfer constraints | -0.4% | Global, with primary friction points in North America-to-Asia-Pacific and North America-to-Middle East transfers | Medium term (2-4 years) |
| Growing lethality of anti-access/area-denial (A2/AD) threats | -0.3% | Asia-Pacific, Middle East, with secondary concerns in Eastern Europe | Medium term (2-4 years) |
| Competition from armed UAVs for attack/ISR missions | -0.5% | Global, most pronounced in North America and Europe | Short term (≤ 2 years) |
| Source: Mordor Intelligence | |||
High Total Lifecycle Cost Constrains Fleet Expansion in Budget Stretched Environments
Lifecycle costs and sustainment funding reduce flexibility for new procurement when budgets are tight, which drives decisions to retire older airframes sooner or to consolidate fleets onto fewer types. Operators are also pursuing availability-based support that guarantees mission-ready hours. Still, these contracts require robust supply chains and stable build rates that smaller economies may find hard to underwrite. Program managers are therefore emphasizing modular upgrades that extend life and update survivability and connectivity without committing to all-new fleets in a compressed budget window. These trade-offs keep the military helicopters market balanced between the depth of modernization and fleet size, maintaining mission-capable rates while avoiding a sustainment bill that displaces near-term recapitalization.
Export Controls Create Procurement Delays Despite AUKUS Exemptions
The December 2025 AUKUS streamlining removed licensing for many intra-triad transactions, but the US export-control framework still imposes licensing and review for significant transfers outside the triad, which can slow foreign military sales (FMS) relative to competitors with fewer constraints.[3]Office of the Federal Register, “International Traffic in Arms Regulations, U.S. Munitions List Targeted Revisions,” Federal Register, federalregister.gov The Arms Export Control Act and interagency review processes add fixed review periods for large transactions, and most importing countries impose offsets that require local production, investment, or technology transfer, which heightens program-complexity risk. Prolonged lead times remain a challenge, favoring suppliers that offer government-to-government packages with streamlined approval workflows and simplified procurement processes to efficiently address partner requirements.
*Our forecasts treat driver/restraint impacts as directional, not additive. The impact forecasts reflect baseline growth, mix effects, and variable interactions.
Segment Analysis
By Helicopter Type: Multi-Mission Dominance Meets Transport Surge
Multi-mission helicopters accounted for 51.76% in 2025, and transport helicopters are projected to grow at a 5.73% CAGR through 2031, which frames the mix that operators are pursuing for strike flexibility and resilient logistics networks. Special operations agencies are extending heavy-lift multi-mission capacity through Block II upgrades to sustain infiltration and exfiltration profiles that rely on digital avionics and modern survivability suites.[4]Boeing Media Relations, “U.S. Army Special Operations Orders Five Boeing MH-47G Block II Chinooks,” Boeing, boeing.mediaroom.com This mix pulls technology improvements across the fleet, including MOSA-based avionics that support rapid integration of new data links or countermeasures without aircraft-specific rewrites. The military helicopters market is projected to benefit from OEM order momentum, driven by demand for multi-role capabilities among allied customers across Europe, the Middle East, and Asia-Pacific.
Transport helicopters are projected to grow rapidly, driven by the critical need for tactical resupply, casualty evacuation, and air assault capabilities in distributed operations and logistics under challenging operational conditions. Heavy-lift variants for special operations integrate mission-adaptive weapon stations and launched effects, retaining austere basing lift profiles. Multi-mission platforms support combat search and rescue, maritime operations, and anti-submarine warfare, optimizing shared training, spares management, and operational efficiency across diverse mission requirements.


By End-User Service: Army Aviation Anchors Demand, Air Force Accelerates
Army Aviation led with 42.83% in 2025, and Air Force procurements are projected to grow at a 4.24% CAGR as personnel recovery and special operations remain critical in contested settings that require rotorcraft-specific capability. Army programs emphasize modernized cockpits, digital backbones, and higher-power engines to extend useful life and provide pathways for incremental capability upgrades over the decade. The military helicopters market for Army applications is evolving toward integrating crewed platforms with uncrewed systems, requiring advanced avionics and data links for teaming. Special operations growth is supported by heavy-lift remanufactures and new builds, enhancing operational capacity for complex infiltration missions across extended ranges.
Increased Air Force investments focus on replacing aging airframes in rescue and special mission fleets with modular avionics, enhancing survivability and enabling operations in contested electromagnetic environments. This modularity supports incremental integration of navigation systems, countermeasures, and datalinks across services, reducing reliance on platform-specific upgrades. Naval and marine operators drive demand as maritime helicopters standardize globally, streamlining training and integrating anti-submarine warfare, surveillance, and rescue roles, highlighting joint-service commonality as a critical procurement factor in the military helicopters market, ensuring operational efficiency and interoperability across diverse mission requirements.
By Engine Type: Twin Engine Safety Margins Justify Premiums
Twin-engine helicopters commanded 61.34% in 2025, reflecting redundancy requirements for combat survivability and mission continuation after damage or failure, while single-engine types are projected to grow at a 3.12% CAGR in cost-sensitive roles such as training or light utility. The military helicopters market remains anchored by twin-engine types for attack, assault, and heavy-lift missions that demand safe single-engine flight in hot-and-high conditions.
Operators prioritize single-engine models for specific applications, benefiting from lower operational costs and streamlined maintenance. The military helicopters market sustains a stable single-engine niche for training and paramilitary missions. At the same time, regulatory restrictions limit their deployment over water or mountainous terrain to ensure compliance with safety standards and operational guidelines.
By Application: Combat Primacy Competes with Transport Logistics
Combat and close air support represented 43.89% in 2025, while troop transport is forecast to grow at a 4.76% CAGR as distributed operations and logistics-under-fire concepts push transport to the fore. Military helicopters play a critical role in close support missions, requiring human judgment for heavy ordnance, rapid repositioning, and complex engagement rules. Reconnaissance is increasingly handled by uncrewed platforms, providing data to crewed helicopters, while attack and escort roles emphasize survivability and precision. Enhanced digital connectivity and teaming concepts improve weapon cueing and extend visual range, ensuring combat helicopters remain effective in sensor-intensive operational environments.
Troop transport growth reflects a need for range, payload, and survivability in contested logistics, supported by avionics and powertrain upgrades that increase mission radius and reduce exposure time. Special operations variants integrate gun mounts and launched effects while preserving lift, merging transport and protection into a unified platform. Multi-mission maritime fleets transition from rescue to combat support, emphasizing platform standardization through shared training. This strategic shift sustains combat primacy in the military helicopters market while elevating transport logistics to an equivalent priority for supporting distributed forces effectively.
Geography Analysis
North America accounted for 45.23% of 2025 spending, and Asia-Pacific is projected to grow at a 5.65% CAGR through 2031 as security dynamics and industrial cooperation accelerate acquisition pipelines. In the US, Army avionics modernization on enduring platforms is integrated with the Future Long-Range Assault Aircraft program, which achieved Milestone B in 2024, targets its first flight by 2026, and plans production readiness by 2028 to enhance assault capabilities throughout the decade. North American operators are investing in modular avionics to expand mission kit capabilities, integrate uncrewed systems, and enable scalable health monitoring, ensuring reliable mission availability while advancing next-generation military helicopter programs toward deployment.
Europe holds a significant share as customers prioritize multi-mission capabilities with standardized fleet operations. Germany’s order for 20 additional H145M helicopters and broader European procurement underline demand for flexible light-attack and support roles that benefit from standardization. European operators adopt MOSA principles and digital avionics upgrades to sustain platform relevance and meet next-generation vertical-lift requirements, enhancing operational capabilities.
The Asia-Pacific region is projected to lead growth, as territorial disputes and recapitalization plans align with policies that support local manufacturing and technology transfer. India’s industrial collaborations are enhancing sovereign capabilities by enabling domestic helicopter production and establishing MRO infrastructure, ensuring long-term operational readiness and ecosystem development.

Competitive Landscape
The military helicopters market, dominated by major manufacturers, emphasizes open systems, digital backbones, and integration speed across heavy-lift, assault, maritime, and special-mission types, shifting focus from traditional flight performance metrics. Airbus Helicopters reported 544 gross orders in 2025 across 205 customers and a rising defense mix, showing scale and diversity across civil and military users in 50 countries. Sikorsky and partners continue to invest in foundational modernization for enduring fleets that support modular upgrades and mission-system integration aligned with MOSA. These shifts reward OEMs and suppliers that can deliver fielded upgrades and incremental improvements while next-generation programs move toward test and early production.
Emerging and regional players are leveraging sovereign production and partnerships to enter segments long dominated by established primes. India’s 2026 partnership between Adani Defence & Aerospace and Leonardo targets phased indigenization and domestic manufacturing for multiple types, reinforcing a supply base intended to support more than 1,000 airframes over the coming decade. Boeing's 2025 MH-47G order enhances its role in infiltration and exfiltration missions, with Block II upgrades ensuring operational relevance in contested logistics.
Consolidation and portfolio realignment continue as suppliers position for electrified architectures and higher levels of digital integration. Autonomous teaming demonstrations by Airbus and Shield AI demonstrate how software advancements can enhance existing fleets, complementing hardware roadmaps for new-build programs. This underscores the military helicopters market's focus on software release cadence, integration efficiency, and sustainment effectiveness, alongside traditional airframe performance metrics, to meet evolving operational requirements.
Military Helicopters Industry Leaders
Airbus SE
Lockheed Martin Corporation
Textron Inc.
The Boeing Company
Leonardo S.p.A.
- *Disclaimer: Major Players sorted in no particular order

Recent Industry Developments
- February 2026: Adani Defence & Aerospace signed an MoU with Leonardo to establish an integrated helicopter manufacturing ecosystem in India, addressing rising military requirements and advancing the nation’s self-reliance objectives in helicopter production through strategic collaboration.
- December 2025: Germany expanded its H145M light combat helicopter procurement by exercising an option to acquire 20 additional units under its existing agreement with Airbus.
- September 2025: Sikorsky, a subsidiary of Lockheed Martin Corporation, secured a USD 10.85 billion contract from the US Navy to manufacture up to 99 CH-53K King Stallion helicopters for the US Marine Corps over five years.


Global Military Helicopters Market Report Scope
Military helicopters are rotary-wing aircraft designed for defense and security missions across land and maritime domains. Equipped with mission-specific avionics, weapon systems, survivability features, and advanced propulsion systems, they support tactical, strategic, and humanitarian operations, including combat support, troop transport, reconnaissance, search and rescue, logistics, and disaster relief in diverse and contested environments.
The military helicopters market is segmented by helicopter type, end-user service, engine type, application, and geography. By helicopter type, the market is segmented into multi-mission, transport, and other helicopters. By end-user service, the market is segmented into air force, army aviation, naval/marine corps aviation, joint/special operations, and paramilitary and coast guard. By engine type, the market is segmented into single-engine and twin-engine helicopters. By application, the market is segmented into combat and close air support, troop transport, humanitarian and disaster relief, and pilot training. The report also covers the market sizes and forecasts for the military helicopters market in major countries across different regions. For each segment, the market size is provided in terms of value (USD).
By Helicopter Type
| Multi-mission Helicopter |
| Transport Helicopter |
| Other Helicopter |
By End-User Service
| Air Force |
| Army Aviation |
| Naval/Marine Corps Aviation |
| Joint/Special Operations |
| Paramilitary and Coast Guard |
By Engine Type
| Single-Engine |
| Twin-Engine |
By Application
| Combat and Close Air Support |
| Troop Transport |
| Humanitarian and Disaster Relief |
| Pilot Training |
By Geography
| North America | United States | |
| Canada | ||
| Mexico | ||
| Europe | United Kingdom | |
| France | ||
| Germany | ||
| Spain | ||
| Italy | ||
| Russia | ||
| Rest of Europe | ||
| Asia-Pacific | China | |
| India | ||
| Japan | ||
| South Korea | ||
| Indonesia | ||
| Australia | ||
| Rest of Asia-Pacific | ||
| South America | Brazil | |
| Rest of South America | ||
| Middle East and Africa | Middle East | Saudi Arabia |
| United Arab Emirates | ||
| Qatar | ||
| Rest of Middle East | ||
| Africa | South Africa | |
| Nigeria | ||
| Rest of Africa | ||
| By Helicopter Type | Multi-mission Helicopter | ||
| Transport Helicopter | |||
| Other Helicopter | |||
| By End-User Service | Air Force | ||
| Army Aviation | |||
| Naval/Marine Corps Aviation | |||
| Joint/Special Operations | |||
| Paramilitary and Coast Guard | |||
| By Engine Type | Single-Engine | ||
| Twin-Engine | |||
| By Application | Combat and Close Air Support | ||
| Troop Transport | |||
| Humanitarian and Disaster Relief | |||
| Pilot Training | |||
| By Geography | North America | United States | |
| Canada | |||
| Mexico | |||
| Europe | United Kingdom | ||
| France | |||
| Germany | |||
| Spain | |||
| Italy | |||
| Russia | |||
| Rest of Europe | |||
| Asia-Pacific | China | ||
| India | |||
| Japan | |||
| South Korea | |||
| Indonesia | |||
| Australia | |||
| Rest of Asia-Pacific | |||
| South America | Brazil | ||
| Rest of South America | |||
| Middle East and Africa | Middle East | Saudi Arabia | |
| United Arab Emirates | |||
| Qatar | |||
| Rest of Middle East | |||
| Africa | South Africa | ||
| Nigeria | |||
| Rest of Africa | |||


Market Definition
- Aircraft Type - All the military rotorcraft which are used for various applications are included in this study.
- Sub-Aircraft Type - For this study, all the military helicopters based on their application are considered.
- Body Type - Multi-Mission Helicopters, Transport Helicopters, Training Helicopters and various other rotorcraft are considered in this study.
| Keyword | Definition |
|---|---|
| IATA | IATA stands for the International Air Transport Association, a trade organization composed of airlines around the world that has an influence over the commercial aspects of flight. |
| ICAO | ICAO stands for International Civil Aviation Organization, a specialized agency of the United Nations that supports aviation and navigation around the globe. |
| Air Operator Certificate (AOC) | A certificate granted by a National Aviation Authority permitting the conduct of commercial flying activities. |
| Certificate Of Airworthiness (CoA) | A Certificate Of Airworthiness (CoA) is issued for an aircraft by the civil aviation authority in the state in which the aircraft is registered. |
| Gross Domestic Product (GDP) | Gross domestic product (GDP) is a monetary measure of the market value of all the final goods and services produced in a specific time period by countries. |
| RPK (Revenue Passenger Kilometres) | The RPK of an airline is the sum of the products obtained by multiplying the number of revenue passengers carried on each flight stage by the stage distance - it is the total number of kilometers traveled by all revenue passengers. |
| Load Factor | The load factor is a metric used in the airline industry that measures the percentage of available seating capacity that has been filled with passengers. |
| Original Equipment Manufacturer (OEM) | An original equipment manufacturer (OEM) traditionally is defined as a company whose goods are used as components in the products of another company, which then sells the finished item to users. |
| International Transportation Safety Association (ITSA) | International Transportation Safety Association (ITSA) is an international network of heads of independent safety investigation authorities (SIA). |
| Available Seats Kilometre (ASK) | This metric is calculated by multiplying Available Seats (AS) in one flight, defined above, multiplied by the distance flown. |
| Gross Weight | The fully-loaded weight of an aircraft, also known as “takeoff weight,” which includes the combined weight of passengers, cargo, and fuel. |
| Airworthiness | The ability of an aircraft, or other airborne equipment or system, to operate in flight and on the ground without significant hazard to aircrew, ground crew, passengers or to other third parties. |
| Airworthiness Standards | Detailed and comprehensive design and safety criteria applicable to the category of aeronautical product (aircraft, engine or propeller). |
| Fixed Base Operator (FBO) | A business or organization that operates at an airport. An FBO provides aircraft operating services like maintenance, fueling, flight training, charter services, hangaring, and parking. |
| High Net worth Individuals (HNWIs) | High Net worth Individuals (HNWIs) are individuals with over USD 1 million in liquid financial assets. |
| Ultra High Net worth Individuals (UHNWIs) | Ultra High Net worth Individuals (UHNWIs) are individuals with over USD 30 million in liquid financial assets. |
| Federal Aviation Administration (FAA) | The division of the Department of Transportation is concerned with aviation. It operates Air Traffic Control and regulates everything from aircraft manufacturing to pilot training to airport operations in the United States. |
| EASA (European Aviation Safety Agency) | The European Aviation Safety Agency is a European Union agency established in 2002 with the task of overseeing civil aviation safety and regulation. |
| Airborne Warning and Control System (AW&C) aircraft | Airborne Warning and Control System (AEW&C) aircraft is equipped with a powerful radar and on-board command and control center to direct the armed forces. |
| The North Atlantic Treaty Organization (NATO) | The North Atlantic Treaty Organization (NATO), also called the North Atlantic Alliance, is an intergovernmental military alliance between 30 member states – 28 European and two North American. |
| Joint Strike Fighter (JSF) | Joint Strike Fighter (JSF) is a development and acquisition program intended to replace a wide range of existing fighter, strike, and ground attack aircraft for the United States, the United Kingdom, Italy, Canada, Australia, the Netherlands, Denmark, Norway, and formerly Turkey. |
| Light Combat Aircraft (LCA) | A light combat aircraft (LCA) is a light, multirole jet/turboprop military aircraft, commonly derived from advanced trainer designs, designed for engaging in light combat. |
| Stockholm International Peace Research Institute (SIPRI) | Stockholm International Peace Research Institute (SIPRI) is an international institute that provides data, analysis, and recommendations for armed conflict, military expenditure, and arms trade as well as disarmament and arms control. |
| Maritime Patrol Aircraft (MPA) | A maritime patrol aircraft (MPA), also known as maritime reconnaissance aircraft is a fixed-wing aircraft designed to operate for long durations over water in maritime patrol roles, in particular, anti-submarine warfare (ASW), anti-ship warfare (AShW), and search and rescue (SAR). |
| Mach Number | The Mach number is defined as the ratio of true airspeed to the speed of sound at the altitude of a given aircraft. |
| Stealth Aircraft | Stealth is a Common term applied to low observable (LO) technology and doctrine, that makes an aircraft near invisible to radar, infrared or visual detection. |


Research Methodology
Mordor Intelligence follows a four-step methodology in all our reports.
- Step-1: Identify Key Variables: In order to build a robust forecasting methodology, the variables and factors identified in Step-1 are tested against available historical market numbers. Through an iterative process, the variables required for market forecast are set and the model is built on the basis of these variables.
- Step-2: Build a Market Model: Market-size estimations for the historical and forecast years have been provided in revenue and volume terms. For sales conversion to volume, the average selling price (ASP) is kept constant throughout the forecast period for each country, and inflation is not a part of the pricing.
- Step-3: Validate and Finalize: In this important step, all market numbers, variables and analyst calls are validated through an extensive network of primary research experts from the market studied. The respondents are selected across levels and functions to generate a holistic picture of the market studied.
- Step-4: Research Outputs: Syndicated Reports, Custom Consulting Assignments, Databases & Subscription Platforms


