AI In Insurance Market Size and Share
Market Overview
| Study Period | 2020 - 2031 |
|---|---|
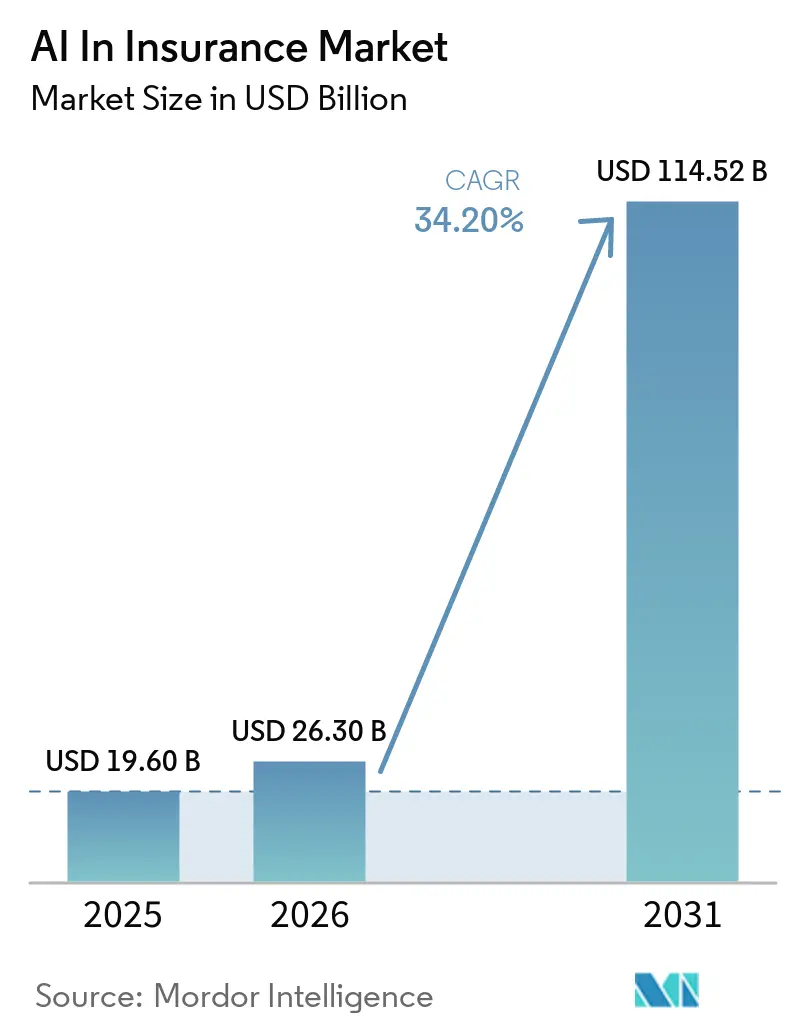
| Market Size (2026) | USD 26.30 Billion |
| Market Size (2031) | USD 114.52 Billion |
| Growth Rate (2026 - 2031) | 34.20% CAGR |
| Fastest Growing Market | Asia Pacific |
| Largest Market | North America |
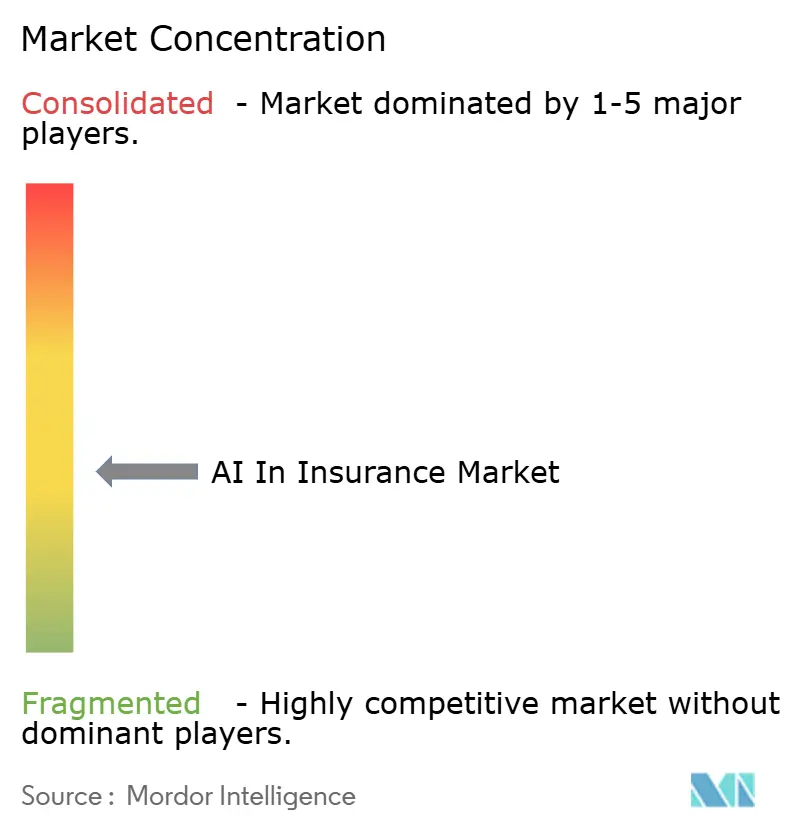
| Market Concentration | Medium |
Major Players *Disclaimer: Major Players sorted in no particular order Image © Mordor Intelligence. Reuse requires attribution under CC BY 4.0. | |
AI In Insurance Market Analysis by Mordor Intelligence
The AI in insurance market size is expected to grow from USD 19.60 billion in 2025 to USD 26.3 billion in 2026 and is forecast to reach USD 114.52 billion by 2031 at 34.20% CAGR over 2026-2031. Insurers are directing these investments toward cloud-native modernization that supports real-time pricing and instant claims decisions, while regulators push for straight-through processing to improve consumer outcomes. Generative AI allows carriers to mine unstructured data such as medical notes or property descriptions, creating highly personalized risk profiles that expand insurability and compress underwriting cycles. Computer-vision platforms cut property inspection time by up to 75%, and embedded insurance models let retailers bundle usage-based coverage into check-out flows, lowering customer acquisition costs and opening new distribution channels. Competitive tension among traditional carriers, insurtechs, and technology vendors is accelerating capital allocation toward scalable AI ecosystems rather than point solutions.
Key Report Takeaways
- By offering, software held 48.10% of AI in insurance market share in 2025, while services are on track for a 35.80% CAGR through 2031.
- By deployment mode, cloud solutions captured 61.10% revenue share in 2025; the same segment is projected to grow at a 33.90% CAGR to 2031.
- By enterprise size, large insurers commanded 70.85% share of AI in insurance market size in 2025, but small and medium insurers will expand at a 38.90% CAGR between 2026-2031.
- By end-user, property and casualty lines accounted for 58.05% of 2025 revenue, while life and health lines are advancing at a 33.60% CAGR to 2031.
- By technology, Machine learning owned 60.70% of 2025 revenue, while computer vision is forecast to post a 36.90% CAGR.
- By geography, North America led with 43.95% share in 2025, whereas Asia-Pacific is forecast to post a 30.80% CAGR through 2031.
Note: Market size and forecast figures in this report are generated using Mordor Intelligence’s proprietary estimation framework, updated with the latest available data and insights as of 2026.
Global AI In Insurance Market Trends and Insights
Drivers Impact Analysis*
| Driver | (~) % Impact on CAGR Forecast | Geographic Relevance | Impact Timeline |
|---|---|---|---|
| Cloud-first core-system modernisation | +8.2% | Global, with early adoption in North America and Europe | Medium term (2-4 years) |
| Rapid growth of embedded/usage-based insurance | +7.8% | Global, strongest in Asia-Pacific and North America | Short term (≤ 2 years) |
| Regulatory push for straight-through digital claims | +6.5% | North America and Europe, expanding to Asia-Pacific | Medium term (2-4 years) |
| Gen-AI powered ultra-personalised underwriting | +5.9% | Global, led by developed markets | Long term (≥ 4 years) |
| Computer-vision based property risk scoring from aerial imagery | +4.1% | North America, Europe, Australia | Medium term (2-4 years) |
| AI-driven fraud detection and prevention | +3.1% | Global, with focus on high-fraud regions | Short term (≤ 2 years) |
| Source: Mordor Intelligence | |||
Cloud-first Core-System Modernization
Legacy mainframes cannot support the throughput required for real-time rating and claims automation. Moving policy, billing, and claims workloads to cloud platforms cuts computing costs by up to 40% and shortens model deployment cycles from months to weeks. Microservices architectures expose open APIs, making it easier to plug in third-party analytics, large language models, or computer-vision components without heavy re-platforming. Carriers that modernize core systems also gain elastic scalability for peak events such as natural catastrophes, ensuring uninterrupted service during claims surges. Cloud vendors protect sensitive policyholder data with enterprise-grade encryption that satisfies evolving data-sovereignty rules, easing compliance audits. These benefits collectively raise operational agility and free capital for product innovation in the AI in insurance market.
Embedded and Usage-Based Insurance Growth
AI allows insurers to calculate risk scores at the point of sale, embedding coverage inside mobility, retail, and travel apps where customers already transact. Real-time data streams from telematics or payment gateways enable usage-based pricing that matches actual exposure, reducing loss ratios and improving customer retention. Distributors benefit from new recurring-revenue pools without heavy regulatory overhead, while insurers enjoy acquisition-cost reductions of up to 60%. The model resonates with digitally native consumers who expect seamless checkout and are willing to share behavioral data in exchange for fairer premiums. Continued API standardization is broadening embedded adoption beyond auto and flight delay policies into pet, cyber, and event insurance, expanding the addressable AI in insurance market.
Regulatory Push for Straight-Through Digital Claims
Twenty-four US states have adopted National Association of Insurance Commissioners (NAIC) model guidance that encourages algorithmic transparency while mandating timely settlements [1]National Association of Insurance Commissioners, “Model Bulletin on the Use of AI Systems by Insurers,” naic.org. California’s Physicians Make Decisions Act went live in January 2025, requiring human oversight before a health claim denial yet allowing AI to speed initial adjudication. The EU AI Act, effective February 2025, classifies insurance algorithms by risk tier and requires joint accountability among carriers and vendors. These frameworks advantage carriers that already operate explainable AI pipelines and can provide plain-language rationales to regulators and customers. Lagging insurers may face remediation costs or fines, further widening the competitive gap in the market.
Generative-AI-Powered Personalized Underwriting
Large language models read medical histories, property appraisals, and financial disclosures, distilling thousands of data points into granular risk vectors in seconds. Cycle times that once stretched weeks now compress to minutes, expanding bind rates in complex commercial lines. IBM’s watsonx platform powers Star Union Dai-ichi Life’s dashboards that automatically draft policy conditions tailored to each applicant’s lifestyle and health record. Continuous learning lets policies adapt mid-term when risk factors change, such as installing smart-home sensors or improving driving behavior. Personalized underwriting improves customer satisfaction and reduces anti-selection, boosting combined ratios across the market.
Restraints Impact Analysis*
| Restraint | (~) % Impact on CAGR Forecast | Geographic Relevance | Impact Timeline |
|---|---|---|---|
| Data-privacy and model-explainability compliance burden | -4.8% | Global, strictest in Europe and California | Long term (≥ 4 years) |
| Legacy‐system integration costs | -3.9% | Global, highest impact in established markets | Medium term (2-4 years) |
| Restrictive model-risk-management frameworks | -2.7% | North America and Europe, expanding globally | Medium term (2-4 years) |
| Talent shortage and AI skills gap | -2.1% | Global, most acute in developed markets | Long term (≥ 4 years) |
| Source: Mordor Intelligence | |||
Data-Privacy and Model-Explainability Compliance Burden
The EU AI Act obliges insurers to document algorithms, maintain audit logs, and produce customer-friendly explanations on demand[2]European Insurance and Occupational Pensions Authority, “Guidelines on Governance of AI Applications in Insurance,” eiopa.europa.eu. Similar transparency rules apply in California, where regulators can require evidence that automated systems do not deny care purely for cost reasons. Building these controls can raise initial AI program costs by 25-30% and prolong deployment timelines. Multinational carriers must also navigate inconsistent data-localization laws, adding complexity to global rollouts. Non-compliance risks include administrative fines, forced model withdrawals, and reputational damage that slows investment in the AI in insurance market.
Legacy-System Integration Costs
Many carriers still rely on monolithic policy-administration mainframes with limited API exposure. Integrating modern analytics often requires costly middleware or full core replacement, budgets that can exceed USD 50 million for Tier-1 insurers. Data cleansing is another hurdle because inconsistent formats undermine model accuracy and inflate project timelines. Hybrid architectures that mix legacy and cloud stacks raise overhead and dilute the speed gains sought from AI, delaying value realization across the AI in insurance market.
*Our forecasts treat driver/restraint impacts as directional, not additive. The impact forecasts reflect baseline growth, mix effects, and variable interactions.
Segment Analysis
By Offering: Platform Consolidation Fuels Software Leadership
Software accounted for 48.10% of AI in insurance market share in 2025 as carriers favored end-to-end suites that blend pricing, fraud, and customer-service modules in one stack. Vendors bundle model orchestration, monitoring, and governance features so clients avoid stitching together point tools. The services segment is set for a 35.80% CAGR to 2031 because insurers need advisory, integration, and change-management expertise in regulated environments. Consulting partners validate models against fairness and bias benchmarks, steer process redesign, and train underwriters to interpret AI outputs. Capital-light software-as-a-service contracts align spending with usage, lowering barrier-to-entry for regional carriers and further expanding the market.
In value terms, services now supply workflow accelerators that improve return on existing licenses, making retention high and churn low. Insurers request joint business-outcome guarantees, pushing providers to couple technology with measurable loss-ratio or expense improvements. A growing share of deals also includes managed model-risk-management components so carriers meet audit demands without building large internal ML-ops teams. The model reveals why the AI in insurance market size linked to services is projected to outpace product revenue despite software’s current lead.


By Deployment Mode: Cloud Adoption Reshapes Infrastructure Economics
Cloud deployments captured 61.10% of 2025 revenue as insurers shifted compute-intensive workloads to hyperscale platforms that offer on-demand GPUs and robust data-protection certifications. This slice of AI in insurance market size is expected to rise at a 33.90% CAGR through 2031. Carriers benefit from pay-as-they-go costing, faster experimentation, and geographic redundancy for disaster recovery. Multi-cloud strategies avoid lock-in and allow best-of-breed AI service selection, as seen in Zurich’s split between Azure for analytics and AWS for customer-facing chatbots..
On-premises deployments persist in jurisdictions with strict data-sovereignty mandates. Hybrid architectures knit on-prem cores with cloud analytics layers that call anonymized datasets when full migration is not yet feasible. Edge computing extends cloud advantages to connected-car and smart-home scenarios where latency matters. These different patterns confirm that flexibility, not binary choices, will shape deployment decisions across the AI in insurance market.
By Enterprise Size: SMEs Gain Ground Through Accessible AI
Large carriers held 70.85% of 2025 revenue, reflecting capital strength and scale needed for complex transformations. Still, the small- and medium-enterprise slice of AI in insurance market share is expanding at a 38.90% CAGR because cloud-native solutions no longer require heavy upfront outlays. No-code model builders and pre-trained APIs let regional mutuals launch AI-driven products without dedicated data-science teams. Turnkey risk-scoring engines, for instance, help specialty marine or pet insurers quote in minutes and compete for niche growth.
Partnerships between technology firms and smaller carriers emphasize managed services where the vendor runs infrastructure, compliance, and continuous retraining. This arrangement frees underwriting staff to focus on relationship building rather than code maintenance. New entrants also leverage white-label embedded programs to reach consumers without large marketing budgets, intensifying competition and broadening the overall AI in insurance market size.
By End-User: Property Lines Lead as Life and Health Accelerate
Property and casualty insurers produced 58.05% of 2025 revenue because visual damage estimates, fraud detection, and catastrophe modeling lend themselves to AI. Computer-vision platforms integrate with aerial imagery databases so adjusters can settle roof claims in hours instead of days. Risk-prevention sensors in commercial properties stream data that instantly updates exposure scores and recommends mitigation steps. These capabilities underscore why P&C remains the largest slice of the AI in insurance market.
Life and health carriers are closing the gap with a 33.60% CAGR projection as generative AI interprets electronic health records and wearable-device feeds. Ping An’s Good Doctor service connects medical advice, wellness recommendations, and policy adjustments in one app, demonstrating converging healthcare and insurance value chains. Personalized wellness nudges lower morbidity and improve portfolio profitability, reinforcing investment momentum in this segment of the AI in insurance market.

By Technology: Machine Learning Dominates but Computer Vision Surges
Machine learning owned 60.70% of 2025 revenue as its classification and regression models underpin pricing, reserving, and claims-triage tasks. Governance tooling around feature inspection and model explainability is mature, making regulators more comfortable approving production use. However, computer vision is forecast to post a 36.90% CAGR because high-resolution imagery analysis removes expensive field inspections and speeds settlements. Cape Analytics, for example, evaluates roof geometry and vegetation proximity to assign fire scores across millions of properties in minutes.
Natural language processing rounds out the technology mix by parsing inbound documents and powering chat assistants that solve customer queries in real time. Allianz reports almost 400 generative-AI use cases live, ranging from multilingual policy summarization to contract clause extraction, signaling how carriers string together multiple techniques for full-process automation . This convergence broadens the AI in insurance market and lifts the addressable spend for integrated platform providers.
Geography Analysis
North America led the AI in insurance market with a 43.95% revenue share in 2025 as venture funding, established insurtech clusters, and regulatory clarity accelerated experimentation. NAIC guidelines and state-level acts balance innovation with consumer protections, encouraging carriers to scale explainable algorithms. M&A remains active, with Travelers acquiring Corvus Insurance for USD 435 million to enhance cyber analytics capabilities that feed its underwriting engine. The region’s scalable frameworks often serve as templates for overseas regulators, amplifying its influence on global product design and model-risk rules.
Asia-Pacific follows a different growth trajectory, posting the highest regional CAGR at 30.80% through 2031. China anchors regional innovation, exemplified by Ping An’s 47.8% net-profit rise in 2024 after embedding AI in underwriting, claims, and telemedicine modules. ZhongAn Online monetizes its in-house platforms abroad, booking USD 115 million in technology export revenue in 2024. Mobile-first consumers and relatively low legacy-system inertia enable insurers to leapfrog straight into cloud-native architectures, expanding the AI in insurance market size across emerging economies.
Europe maintains steady expansion underpinned by the EU AI Act, which supplies a single regulatory playbook across member states. Generali’s research partnership with MIT accelerates ethical model development while cultivating skills pipelines critical to future deployments. Carriers combine open banking and open-insurance APIs to personalize cover and embed ESG metrics into risk models, aligning with regional sustainability goals. This compliance-first posture appeals to multinational corporates that prize rigorous governance, allowing European insurers to export risk-management expertise even as they grow the AI in insurance market domestically.


Competitive Landscape
The AI in insurance market displays moderate fragmentation, with global technology firms, core-system specialists, and data-native insurtechs vying for wallet share. IBM, Microsoft, and SAP package analytics, cloud hosting, and governance modules, enabling carriers to procure full stacks from a single vendor. Niche specialists such as Guidewire and Applied Systems integrate predictive engines directly inside policy-administration suites, shortening deployment cycles for mid-sized carriers. Traditional insurers staff internal data-science centers but still partner with vendors to accelerate proofs of concept, making coopetition common.
Acquisitions are the quickest path to capability fill-in. CCC Intelligent Solutions purchased EvolutionIQ for USD 730 million to add AI-based injury claims guidance, while Applied Systems snapped up Planck to enrich its commercial-lines data lake. Intellectual-property portfolios also grow rapidly; Ping An has filed more than 55,000 AI-related patents, signaling the strategic value of proprietary algorithms. Market participants that can prove tangible loss-ratio improvements or expense savings win budget prioritization, tightening competitive pressure on slower adopters.
White-space opportunities persist in cyber, parametric, and embedded-micro coverage where actuarial history is limited and AI offers a fresh modeling canvas. Lemonade’s USD 1 billion premium milestone on an AI-native stack shows that digitally born carriers can reach scale without traditional branch networks. As success stories accumulate, investors remain bullish, channeling capital into startups tackling underwriting gaps, customer-experience pain points, and compliance automation. These dynamics continue to reshape the contours of the AI in insurance market.
AI In Insurance Industry Leaders
IBM Corporation
Microsoft Corporation
SAP SE
Guidewire Software, Inc.
SAS Institute Inc.
- *Disclaimer: Major Players sorted in no particular order

Recent Industry Developments
- June 2025: Crabi raised USD 13.6 million in a round led by Kaszek and IGNIA to accelerate AI-driven auto underwriting.
- May 2025: Earnix acquired Zelros to augment AI-powered personalization tools for insurers.
- April 2025: Lemonade surpassed USD 1 billion in premiums and introduced Lemonade Car, extending its AI-centric portfolio.
- February 2025: Waterdrop partnered with DeepSeek to embed AI-powered experts in digital insurance services.


Research Methodology Framework and Report Scope
Market Definitions and Key Coverage
Our study frames the AI in insurance market as all spending by insurers on software, hardware, and managed services that embed machine learning, natural language, computer vision, or related AI techniques to automate or augment underwriting, pricing, claims, fraud control, distribution, and policy servicing. Values are tracked in USD and cover revenues generated worldwide across life, health, and property and casualty lines.
(Scope exclusion) Pure analytics services sold to reinsurers and generic AI platforms used outside core insurance workflows sit outside this boundary.
Segmentation Overview
- By Offering
- Hardware
- Software
- Services
- By Deployment Mode
- Cloud
- On-Premises
- By Enterprise Size
- SMEs
- Large Enterprises
- By End-User
- Life and Health Insurance
- Property and Casualty Insurance
- By Technology
- Machine Learning
- Natural Language Processing
- Computer Vision
- By Geography
- North America
- United States
- Canada
- Mexico
- South America
- Brazil
- Argentina
- Rest of South America
- Europe
- Germany
- United Kingdom
- France
- Italy
- Spain
- Russia
- Rest of Europe
- Asia-Pacific
- China
- Japan
- India
- South Korea
- Australia and New Zealand
- Rest of Asia-Pacific
- Middle East and Africa
- Middle East
- Saudi Arabia
- United Arab Emirates
- Turkey
- Rest of Middle East
- Africa
- South Africa
- Nigeria
- Egypt
- Rest of Africa
- Middle East
- North America
Detailed Research Methodology and Data Validation
Primary Research
Mordor analysts interviewed underwriters, insurtech product heads, regional regulators, and systems integrators across North America, Europe, and Asia Pacific. Insights on average project budgets, deployment hurdles, and pricing shifts filled data gaps and validated secondary assumptions.
Desk Research
We began with public datasets from bodies such as the NAIC, EIOPA, the OECD, and national supervisors, which reveal insurer IT outlays and premium pools. Trade associations like the Geneva Association and senior actuarial journals provided loss ratio and claims frequency trends, while patent filings gathered via Questel helped us trace emerging AI techniques. Our team also drew on company 10-Ks, investor decks, and curated news feeds on Dow Jones Factiva to benchmark vendor revenue splits. These sources let us build a first pass on market size and spot major regional patterns. The sources noted are illustrative; many additional publications informed specific checks and clarifications.
Market-Sizing & Forecasting
A top down model converts global and regional insurer IT budgets into an AI addressable spend pool, applying penetration rates derived from our interviews. Supplier roll ups and sampled average selling price × volume checks give a selective bottom up view that reconciles with the top layer before finalization. Key drivers in the forecast include premium growth, claim cycle digitization rates, cloud adoption levels, regulator AI guidance timelines, and average fraud losses avoided. A multivariate regression and scenario analysis blend projects outcomes through 2030, with base, optimistic, and stress cases reviewed with domain experts.
Data Validation & Update Cycle
Outputs undergo variance checks against external KPIs such as AI related capex disclosures and insurtech funding flows; anomalies trigger analyst rework before sign off. Reports refresh annually, and material events large M&A, new regulations, major vendor exits trigger interim updates.
Why Mordor's AI In Insurance Baseline Is Dependable
Published estimates diverge because firms differ on what counts as AI spend, which product bundles are tallied, and how quickly adoption accelerates.
Key gap drivers include narrower scopes that omit services revenue, single source supplier surveys, or flat ASP assumptions that ignore regional cost spreads. By contrast, Mordor's model blends regulator data with live spend benchmarks and revisits drivers each year, giving decision makers a stable yet current baseline.
Benchmark comparison
| Market Size | Anonymized source | Primary gap driver |
|---|---|---|
| USD 19.60 B (2025) | Mordor Intelligence | - |
| USD 6.44 B (2024) | Global Consultancy A | Excludes hardware and managed services; relies on vendor survey counts only |
| USD 5.29 B (2024) | Trade Journal B | Counts software alone and uses flat global ASP |
| USD 6.11 B (2023) | Regional Consultancy C | Builds forecasts from 15 public insurers, missing APAC insurtech spend |
In summary, while other publishers offer useful snapshots, their narrower scopes and lighter validation create naturally smaller totals. Mordor's disciplined variable selection, yearly refresh, and cross method checks deliver a balanced baseline that stakeholders can trace, question, and confidently use.


Key Questions Answered in the Report
What is the current value of the AI in insurance market?
The market generated USD 26.3 billion in 2026 according to Mordor Intelligence.
How fast is the AI in insurance market expected to grow?
It is forecast to expand at a 34.20% CAGR, reaching USD 114.52 billion by 2031.
Which region leads in AI adoption within insurance?
North America holds 43.95% of 2025 revenue, driven by supportive regulation and strong insurtech ecosystems.
Why are services growing faster than software in this market?
Insurers require consulting, integration, and governance expertise to implement AI within complex regulatory environments, supporting a 35.80% CAGR for services.
Page last updated on:


