AI In Medical Billing Market Size and Share
Market Overview
| Study Period | 2020 - 2031 |
|---|---|
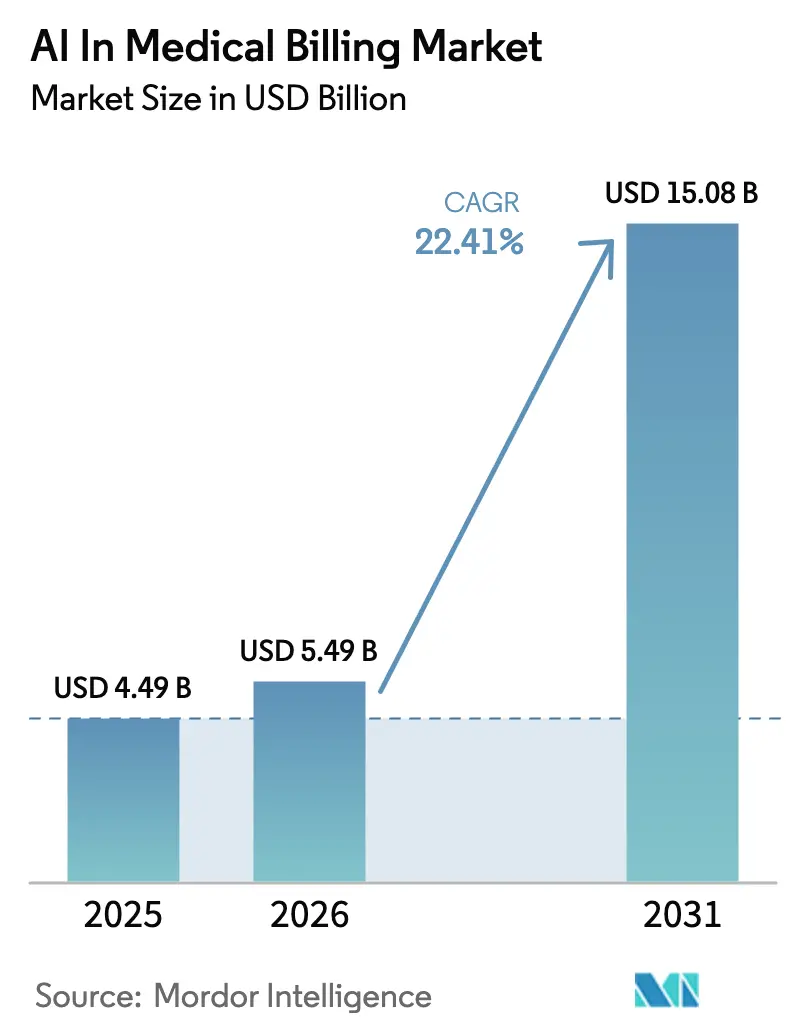
| Market Size (2026) | USD 5.49 Billion |
| Market Size (2031) | USD 15.08 Billion |
| Growth Rate (2026 - 2031) | 22.41% CAGR |
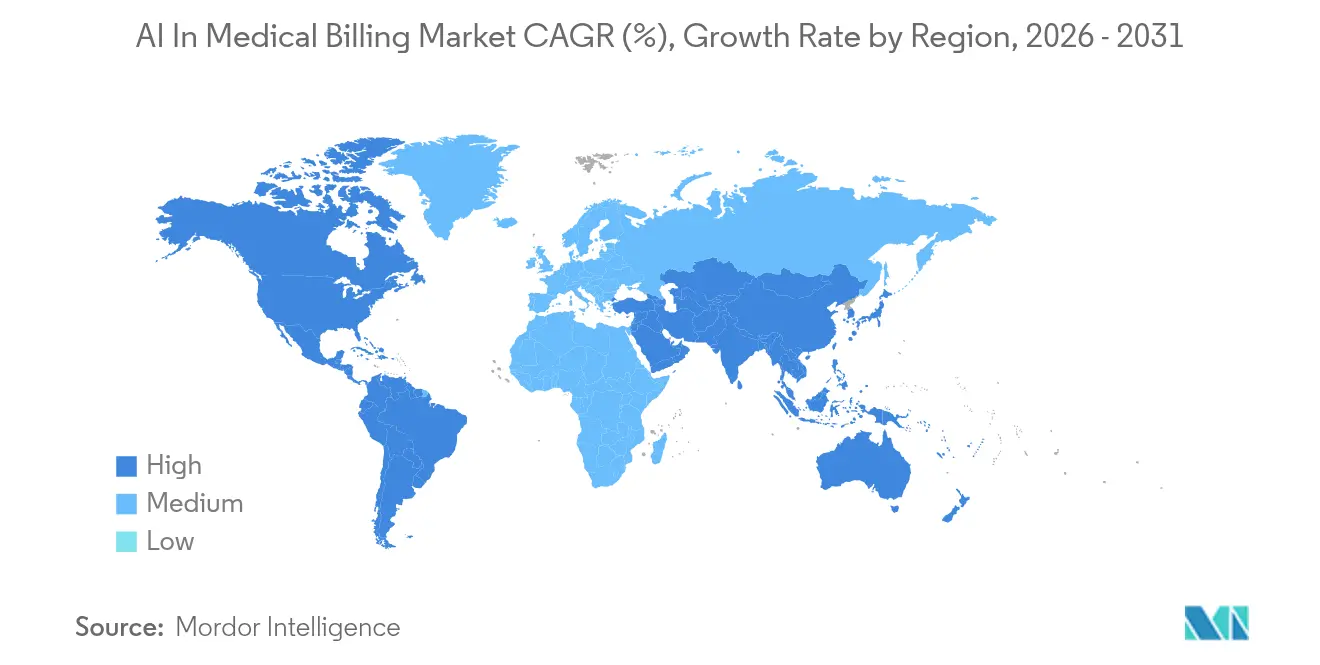
| Fastest Growing Market | Asia Pacific |
| Largest Market | North America |
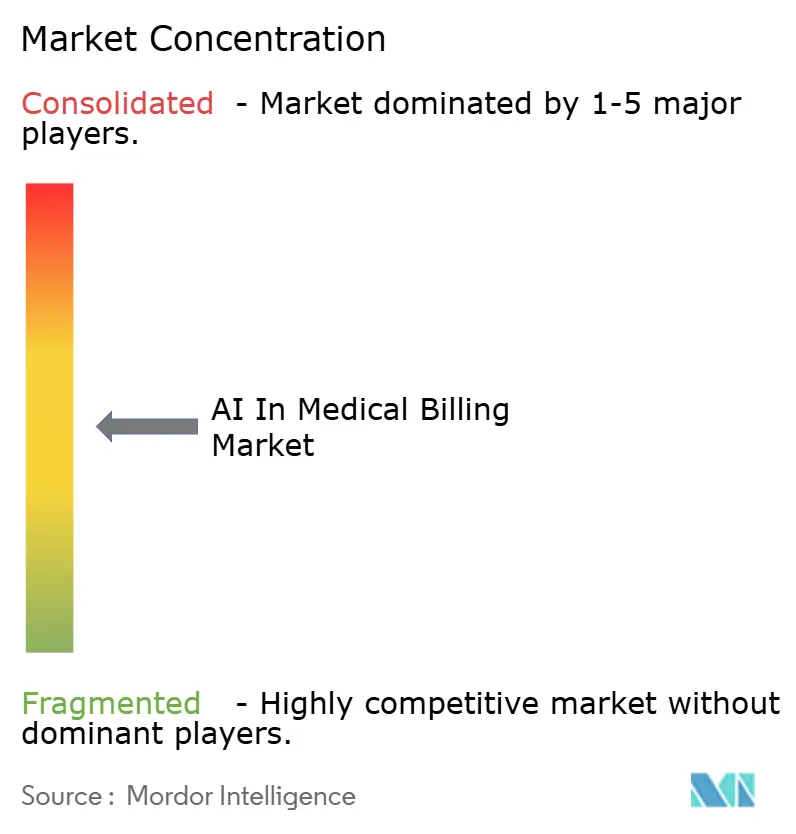
| Market Concentration | Medium |
Major Players *Disclaimer: Major Players sorted in no particular order Image © Mordor Intelligence. Reuse requires attribution under CC BY 4.0. | |
AI In Medical Billing Market Analysis by Mordor Intelligence
The AI In Medical Billing Market size is expected to grow from USD 4.49 billion in 2025 to USD 5.49 billion in 2026 and is forecast to reach USD 15.08 billion by 2031 at 22.41% CAGR over 2026-2031. The shift toward intelligent automation is reshaping financial operations as providers seek to stem USD 262 billion in initially denied claims each year. Hospitals accelerate deployment to address acute coder shortages, while payers deploy predictive analytics to curtail denial growth. Cloud migration dominates because subscription models lower capital outlays and simplify EHR integration. Consolidation among large vendors continues, illustrated by multibillion-dollar acquisitions that bundle clinical, financial, and analytics capabilities into unified platforms.
Key Report Takeaways
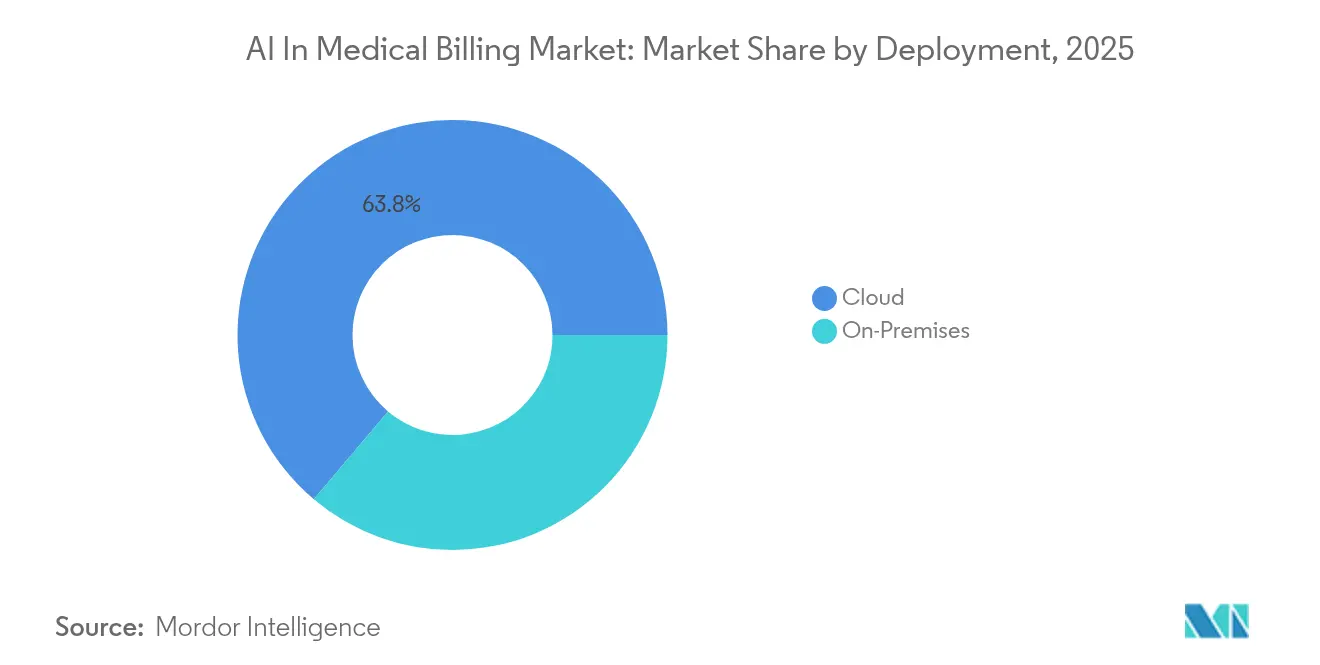
- By deployment, cloud models captured 63.84% of AI In Medical Billing Market share in 2025, and the segment is projected to compound at 24.71% through 2031.
- By application, claims processing and adjudication held 38.12% of AI In Medical Billing Market size in 2025, while fraud detection is forecast to expand at a 27.03% CAGR through 2031.
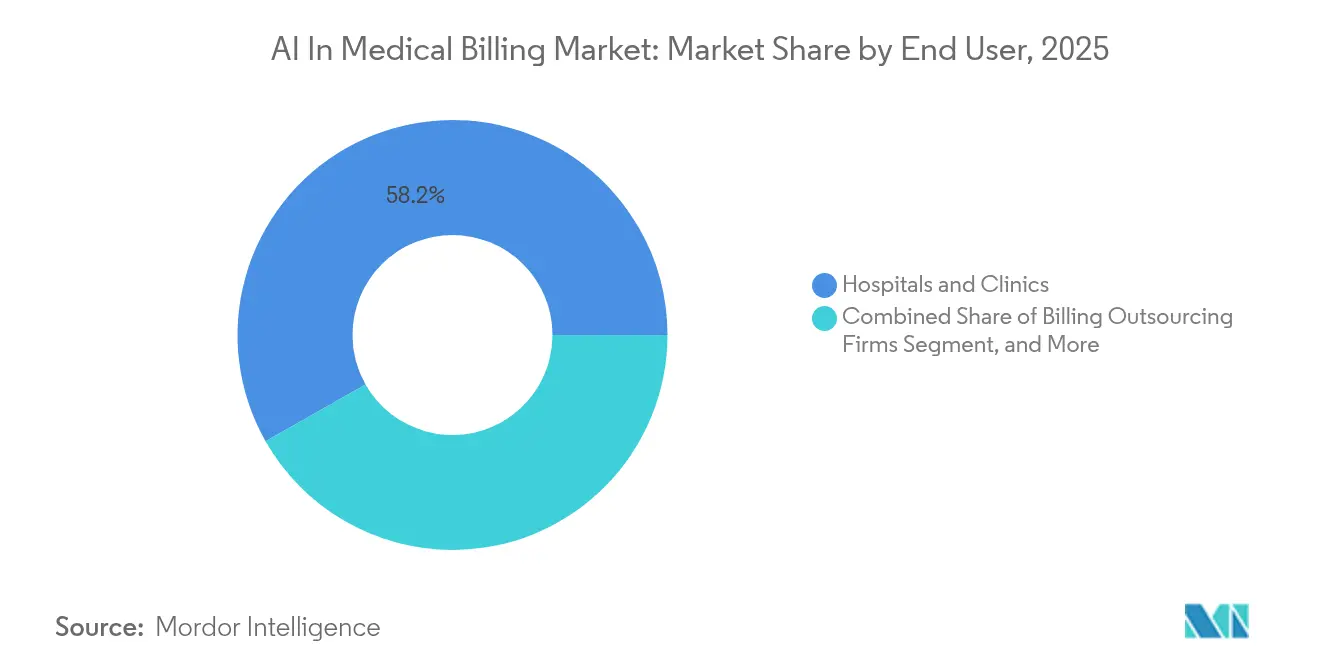
- By end user, hospitals and clinics commanded 58.22% of AI In Medical Billing Market size in 2025; billing outsourcing firms are projected to register the fastest 28.41% CAGR to 2031.
- By business model, stand-alone platforms led with 54.40% of AI In Medical Billing Market share in 2025, whereas integrated EHR/RCM suites are expected to rise at 24.39% CAGR through 2031.
- By geography, North America dominated with 46.10% revenue share in 2025, while Asia Pacific is poised to log a 26.64% CAGR to 2031.
Note: Market size and forecast figures in this report are generated using Mordor Intelligence’s proprietary estimation framework, updated with the latest available data and insights as of 2026.
Global AI In Medical Billing Market Trends and Insights
Drivers Impact Analysis*
| Driver | (~) % Impact on CAGR Forecast | Geographic Relevance | Impact Timeline |
|---|---|---|---|
| Growing RCM automation mandates by hospital CFO | +4.2% | Global, strongest in North America | Medium term (2-4 years) |
| Integration of AI with cloud-based EHR ecosystem | +3.8% | North America and Europe, expanding to Asia-Pacific | Long term (≥ 4 years) |
| Escalating claim-denial rates driving predictive analytics | +5.1% | Global, acute in US market | Short term (≤ 2 years) |
| Staffing shortages in medical coding pushing automation | +4.7% | Global, critical in developed markets | Medium term (2-4 years) |
| Generative-AI coder copilots cutting onboarding time | +2.9% | North America and Europe | Long term (≥ 4 years) |
| Real-time benefits-verification APIs reshaping workflows | +2.4% | North America, emerging in Asia-Pacific | Medium term (2-4 years) |
| Source: Mordor Intelligence | |||
Escalating Claim-Denial Rates Driving Predictive Analytics
Denied claims surpassed 450 million in 2024, nudging denial rates from 10.2% to 11% and generating a USD 19.7 billion burden for hospitals to overturn rejections.[1]Robert King, “Claim Denials Climb to 11%,” Healthcare Dive, healthcaredive.com Predictive engines now assess denial probability with 85% accuracy and enable 30%-plus reductions in rejections, boosting revenue by 20% for early adopters. New tools also auto-generate payer-specific appeal letters in minutes, trimming manual processing costs linked to the USD 20 billion annual denial-management workload. These efficiencies strengthen the AI in Healthcare Revenue Cycle Management market as success stories proliferate.
Staffing Shortages in Medical Coding Pushing Automation
Nine of ten health systems report coder shortages that extend billing cycles and risk non-compliance. Autonomous coding platforms now deliver 61–70% time savings while sustaining 99% clean-claim rates and full audit compliance.[2]Samantha Johnson, “Generative AI Boosts Coding Accuracy,” AKASA, akasa.com Proprietary transformer models interpret complex documentation and outperform human benchmarks in routine cases, and generative assistants trained on local data outperform generic models by 40%.[3]Katherine Davis, “Denied Claims Remain a USD 262 Billion Problem,” Medical Economics, medicaleconomics.comThe persistent labor gap ensures steady demand for these solutions in the AI in Healthcare Revenue Cycle Management market.
Integration of AI with Cloud-Based EHR Ecosystem
Healthcare organizations increasingly prioritize EHR integration capabilities as 96% of specialists seek AI and machine learning technologies for diagnostics and predictive analytics within their existing workflows. Cloud-based deployment models facilitate seamless AI integration with major EHR platforms, enabling real-time coding suggestions, automated prior authorization processing, and intelligent claims management without disrupting established clinical workflows.
Growing RCM Automation Mandates by Hospital CFO
Hospital chief financial officers mandate RCM automation initiatives as 74% currently implement AI technologies to address profitability pressures and operational inefficiencies that threaten financial sustainability. R1 RCM's automation-first approach demonstrates market leadership, managing over USD 1 trillion in net patient revenue while utilizing AI for clinical appeals, coding accuracy, and automated prior authorizations that significantly reduce processing times. CFO mandates increasingly focus on measurable ROI metrics, with successful implementations showing 38-47% time savings in patient scheduling, 44-53% improvements in claims processing efficiency, and substantial reductions in accounts receivable days. The executive emphasis on automation reflects broader healthcare industry pressures, including declining reimbursement rates, increased regulatory complexity, and the need for scalable solutions that maintain quality while reducing operational costs.
Restraints Impact Analysis*
| Restraint | (~) % Impact on CAGR Forecast | Geographic Relevance | Impact Timeline |
|---|---|---|---|
| Data-security and HIPAA compliance gaps | -3.2% | US-centric, expanding globally | Short term (≤ 2 years) |
| Interoperability barriers with legacy RCM stack | -2.8% | Global, acute in established markets | Medium term (2-4 years) |
| Shortage of annotated specialty-specific training datasets | -1.9% | Global, varying by specialty | Long term (≥ 4 years) |
| Algorithmic bias and auditability concerns slowing payer approvals | -2.1% | North America and Europe | Medium term (2-4 years) |
| Source: Mordor Intelligence | |||
Data-Security and HIPAA Compliance Gaps
Sixty-seven percent of providers admit they are unprepared for tighter AI security rules that require inventories of every algorithm touching electronic protected health information.[4]Brian Moyer, “HIPAA and AI Compliance Checklist,” Compliancy Group, compliancy-group.comNew federal guidance demands real-time audit trails and bias testing, extending deployment timelines and tempering near-term spending in the AI In Medical Billing Market.
Interoperability Barriers with Legacy RCM Stack
Many hospital billing systems lack modern APIs, forcing costly middleware projects that extend implementation timelines by months. Smaller providers struggle to fund replacements, creating a digital divide between early adopters and organizations tethered to outdated infrastructure. Vendors investing in pre-built connectors for dominant EHRs and clearinghouses gain competitive advantage, but industry-wide standards remain incomplete. The added integration expense dampens adoption velocity, constraining growth for the AI In Medical Billing Market until broader interoperability frameworks mature.
*Our forecasts treat driver/restraint impacts as directional, not additive. The impact forecasts reflect baseline growth, mix effects, and variable interactions.
Segment Analysis
By Deployment: Cloud Dominance Accelerates Multi-Tenant Adoption
Cloud deployment held 63.84% of AI in Medical Billing Market share in 2025 and is forecast to expand at 24.71% CAGR. Subscription models shift capital outlays to operating expense, while multi-tenant architectures supply enterprise-grade security to smaller practices. Automatic model updates deliver faster payer-rule changes, keeping denial-prevention logic current. On-premises installations persist in large academic centers that leverage existing private clouds. Hybrid approaches balance local data residency with cloud-based inference, refining compliance without sacrificing scalability.


By Application: Claims Processing Leads While Fraud Detection Surges
Claims processing and adjudication contributed 38.12% to AI in Medical Billing Market size in 2025. Natural-language engines validate documentation and payer rules, shrinking rejections and speeding reimbursement. Fraud detection is the fastest riser, slated for a 27.03% CAGR as pattern-recognition algorithms fight USD 200 billion in annual health-fraud losses. Adjacent use cases such as revenue forecasting and patient-payment optimization increase vendor stickiness.
By End User: Hospitals Dominate While Billing Firms Embrace Automation
Hospitals and clinics produced 58.22% of AI in Medical Billing Market size in 2025. CFOs target double-digit cuts in accounts-receivable days through comprehensive automation. Billing outsourcing firms are set for a 28.41% CAGR as they integrate AI into service portfolios that appeal to resource-constrained practices. Payers deploy AI for real-time adjudication, though legislative oversight limits full automation in several states.
By Business Model: Stand-Alone Platforms Lead Integration Transition
Stand-alone vendors controlled 54.40% revenue share in 2025. Their focused algorithms excel in autonomous coding and denial prevention. Integrated EHR/RCM suites, forecast to rise at 24.39% CAGR, attract buyers that want unified clinical-financial workflows. Over time, successful stand-alone features migrate into larger ecosystems, signaling consolidation across the AI In Medical Billing Market.
Geography Analysis
North America generated 46.10% of global revenue in 2025, fueled by advanced IT infrastructure, large payer-provider networks, and USD 11.1 billion in venture funding for healthcare AI that year, 60% of which targeted administrative solutions. The U.S. dominates due to complex billing rules and high claim volumes, while Canada and Mexico accelerate digitization to support cross-border care.
Asia Pacific is projected for a 26.64% CAGR to 2031. Government modernization agendas, medical-tourism growth, and telehealth adoption nurture demand for automated billing. China and India pilot real-time adjudication to support universal-coverage goals, while Japan and Australia use AI coding to offset aging workforces. Emerging ASEAN markets leapfrog legacy systems with cloud-native deployments, sustaining regional momentum for the AI in Healthcare Revenue Cycle Management market.
Europe posts steady gains as GDPR and forthcoming AI Acts emphasize transparency and data sovereignty. Vendors with privacy-centric architectures win contracts across Germany, France, and the Nordic countries. Middle East and Africa remain nascent but promising as Gulf states invest in smart-hospital complexes and Sub-Saharan nations adopt cloud RCM to close infrastructure gaps.

Competitive Landscape
The market shows moderate concentration. Optum integrates the USD 13 billion Change Healthcare deal to couple clearinghouse, analytics, and clinical data within a single stack. R1 RCM moved private in an USD 8.9 billion buyout, freeing management to expand automation reach. Waystar posted USD 256.4 million Q1 2025 revenue and launched AltitudeAI to address denial management with generative models.
Specialists such as AKASA, CodaMetrix, and Thoughtful AI refine transformer-based workflows that outperform incumbents in niche tasks. Strategic alliances emerge between EHR providers and focused AI firms to meet specialty needs without large-scale rip-and-replace. Competitive positioning now hinges on outcome-based pricing, embedded governance features, and seamless cloud delivery that enable rapid scaling across the AI In Medical Billing Market.
AI In Medical Billing Industry Leaders
Optum
Waystar
R1 RCM
athenahealth
AdvancedMD
- *Disclaimer: Major Players sorted in no particular order

Recent Industry Developments
- August 2024: R1 RCM agreed to a USD 8.9 billion privatization by TowerBrook Capital Partners and Clayton Dubilier & Rice.
- July 2024: Thoughtful AI raised USD 20 million to expand autonomous RCM agents.
- June 2024: AKASA launched a generative-AI medical-coding assistant delivering 40% higher performance on institution-specific data.
- May 2024: Firstsource acquired Quintessence to bolster AI-driven RCM automation capabilities.


Global AI In Medical Billing Market Report Scope
AI in medical bulling predict claim outcomes, identify potential challenges, and suggest preventive measures by analyzing historical data and current trends. This proactive approach helps to navigate the ever-changing medical billing landscape and optimize theoperations for maximum efficiency and revenue.
The AI in medical billing market is segmented by deployment (cloud, on-premises), by application (automated billing and documentation, claims processing, fraud detection, other applications), by end-users (hospitals and clinics, healthcare payers, ambulatory surgical centers, other end-users), by geography (North America, Europe, Asia-Pacific, Latin America, Middle East and Africa). The market sizes and forecasts are provided in terms of value (USD) for all the above segments.
| Cloud |
| On-Premises |
| Automated Coding and Documentation |
| Claims Processing and Adjudication |
| Fraud Detection and Risk Scoring |
| Revenue Analytics and Forecasting |
| Patient Payment Optimization |
| Hospitals and Clinics |
| Ambulatory Surgical Centers |
| Healthcare Payers |
| Billing Outsourcing Firms |
| Other Providers |
| Stand-alone AI RCM Platforms |
| North America | United States | |
| Canada | ||
| Mexico | ||
| South America | Brazil | |
| Argentina | ||
| Rest of South America | ||
| Europe | United Kingdom | |
| Germany | ||
| France | ||
| Italy | ||
| Spain | ||
| Russia | ||
| Rest of Europe | ||
| Asia-Pacific | China | |
| Japan | ||
| India | ||
| South Korea | ||
| Australia and New Zealand | ||
| ASEAN | ||
| Rest of Asia-Pacific | ||
| Middle East and Africa | Middle East | Saudi Arabia |
| UAE | ||
| Turkey | ||
| Rest of Middle East | ||
| Africa | South Africa | |
| Nigeria | ||
| Kenya | ||
| Rest of Africa | ||
| By Deployment | Cloud | ||
| On-Premises | |||
| By Application | Automated Coding and Documentation | ||
| Claims Processing and Adjudication | |||
| Fraud Detection and Risk Scoring | |||
| Revenue Analytics and Forecasting | |||
| Patient Payment Optimization | |||
| By End User | Hospitals and Clinics | ||
| Ambulatory Surgical Centers | |||
| Healthcare Payers | |||
| Billing Outsourcing Firms | |||
| Other Providers | |||
| By Business Model | Stand-alone AI RCM Platforms | ||
| By Geography | North America | United States | |
| Canada | |||
| Mexico | |||
| South America | Brazil | ||
| Argentina | |||
| Rest of South America | |||
| Europe | United Kingdom | ||
| Germany | |||
| France | |||
| Italy | |||
| Spain | |||
| Russia | |||
| Rest of Europe | |||
| Asia-Pacific | China | ||
| Japan | |||
| India | |||
| South Korea | |||
| Australia and New Zealand | |||
| ASEAN | |||
| Rest of Asia-Pacific | |||
| Middle East and Africa | Middle East | Saudi Arabia | |
| UAE | |||
| Turkey | |||
| Rest of Middle East | |||
| Africa | South Africa | ||
| Nigeria | |||
| Kenya | |||
| Rest of Africa | |||


Key Questions Answered in the Report
What is the forecast growth rate for the AI In Medical Billing Market?
The market is projected to climb from USD 5.49 billion in 2026 to USD 15.08 billion in 2031, posting a 22.41% CAGR over 2026-2031.
Which deployment model holds the largest share?
Cloud deployment leads with 63.84% share in 2025 because it lowers up-front costs and supports rapid scaling.
What application area is growing fastest?
Fraud detection and risk scoring is expected to record a 27.03% CAGR through 2031
Why are hospitals investing heavily in AI revenue tools?
Hospitals face coder shortages and rising denial rates; AI delivers 61–70% labor savings and 30% denial reductions.
Which geography is set for the highest growth?
Asia Pacific is forecast for a 26.64% CAGR due to healthcare digitization and supportive government programs.
Page last updated on:


