Market Overview
| Study Period | 2020 - 2031 |
|---|---|
| Forecast Data Period | 2026 - 2031 |
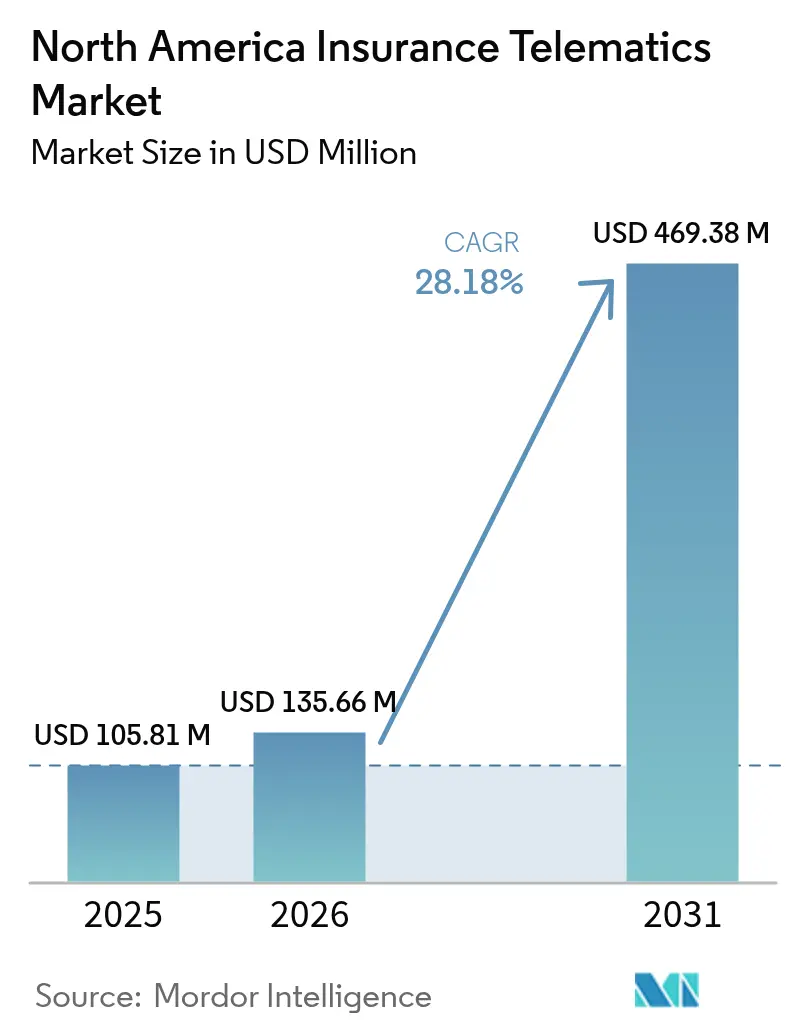
| Base Year Market Size (2025) | USD 105.81 Million |
| Market Size (2026) | USD 135.66 Million |
| Market Size (2031) | USD 469.38 Million |
| Growth Rate (2026 - 2031) | 28.18% CAGR |
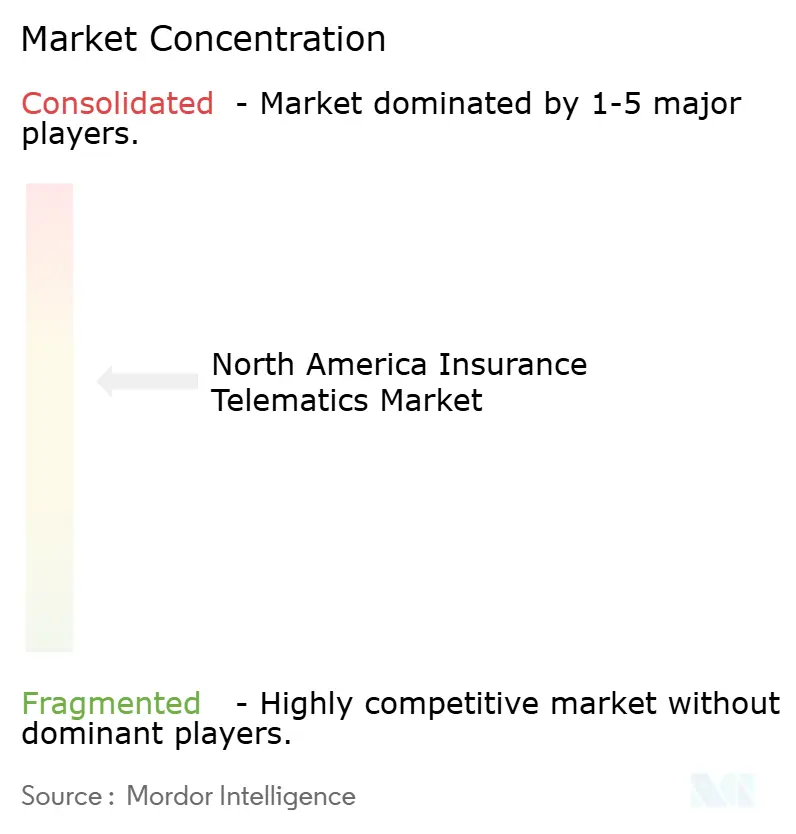
| Market Concentration | Medium |
Major Players *Disclaimer: Major Players sorted in no particular order Image © Mordor Intelligence. Reuse requires attribution under CC BY 4.0. | |
North America Insurance Telematics Market Analysis by Mordor Intelligence
The insurance telematics market size is expected to increase from USD 135.66 million in 2026 to reach USD 469.38 million by 2031, growing at a CAGR of 28.18% over 2026-2031. Escalating premium inflation, maturing smartphone sensors, and original equipment manufacturer data-sharing partnerships are expanding the addressable base of usage-based policies. United States auto insurers are passing higher repair costs on to customers, while Canadian carriers face a 36.4% premium jump recorded between 2014 and 2024, so telematics has become a strategic lever for underwriting profitability. Concurrently, platforms such as DriveWell now detect crashes with 99% accuracy, dissolving the reliability concerns that previously constrained adoption. Automakers are also embedding consent workflows into connected-car services, allowing drivers to enroll at the point of sale, a convenience that trims acquisition costs and fuels rapid enrollment growth. Intensifying competition from app-native insurers and technology firms is influencing incumbents to double down on vertical integration, original equipment manufacturer alliances, and claim-automation technologies.
Key Report Takeaways
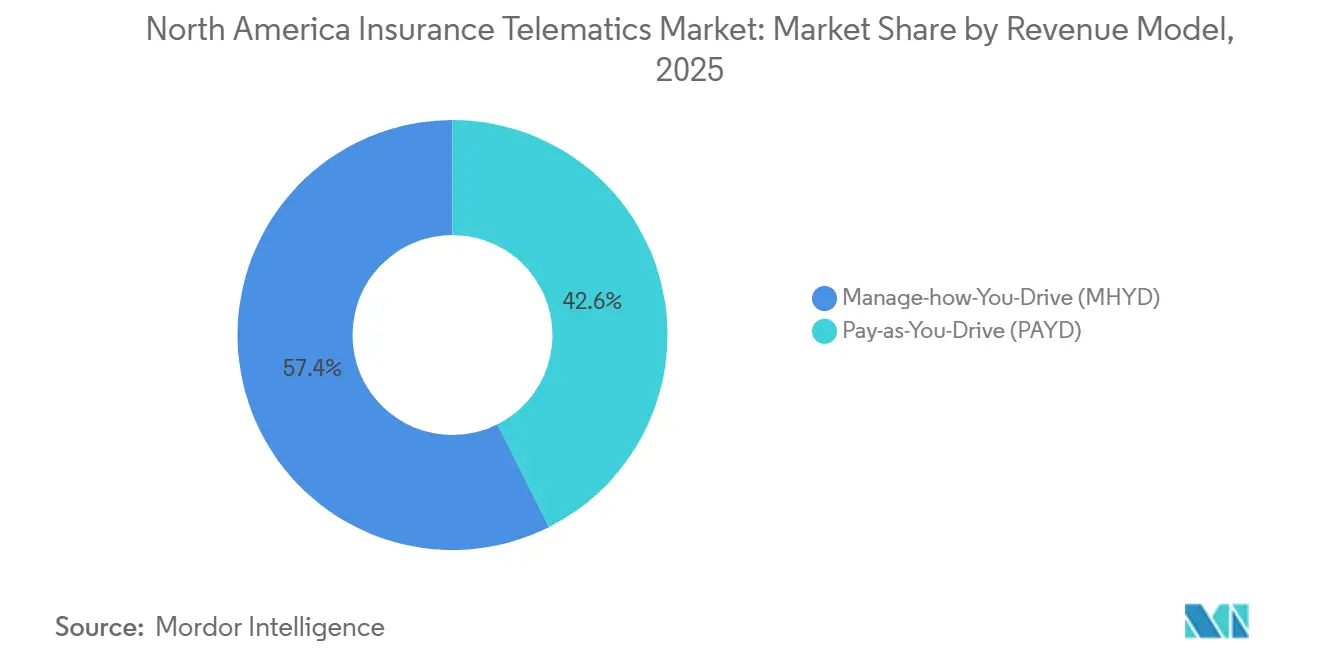
- By revenue model, pay-as-you-drive led with 42.57% share of the insurance telematics market share in 2025, while manage-how-you-drive is projected to advance at a 28.64% CAGR through 2031.
- By hardware type, smartphone-based programs captured 55.13% of the insurance telematics market share in 2025 and original equipment manufacturer embedded application programming interface data is forecast to expand at a 29.04% CAGR between 2026-2031.
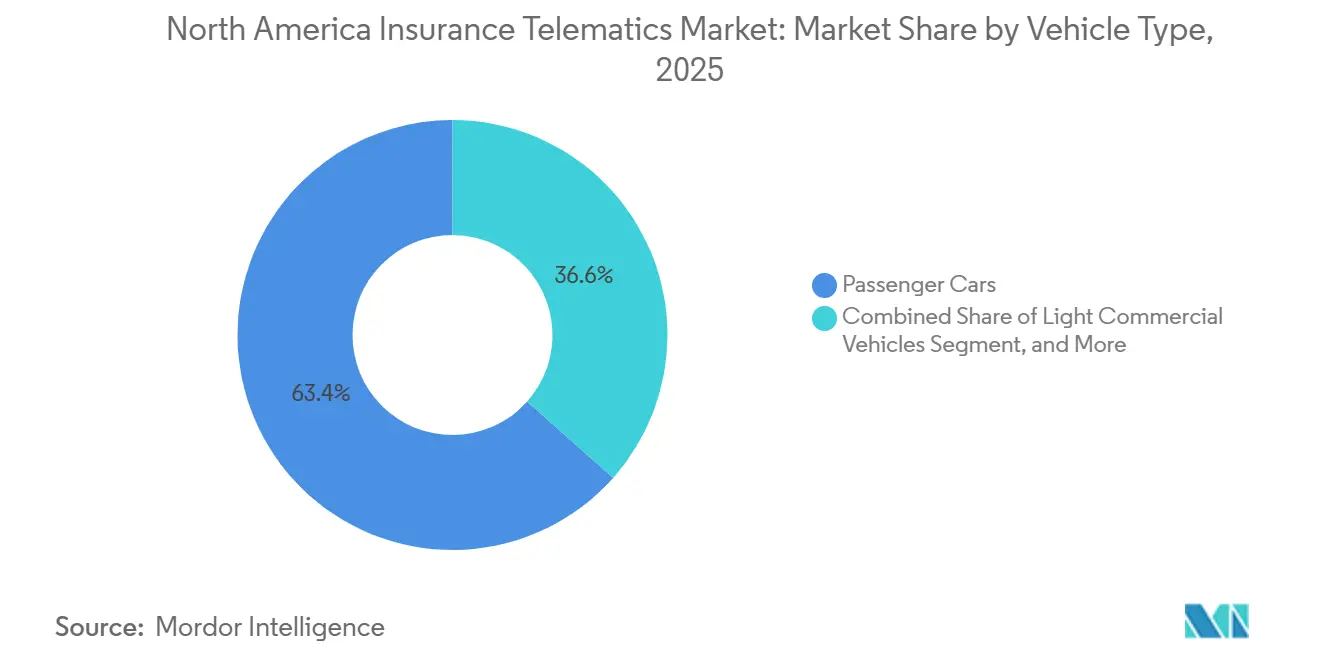
- By vehicle type, passenger cars accounted for 63.43% of the insurance telematics market size in 2025 and heavy commercial vehicles are expected to climb at a 29.42% CAGR to 2031.
- By end user, personal lines held 66.41% of the insurance telematics market share in 2025, whereas commercial fleets record the fastest growth at 28.78% through 2031.
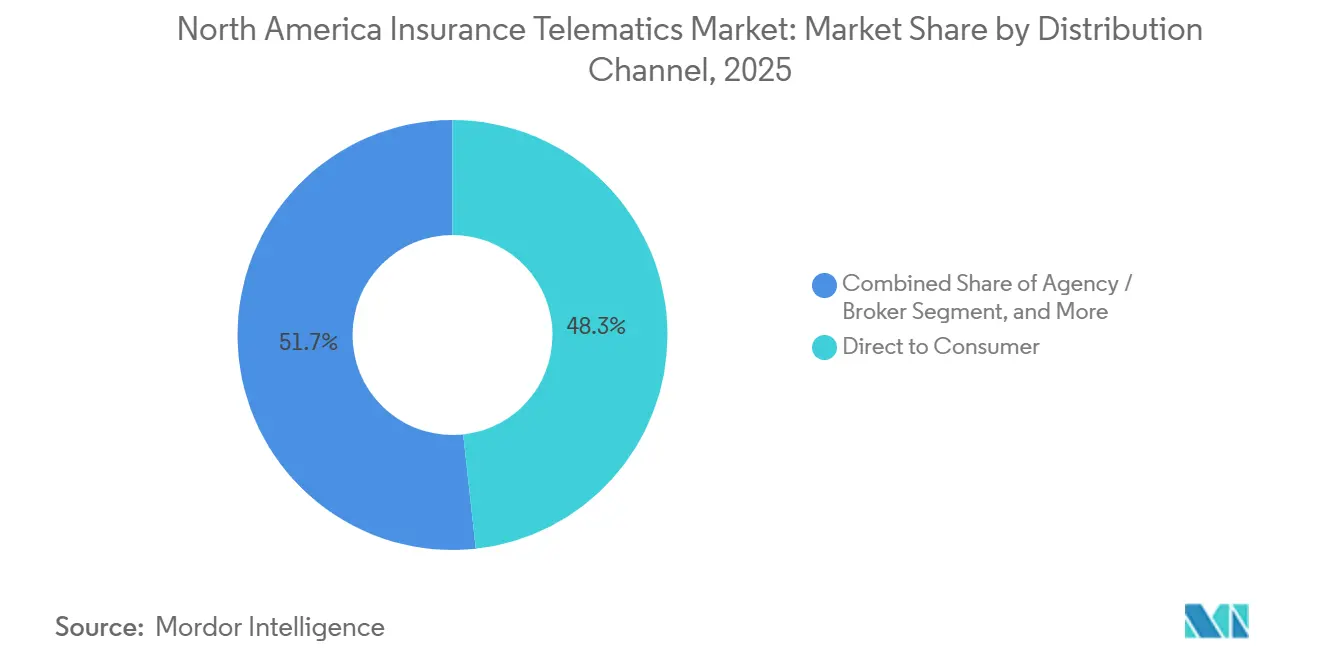
- By distribution channel, direct-to-consumer captured 48.27% of 2025 sales, and affinity plus original equipment manufacturer-tied programs are predicted to rise at a 28.93% CAGR by 2031.
- By data source,
- By country, the United States represented 78.21% of regional revenue in 2025, while Canada is on track for a 28.92% CAGR, the highest among North American markets.
Note: Market size and forecast figures in this report are generated using Mordor Intelligence’s proprietary estimation framework, updated with the latest available data and insights as of 2026.
North America Insurance Telematics Market Trends and Insights
Drivers Impact Analysis*
| Driver | (~) % Impact on CAGR Forecast | Geographic Relevance | Impact Timeline |
|---|---|---|---|
| Price-hardening in auto premiums | +6.2% | United States and Canada, with acute pressure in urban corridors (Toronto, Vancouver, New York, Los Angeles) | Short term (≤ 2 years) |
| Smartphone sensor accuracy and API access | +5.8% | North America, with spillover to insurers operating cross-border fleets | Medium term (2-4 years) |
| OEM embedded telematics penetration | +5.1% | United States (California, Texas, Florida) and Ontario, driven by Tesla, GM, Ford programs | Medium term (2-4 years) |
| Auto-lender partnerships for mileage-linked products | +4.3% | United States, concentrated in subprime and near-prime auto lending segments | Long term (≥ 4 years) |
| Claims-first telematics for accelerated settlements | +3.9% | United States and Canada, with early adoption by top-10 carriers | Short term (≤ 2 years) |
| AI-driven driver coaching gamification ROI | +3.5% | North America, led by commercial fleet operators in logistics and last-mile delivery | Medium term (2-4 years) |
| Source: Mordor Intelligence | |||
Price-Hardening In Auto Premiums
Rapid rate increases are steering consumers toward usage-based discounts that can reach 45%. Canadian premiums climbed 36.4% over the prior decade as high repair bills for advanced driver-assistance system components kept claim costs elevated. United States carriers wrote USD 318 billion in direct premiums during 2023, with private auto lines absorbing the steepest jumps.[1]Federal Insurance Office, “Property and Casualty Insurance Market Size and Auto Lines Rate Increases,” treasury.gov Telematics lets insurers reward safer drivers in real time, defend margins, and lessen adverse selection. Urban corridors such as Toronto, Vancouver, New York, and Los Angeles display the strongest enrollment because collision frequency amplifies price pressure, turning driver-behavior data into a competitive necessity.
Smartphone Sensor Accuracy And API Access
Upgraded gyroscopes, accelerometers, and global positioning modules now rival dedicated dongle accuracy. The DriveWell platform demonstrated 99% crash-detection fidelity, enabling immediate emergency dispatch and claim validation. Apple and Google permit background motion sensing at low battery drain, eliminating a historic enrollment hurdle. A 2025 Smartcar survey found that 41% of North American drivers would share trip data for lower premiums, marking a sharp rise in data-sharing comfort. These technical and behavioral shifts are accelerating the pivot from hardware to software onboarding, with sign-up complete in fewer than three minutes for many carriers.
OEM Embedded Telematics Penetration
Automakers are monetizing factory-installed connectivity by offering insurance at the time of vehicle sale. Tesla extended its monthly Safety Score pricing to more states in 2024, while Ford expanded Ford Insure beyond California in 2025. General Motors’ OnStar Insurance pilot proved that embedded data reduces adverse selection when policies activate the day the owner takes delivery. Hyundai and Subaru followed with Progressive and Nationwide alliances that build opt-in consent into infotainment screens. These programs are growing at nearly 29% annually and are shifting margins away from traditional dongle vendors toward automakers controlling sensor permissions.
Auto-Lender Partnerships For Mileage-Linked Products
Subprime and near-prime lenders bundle pay-per-mile coverage into vehicle loans to mitigate default risk and improve affordability. Metromile, now part of Lemonade, validated savings up to 40% for drivers who travel few miles. Lenders benefit because telematics flags usage surges or declines that correlate with financial stress, providing early intervention signals. Root Insurance built partnerships with fintech lenders targeting millennials and Gen Z, who often lack deep credit files. States such as California cap or prohibit credit-score use in pricing, shifting competitive emphasis toward mileage and behavior data.
Restraints Impact Analysis*
| Restraint | (~) % Impact on CAGR Forecast | Geographic Relevance | Impact Timeline |
|---|---|---|---|
| Data privacy and consent regulations | -4.7% | United States (California, Maryland, New York) and Canada (federal PIPEDA framework) | Short term (≤ 2 years) |
| Data quality and compatibility issues in smartphone UBI | -3.2% | North America, affecting Android fragmentation and iOS background-processing limits | Medium term (2-4 years) |
| Patchy state-level AI governance uncertainty | -2.1% | United States, with regulatory divergence across 50 states | Long term (≥ 4 years) |
| OEM data monetization squeezing third-party margins | -2.8% | United States and Canada, concentrated in markets with high Tesla and GM OnStar penetration | Medium term (2-4 years) |
| Source: Mordor Intelligence | |||
Data Privacy And Consent Regulations
A widening patchwork of rules complicates multi-state rollout. Maryland’s 2024 Senate Bill 984 requires explicit opt-in and deletion rights.[2]Maryland General Assembly, “Senate Bill 984: Telematics Data Privacy and Consent Requirements,” mgaleg.maryland.gov New York proposals press insurers to show actuarial fairness before using driving data. California classified telematics feeds as sensitive personal information under Senate Bill 354, triggering heightened disclosures. Surveys show that 60% of drivers opt out over privacy fears despite hefty discounts, forcing carriers to harmonize consent dashboards and retention policies, which erodes scale economies.
Data Quality And Compatibility Issues In Smartphone UBI
Fragmented smartphone ecosystems continue to undermine scoring precision and erode policyholder trust. Many Android handsets ship with sensors that deviate 10% or more from factory calibration standards, so identical driving inputs can receive dissimilar risk scores across devices. Apple’s background-processing limits occasionally suspend telematics apps on long trips, forcing algorithms to interpolate missing data and sometimes penalizing cautious drivers unfairly. A 2024 Journal of Risk and Insurance study showed that sustained tracking drained batteries by 8%-12% daily, prompting 15% of enrollees to disable location services within 90 days, which interrupts data continuity and triggers premium adjustments that feel arbitrary. Device upgrades mid-term further complicate matters because baseline scores reset when users switch phones, driving complaint spikes at state insurance departments. Carriers have responded by offering optional plug-in dongles, but that solution re-introduces shipping expense and customer-support calls, limiting scalability. Until cross-platform calibration standards emerge, data-quality friction will slow the smartphone segment’s migration from early adopters to mass-market drivers.
*Our forecasts treat driver/restraint impacts as directional, not additive. The impact forecasts reflect baseline growth, mix effects, and variable interactions.
Segment Analysis
By Revenue Model: Coaching Programs Gain Momentum
The insurance telematics market size for pay-as-you-drive eclipsed other models in 2025, yet manage-how-you-drive is expanding fastest. Coaching applications deliver steady in-app tips and gamified leaderboards that lower aggregate risk scores by double digits within six months. Insurers equate every one-point score improvement with measurable claims savings, tilting incentive budgets toward behavioral nudges over simple mileage caps. The shift also aligns with regulators, who worry that straight mileage pricing could disadvantage long-commute workers without necessarily improving road safety.
Engagement metrics validate the pivot. Across a 500,000-policy sample analyzed by Cambridge Mobile Telematics, claims declined 5.5% after drivers began receiving personalized feedback. Pay-how-you-drive retains a niche among suburban commuters whose daily patterns are stable but whose risk profiles fluctuate with driving style. Overall, carriers find that dynamic feedback lock-in boosts retention as policyholders work to preserve discounts earned through safer habits, perpetuating data flow and reducing churn.


By Telematics Hardware Type: OEM APIs Rise Quickly
Smartphones held the largest slice of the insurance telematics market share in 2025 because zero hardware cost and near-universal ownership make them a compelling default. However, original equipment manufacturer embedded application programming interface streams are advancing at the fastest rate, backed by manufacturer control over high-resolution sensor sets. Embedded modems deliver brake pressure, steering angle, and collision avoidance events that smartphones cannot capture, so underwriters using factory feeds achieve thinner loss-ratio variance across driver cohorts.
Portable on-board diagnostics dongles continue to phase out, primarily because shipping, installation, and customer-support overhead lift per-policy expenses. Carriers serving commercial fleets still deploy hybrid models that combine smartphone trip detection with dongle-based engine diagnostics to maximize uptime insights. Early evidence suggests that insurers accessing both data sources cut loss adjustment expenses more than those relying on a single channel, but cost must drop further for hybrid adoption to broaden beyond fleet lines.
By Vehicle Type: Heavy Fleets Accelerate
Passenger cars remain the volume anchor, yet heavy commercial vehicles deliver the steepest growth trajectory. The Federal Motor Carrier Safety Administration electronic logging device mandate obliges interstate trucks to transmit duty cycles digitally, so telematics infrastructure is already in place. Fleet insurers then add dash-camera analytics and driver coaching to lower nuclear verdict exposure. Vendors such as Geotab and Samsara report that fleets maintaining superior safety scores receive premium credits of 10%-25%, a compelling return for operators with razor-thin margins.
Light commercial vans, particularly parcel and last-mile delivery units, form a bridge segment where shorter trips compound stop-start exposure. Insurers that fuse routing efficiency algorithms with risk scoring unlock twin benefits of lower accident frequency and fuel savings, heightening buyer interest. Consequently, growth rates for fleet segments outpace personal lines, gradually narrowing the absolute volume gap.
By End User: Commercial Fleets Close In
Personal lines still command roughly two-thirds of policies, but commercial fleets grow at an annual rate near 29%. Third-party logistics platforms, municipal agencies, and rideshare vehicle owners view telematics as a hedge against worker injuries, liability suits, and idling fines. Arity’s fleet platform integrates predictive maintenance, flagging vehicles at heightened failure risk, which curbs downtime costs and reduces roadside accident probabilities.
Savings potential per vehicle is substantially larger for fleets than private drivers, so chief financial officers champion telematics rollouts when payback falls under one year. Software-as-a-service subscription models also remove capex barriers that historically deterred small and mid-sized operators. Over time, these economics are expected to equalize segment shares, particularly if carriers continue tailoring dashboards to fleet-manager workflows.
By Distribution Channel: Direct Digital Faces OEM Competition
Mobile-first insurers such as Root and Lemonade propelled direct-to-consumer sales to almost half of the 2025 total. Agent and broker presence endures where personalized advice matters, especially for complex commercial risks, yet their slice is incrementally eroding. The fastest gains come from affinity and original equipment manufacturer-tied programs that bundle telematics consent into connected-car subscriptions, thereby eliminating stand-alone acquisition expenditure.
Hyundai-Progressive and Subaru-Nationwide tie-ups show how showroom enrollment boosts persistency because policyholders perceive insurance as another vehicle feature rather than an annual shopping exercise. As more brands embed opt-in screens in infotainment systems, direct players may confront a distribution cost disadvantage, unless they negotiate comparable placement deals or differentiate via superior coaching interfaces.
By Data Source: Factory Sensors Command A Premium
Smartphone sensors still account for a majority share, yet original equipment manufacturer feeds are outpacing every other source. Carriers prize steering input, pedal pressure, and advanced driver-assistance system activations because those signals tighten risk segmentation. Tesla’s Safety Score algorithm, for instance, weighs forward-collision warnings heavily, something a phone cannot detect.
On-board diagnostics dongles remain important for fleets because engine-health diagnostics influence maintenance cycles and accident risk. Hybrid configurations pairing smartphone trip detection with dongle health alerts strike a balance between cost and fidelity, and they serve mixed-vehicle fleets where some units lack factory connectivity.
Geography Analysis
North America’s largest auto market, the United States, commanded 78.21% of revenue in 2025, leveraging a USD 318 billion premium base and strong competitive dynamics among top carriers. Progressive’s Snapshot, State Farm’s Drive Safe and Save, and Allstate’s Drivewise collectively enrolled upward of 15 million policies, propelling consumer awareness. Yet state-specific privacy bills hamper uniform deployment, obliging insurers to tailor consent flow and data retention by jurisdiction, which blunts economies of scale. Urban corridors post the highest penetration because congestion, theft, and claim severity raise premiums, incentivizing drivers to accept monitoring for discounts. Rural adoption lags since baseline rates are already lower and privacy skepticism is stronger.
Canada recorded the fastest growth at 28.92% and now acts as a laboratory for next-gen coaching. Provincial regulators in Ontario and Alberta explicitly endorse usage-based rating as non-discriminatory, sparking rapid carrier launches. Smartphone platforms Ajusto and My Driving Discount allow enrollment in under five minutes, and early participants report risk-score drops of 12% within three months.[3]Intact Financial, “My Driving Discount Program and AI-Driven Coaching,” intact.ca British Columbia’s post-2021 liberalization broadened competitive entry, though consumer familiarity remains lower than in Ontario, slowing near-term uptake. Quebec’s public bodily-injury scheme narrows private market scope but also tempers adverse selection, because all drivers share the same injury coverage.
Cross-border fleets that operate in both countries prefer single dashboards, so platform providers are racing to certify compliance with both federal PIPEDA rules and divergent United States state laws. Those integration hurdles are receding as vendors roll out configurable consent screens that detect driver location and invoke the applicable rule set automatically.
Competitive Landscape
Market power is moderate. The five largest carriers control roughly 60% of enrolled policies, yet agile technology specialists threaten share through superior mobile interfaces and instant coaching. Progressive, State Farm, and Allstate negotiate bulk sensor fees with Cambridge Mobile Telematics, Octo, and Arity, pushing per-policy data costs below USD 20 yearly. In turn, Arity fuels Allstate’s own pricing algorithms while syndicating scores to third-party carriers, monetizing at both ends of the value chain.
Vertical integration accelerates. Allstate’s ownership of Arity, Progressive’s internal data-science engine, and GEICO’s expanding telematics lab showcase how incumbents try to match start-up agility. Original equipment manufacturer alliances multiply, with Hyundai-Progressive and Subaru-Nationwide exemplifying showroom enrollment that cuts acquisition cost to near zero. Claim-automation investments run in parallel, where crash-detection pushes first notice of loss events into carrier systems within seconds, cutting loss-adjustment expense by up to 8 percentage points.
Disruptors Root and Lemonade target younger demographics, using two-week test drives or low-mileage billing to sidestep credit scoring where regulators prohibit it. Yet underwriting volatility harmed Root’s early profitability, illustrating the challenge of balancing aggressive growth with predictive precision. Automakers such as Tesla and General Motors deepen competitive pressure by launching captive products built on exclusive sensor feeds. Third-party platform providers must now court manufacturers for data access, occasionally under revenue-share terms that erode traditional licensing margins, setting the stage for consolidation among the 20 profiled suppliers.
North America Insurance Telematics Industry Leaders
Progressive Corporation
State Farm Mutual Automobile Insurance Company
Allstate Corporation
Nationwide Mutual Insurance Company
GEICO (Berkshire Hathaway Inc.)
- *Disclaimer: Major Players sorted in no particular order

Recent Industry Developments
- February 2025: Cambridge Mobile Telematics partnered with a top-five United States carrier to deploy DriveWell Fusion, aiming at 2 million policies and an 8% claim-frequency decline by 2026.
- January 2025: Arity rolled out predictive maintenance alerts for commercial fleets, drawing on signals from 50 million connected vehicles to cut roadside breakdowns by 15%.
- December 2024: Progressive announced 12 million active Snapshot policies, noting 18% fewer claims among participants.
- November 2024: Ford extended Ford Insure to Texas and Florida, using embedded modem data for monthly safety scoring.


North America Insurance Telematics Market Report Scope
The North America Insurance Telematics Market Report is Segmented by Revenue Model (Pay-as-You-Drive, Pay-how-You-Drive, Manage-how-You-Drive), Telematics Hardware Type (Portable OBD-II Dongle, Embedded TCU, Smartphone Based, OEM Embedded API Data), Vehicle Type (Passenger Cars, Light Commercial Vehicles, Heavy Commercial Vehicles), End-User (Personal Lines, Commercial Fleets), Distribution Channel (Direct to Consumer, Agency/Broker, Affinity and OEM-Tied), Data Source (OBD-II Data, Smartphone Sensor Data, OEM Embedded APIs, Hybrid Data Streams), and Geography (United States, Canada). The Market Forecasts are Provided in Terms of Value (USD).
By Revenue Model
| Pay-as-You-Drive (PAYD) |
| Pay-how-You-Drive (PHYD) |
| Manage-how-You-Drive (MHYD) |
By Telematics Hardware Type
| Portable OBD-II Dongle |
| Embedded TCU |
| Smartphone Based |
| OEM Embedded API Data |
By Vehicle Type
| Passenger Cars |
| Light Commercial Vehicles |
| Heavy Commercial Vehicles |
By End-User
| Personal Lines |
| Commercial Fleets |
By Distribution Channel
| Direct to Consumer |
| Agency / Broker |
| Affinity and OEM-Tied |
By Data Source
| OBD-II Data |
| Smartphone Sensor Data |
| OEM Embedded APIs |
| Hybrid Data Streams |
By Country
| United States |
| Canada |
| By Revenue Model | Pay-as-You-Drive (PAYD) |
| Pay-how-You-Drive (PHYD) | |
| Manage-how-You-Drive (MHYD) | |
| By Telematics Hardware Type | Portable OBD-II Dongle |
| Embedded TCU | |
| Smartphone Based | |
| OEM Embedded API Data | |
| By Vehicle Type | Passenger Cars |
| Light Commercial Vehicles | |
| Heavy Commercial Vehicles | |
| By End-User | Personal Lines |
| Commercial Fleets | |
| By Distribution Channel | Direct to Consumer |
| Agency / Broker | |
| Affinity and OEM-Tied | |
| By Data Source | OBD-II Data |
| Smartphone Sensor Data | |
| OEM Embedded APIs | |
| Hybrid Data Streams | |
| By Country | United States |
| Canada |


Key Questions Answered in the Report
What is the projected value of the insurance telematics market in 2031?
It is forecast to reach USD 469.38 million by 2031 based on the current CAGR.
How fast will the market grow between 2026 and 2031?
The market is expected to register a CAGR of 28.18% during this period.
Which segment shows the quickest revenue growth?
Manage-how-you-drive coaching programs expand the fastest at 28.64% annually.
Why are automakers entering usage-based insurance?
Factory-installed connectivity enables automakers to monetize data and enroll drivers at the time of vehicle purchase with minimal customer acquisition cost.
What privacy rules affect telematics adoption in the United States?
Laws in California, Maryland, and New York require explicit opt-in consent and may grant drivers data deletion rights, increasing compliance costs.
How do fleets benefit financially from telematics?
Commercial operators typically save 10%–25% on insurance premiums and reduce roadside breakdowns through predictive maintenance, often recovering their investment in less than a year.
Page last updated on:


