
AI In Oil And Gas Market Size and Share
Market Overview
| Study Period | 2020 - 2031 |
|---|---|
| Market Size (2026) | USD 4.28 Billion |
| Market Size (2031) | USD 7.91 Billion |
| Growth Rate (2026 - 2031) | 13.03 % |
| Fastest Growing Market | Asia Pacific |
| Largest Market | North America |
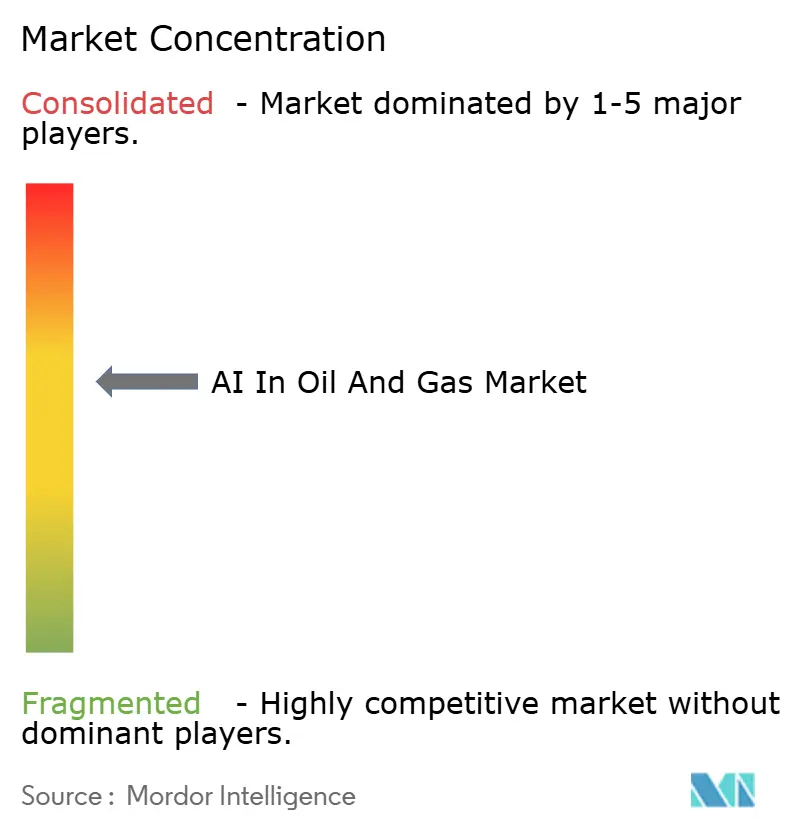
| Market Concentration | Medium |
Major Players *Disclaimer: Major Players sorted in no particular order Image © Mordor Intelligence. Reuse requires attribution under CC BY 4.0. | |
AI In Oil And Gas Market Analysis by Mordor Intelligence
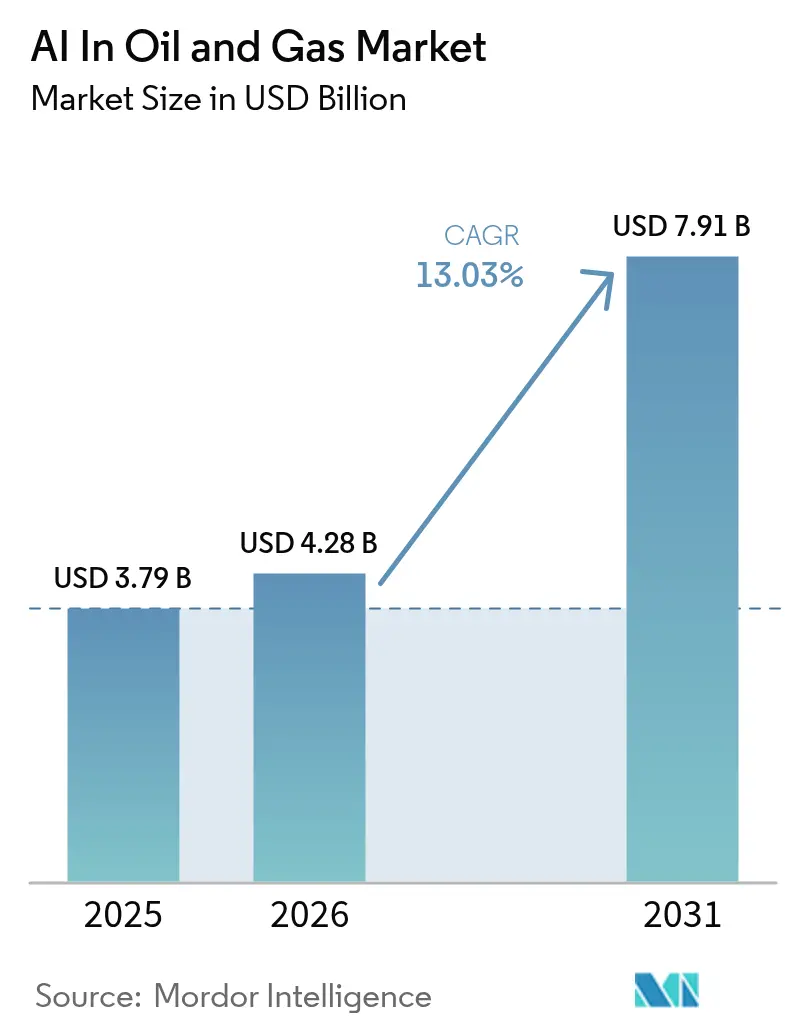
The AI in the oil and gas market size was valued at USD 3.79 billion in 2025 and estimated to grow from USD 4.28 billion in 2026 to reach USD 7.91 billion by 2031, at a CAGR of 13.03% during the forecast period (2026-2031). Market growth is being propelled by real-time hydraulic-fracturing control enabled through edge analytics, autonomous drilling systems that trim crew exposure in deepwater projects, and predictive-maintenance programs that curb unplanned downtime. Cloud–edge convergence is shortening model-deployment cycles, while physics-informed models are yielding faster subsurface insights that sharpen well-placement accuracy. Competitive activity is heating up as oilfield service majors embed AI into integrated platforms and cloud hyperscalers launch energy-specific tool sets. Capital-intensive platform rollouts and a thin pool of domain-aware data scientists temper near-term adoption, yet rising ESG requirements for methane-leak detection offer a widening demand runway.
Key Report Takeaways
- By operation, upstream held 61.05% of the AI in the oil and gas market share in 2025, while downstream is expanding at a 14.12% CAGR through 2031.
- By solution type, services accounted for 65.80% of the AI in oil and gas market size in 2025, but platform revenues are rising at a 13.74% CAGR.
- By asset location, onshore operations controlled 63.10% of the AI in the oil and gas market size in 2025; offshore activities are growing fastest at a 13.85% CAGR.
- By application, predictive maintenance captured 37.60% of the AI in the oil and gas market share in 2025, whereas HSE compliance is set to advance at a 14.34% CAGR to 2031.
- By AI technique, machine-learning approaches led with 49.20% of 2025 revenue of the AI in the oil and gas market, yet deep-learning methods are projected to register a 14.68% CAGR.
- By deployment mode, on-premises solutions dominated with a 56.50% share in 2025 of the AI in the oil and gas market; edge installations are on track for a 14.15% CAGR.
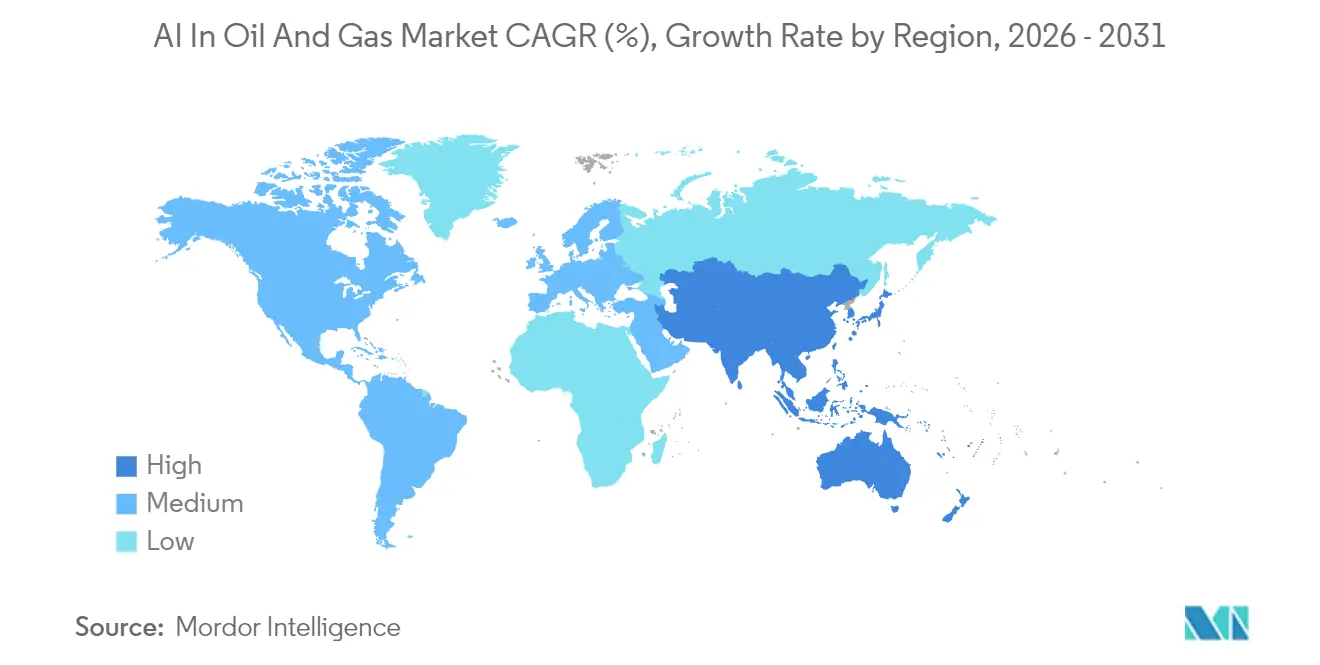
- By geography, North America commanded 35.95% of the 2025 revenue of the AI in the oil and gas market, while Asia-Pacific is projected to post a 14.41% CAGR between 2026 and 2031.
Note: Market size and forecast figures in this report are generated using Mordor Intelligence’s proprietary estimation framework, updated with the latest available data and insights as of 2026.
Market Trends and Insights
Drivers Impact Analysis of AI In Oil And Gas Market*
| Driver | (~) % Impact on CAGR Forecast | Geographic Relevance | Impact Timeline |
|---|---|---|---|
| Complex subsurface big-data processing | +3.2% | North America, Middle East, global | Medium term (2-4 years) |
| Lifting-cost pressure amid price swings | +2.8% | North America shale, global | Short term (≤2 years) |
| Predictive-maintenance downtime reduction | +2.1% | Europe, North America, global | Medium term (2-4 years) |
| Fiber-optic sensor AI for frac optimization | +1.9% | North America, emerging Middle East unconventionals | Short term (≤2 years) |
| Methane-leak AI monitoring for ESG mandates | +1.7% | United States, European Union, global | Long term (≥4 years) |
| Autonomous AI deep-water drilling systems | +1.3% | Gulf of Mexico, North Sea, Brazil | Long term (≥4 years) |
| Source: Mordor Intelligence | |||
Ability to Process Complex Subsurface Big Data
Seismic archives exceeding 1,500 petabytes at leading operators now require AI accelerators capable of parsing decades of drilling, petrophysical, and production data within hours, lifting drilling-location accuracy by 70% compared with manual methods. ADNOC’s ENERGYai agents trimmed geological-model build times by 75% through autonomous seismic analysis, allowing reservoir engineers to test multiple frac-cluster scenarios in minutes. [1] The fusion of physics-informed neural networks with historical well data is enabling faster history matches across unconventional plays, directly improving capital-efficiency metrics for large pad developments.
Pressure to Cut Lifting-Costs Amid Price Volatility
Price swings continue to squeeze margins, prompting operators to pursue 25–50% drilling-cost reductions through AI-guided automation. Nabors Industries recorded 30% faster penetration rates after deploying automated drilling controls, while integrated production-optimization software slashed decision-cycle times from days to hours for Permian assets. [2] Tachyus reported notable gains in artificial-lift efficiency by dynamically adjusting rod-pump parameters using reinforcement-learning algorithms. Mature-field operators increasingly view AI-assisted recovery as essential for extending economic lifespans.
Predictive-Maintenance Driven Downtime Reduction
Unplanned interruptions cost the sector nearly USD 50 billion annually, a gap now addressed by AI-based condition-monitoring platforms that marry IoT sensor streams with edge analytics. Shell’s exception-based surveillance has raised equipment reliability, and Wood PLC’s maint.AI targets 10% downtime cuts and 20–40% maintenance-cost savings. Offshore units gain outsized benefit because helicopter-based crew access is limited, and repair delays carry safety and environmental risk.
Fiber-Optic Sensor + AI for Real-Time Frac Optimization
Distributed acoustic sensing combined with machine-learning models now interprets fracture-propagation signatures in real time, guiding pump-rate and proppant-schedule adjustments that boost recovery factors by 15–20%. Edge processing keeps latency to milliseconds, enabling mid-stage design tweaks during a single frac job. Continuous model retraining on prior completions enhances prediction fidelity, reducing water use and lowering per-barrel lifting costs.
Restraints Impact Analysis of AI In Oil And Gas Market*
| Restraint | (~) % Impact on CAGR Forecast | Geographic Relevance | Impact Timeline |
|---|---|---|---|
| High up-front CAPEX for AI platforms | −2.1% | Smaller operators worldwide | Short term (≤2 years) |
| Scarcity of oil-and-gas domain data scientists | −1.8% | Developing regions, global | Medium term (2-4 years) |
| Cyber-risk at offshore edge layer | −1.2% | Offshore assets worldwide | Medium term (2-4 years) |
| Legacy SCADA interoperability gaps | −0.9% | Mature fields, global | Long term (≥4 years) |
| Source: Mordor Intelligence | |||
High Up-Front CAPEX for AI Platforms
Enterprise-scale deployments often carry multimillion-dollar price tags for compute clusters, data lakes, and specialized licensing, deterring small independents from adopting full-stack solutions. Data-modernization projects frequently double costs, as siloed SCADA and historian systems must be harmonized before analytics can proceed. Cloud-native offerings such as Azure Data Manager for Energy give operators a consumption-based alternative, yet data sovereignty and latency concerns keep many critical workloads on-premises. [3]
Scarcity of Oil-and-Gas Domain Data Scientists
Only 15% of reservoir engineers actively apply machine-learning methods, illustrating a narrow talent base. Aramco’s in-house training of 6,000 AI developers and similar university partnerships highlight the growing emphasis on joint upskilling programs. Talent scarcity lengthens project timelines and inflates consulting costs, becoming a structural hurdle for widespread AI penetration.
*Our forecasts treat driver/restraint impacts as directional, not additive. The impact forecasts reflect baseline growth, mix effects, and variable interactions.
AI In Oil And Gas Market Segment Analysis
By Operation:
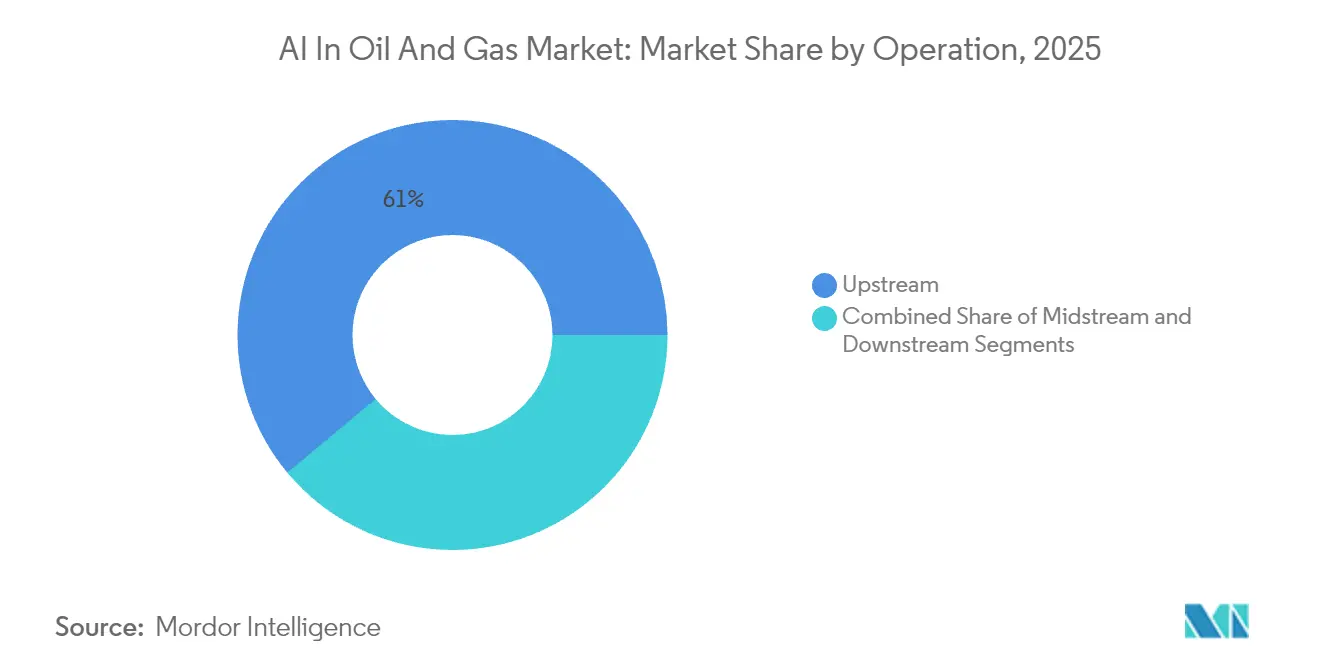
Upstream Dominance Drives Market LeadershipUpstream activities contributed 61.05% to the AI in the oil and gas market size in 2025, due to seismic interpretation, drilling automation, and production optimization workflows that require sophisticated analytics. These use cases demand pattern-recognition models capable of integrating petrophysical, geomechanical, and drilling parameters to improve well-placement and completion design. As unconventional reservoirs proliferate, upstream operators continue scaling AI-enabled workflows across pad developments, thereby cementing their share leadership within the AI in oil and gas market.
Downstream operations, in contrast, are forecast to post the segment’s fastest 14.12% CAGR through 2031 as refineries adopt model-predictive control for fuel blending and virtual sensors for real-time quality assurance. Generative-AI-powered document processing is shortening regulatory-report cycles, and computer-vision algorithms now track corrosion hotspots inside distillation columns. The trajectory signals greater AI democratization beyond exploration and production, reflecting a shift toward integrated optimization across the entire value chain of AI in the oil and gas industry.

By Solution Type:
Services Lead While Platforms AccelerateServices captured 65.80% of AI in the oil and gas market revenue in 2025, showcasing operators’ preference for domain experts to tailor models to asset-specific constraints. Advisory, data engineering, and model-maintenance contracts form the backbone of service revenues as companies iterate toward continuous-improvement loops.
Integrated platforms, however, are expanding at a 13.74% CAGR as operators look to standardize data ingestion, model management, and application orchestration. SLB’s Lumi and Baker Hughes’ Cordant™ suites typify multi-domain environments that embed large language models, computer-vision pipelines, and physics-informed simulators. The trend suggests a future transition from labor-intensive deployments to configurable platforms that scale enterprise-wide, a key inflection for the AI in oil and gas market.
By Asset Location:
Onshore Operations Lead, Offshore AcceleratesOnshore sites made up 63.10% of 2025 revenue due to North American shale basins, where mobile rigs, pad drilling, and robust 4G/5G coverage simplify sensor rollout. The relative accessibility allows rapid iteration of well-optimization models and continuous production-surveillance loops, supporting strong cash-flow generation and reinvestment in digital programs.
Offshore installations, though smaller in current share, are projected to log a 13.85% CAGR as autonomous robotics and remote-operations centers mitigate crew-change costs and safety risks. TotalEnergies’ remotely controlled robots and SLB’s AI-enhanced deep-water drilling contracts illustrate demand drivers where latency-sensitive edge nodes execute control logic near subsea BOPs. The result is a widening array of high-value offshore use cases, strengthening the growth outlook for AI in the oil and gas market.

By Application:
Predictive Maintenance Dominates, HSE Compliance AcceleratesPredictive-maintenance held 37.60% of 2025 spending, underpinned by clear ROI in turbine, compressor, and PCP monitoring. Operators leverage anomaly-detection models to align overhaul windows with logistics schedules, driving material savings in offshore FPSO campaigns. The practice remains foundational for digital programs across the AI in the oil and gas market.
HSE compliance is projected to deliver the fastest 14.34% CAGR as methane-leak surveillance, computer-vision PPE checks, and fatigue-detection wearables gain regulatory traction. U.S. methane-emitters must deploy continuous monitoring under new EPA rules, and computer-vision systems now track safety-critical valve positions with sub-second latency using enhanced YOLO V8 networks. The uptick shows how external mandates can unlock budget lines for AI programs beyond efficiency gains, expanding the value proposition of the AI in the oil and gas industry.
By AI Technique:
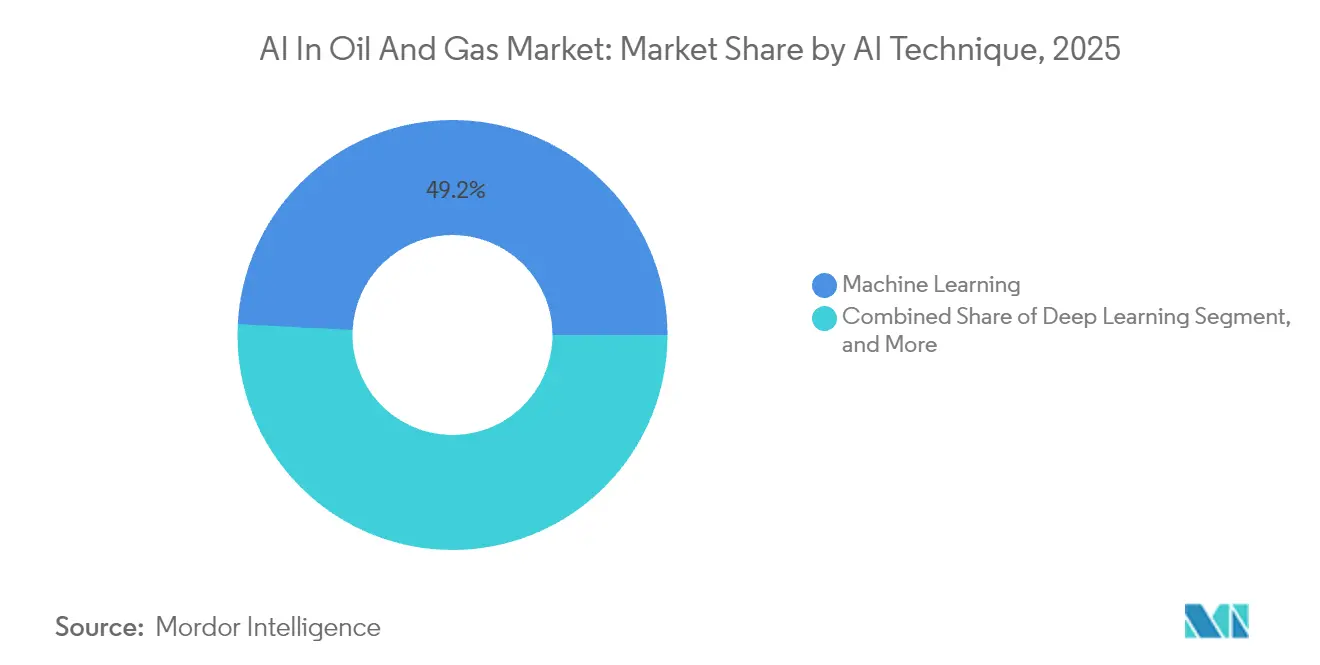
Machine Learning Leads, Deep Learning AcceleratesMachine-learning algorithms generated 49.20% of 2025 spending, reflecting their maturity in time-series regression, clustering, and classification tasks that dominate equipment and production analytics. Gradient-boosting and random-forest models remain the workhorses for structured SCADA datasets and are embedded in most commercial predictive-maintenance offerings.
Deep-learning networks, however, are on a 14.68% CAGR ascent courtesy of vision-based valve monitoring, large language models for document extraction, and transformer-based seismic interpretation. ADNOC’s 70-billion-parameter seismic agent validates the scalability of foundation models in domain-specific contexts. The blend of traditional and neural techniques within unified MLOps frameworks signals a maturation phase for AI in the oil and gas market.
By Deployment Mode:
On-Premises Dominates, Edge Computing SurgesOn-premises architectures retained a 56.50% share in 2025, given operator control over sensitive reservoir and production data and the deterministic performance guarantees achievable with local hardware. High-bandwidth imaging workloads such as 4D seismic inversion continue to run in operator data centers where latency to petabyte-scale stores is minimal.
Edge computing is forecast to surge at a 14.15% CAGR as ruggedized devices execute models on drill ships, unmanned platforms, and isolated gas plants where connectivity is intermittent. Sensia’s oilfield-hardened edge units integrate zero-trust security layers and FPGA accelerators for low-power inference. Hybrid patterns that federate learning in the cloud and inference at the edge are poised to become mainstream, reshaping deployment economics across the AI in oil and gas market.
Geography Analysis
North America AI in Oil and Gas Market
North America held 35.95% of 2025 revenue, anchored by prolific shale developments and wide adoption of automated rigs, predictive-maintenance suites, and methane-leak analytics. Companies such as ExxonMobil, Chevron, and Pioneer Natural Resources run cloud-native subsurface workflows at petabyte scale, supported by mature fiber and 5G backbones. Government stimulation packages for infrastructure modernization further underpin digital uptake, while a thriving startup ecosystem accelerates tool creation for AI in the oil and gas market.
Europe AI in Oil and Gas Market
Europe maintains a technologically advanced yet smaller share, with North Sea operators focusing on offshore robotics and CCS monitoring. Regulations on carbon intensity and methane emissions propel AI-enabled environmental compliance, particularly in Norway and the Netherlands. Cross-sector collaboration on open data standards like OSDU fosters interoperability, reducing integration friction across installations.
APAC AI in Oil and Gas Market
Asia-Pacific is the fastest-growing region at a 14.41% CAGR, fueled by upstream investments in India, Indonesia, and China. PTTEP’s portfolio of 65 digital features and Indian refiners’ predictive-maintenance pilots illustrate a regional shift toward enterprise-wide digitization. Rising LNG demand, energy-security objectives, and a swelling pool of software engineers provide structural tailwinds for AI rollout across the AI in oil and gas market.
MEA AI in Oil and Gas Market
The Middle East and Africa region leverages sovereign AI programs and megaproject budgets to scale data centers and supercomputing clusters. ADNOC’s generation of USD 500 million in AI value during 2024, along with Aramco’s METABRAIN LLM initiative, signals rapid capability uplift. Government mandates for economic diversification and net-zero commitments are translating into expanded funding for leak-detection, drilling automatio,n and flare-reduction analytics, strengthening regional momentum within the AI in oil and gas market.
Regulatory Landscape
Regulation affecting AI deployment in oil and gas is tightening via critical-infrastructure and public-sector AI governance frameworks that emphasize documented controls, security, and human oversight. In the European Union, the EU AI Act classifies certain AI used as safety components in critical infrastructure as high-risk, which triggers technical documentation, conformity assessment, and registration obligations. These requirements shape how operators and oilfield service providers productize AI for safety-critical process control and monitoring. The UK energy regulator Ofgem published ethical AI guidance for the energy sector in May 2026, reinforcing expectations around accountability, bias controls, and explainability for operational AI use.
In the United States, energy-sector AI governance is increasingly codified through federal policy and standards work. The US Department of Energy maintained a Generative AI Policy effective in December 2025, requiring FedRAMP-aligned controls and oversight for GenAI products used in DOE programs. In May 2026, DOE issued Acquisition Letter AL-2026-05 to formalize procurement controls and documentation requirements for AI systems, aligning to OMB guidance. NIST initiated development in April 2026 of a Trustworthy AI in Critical Infrastructure Profile tailored to energy. State-level activity also matters, including California SB 1011 (2025-2026 session), which directs adoption of AI model-use standards for electrical and gas corporations by January 1, 2028, shaping governance requirements for midstream and downstream operators and utilities.
Value Chain Analysis
The value chain starts with data generation at assets (drilling rigs, wells, compressors, pipelines, refineries) through SCADA/historians, IoT sensors, and fiber-optic monitoring, then moves into ingestion and contextualization into data platforms and digital twins. Oilfield service providers and specialized AI vendors build models and applications (predictive maintenance, drilling optimization, HSE compliance, and subsurface interpretation) using cloud and HPC infrastructure, alongside edge compute for low-latency inference in remote and offshore environments. As a result, platform layers increasingly sit between OT data and applications, supporting MLOps, governance, and deployment across upstream, midstream, and downstream workflows.
Go-to-market is driven by partnerships that blend domain workflows, industrial data platforms, and compute ecosystems. For example, Cognite working with Aker BP and NVIDIA integrated NV-Tesseract foundational models into the Cognite AI and Data Platform for industrial anomaly detection (March 2026). SLB also signed an MoU with Qualcomm Technologies to deploy edge AI solutions for real-time decision-making across wells and facilities (June 2026). Operator adoption is further reinforced by enterprise reliability programs, such as Shell expanding collaboration with C3 AI to scale predictive maintenance across more than 13,000 pieces of equipment (June 2026). This is where services-led deployments evolve into standardized platforms and agent-based workflows across global asset operations.
Competitive Landscape
The marketplace is moderately concentrated, with oilfield service majors, supermajors, and cloud hyperscalers driving platform standardization. SLB’s collaborations with NVIDIA, TotalEnergies, and Geminus AI demonstrate a strategy of combining high-performance compute with physics-based model builders for full-value-chain coverage. [4] Baker Hughes is deepening Azure-enabled Cordant modules for production optimization, while Halliburton embeds micro-services into its iEnergy platform to streamline reservoir-model orchestration.
Specialist vendors supply niche capabilities such as Ambyint’s rod-lift optimization and Welligence’s decision-support analytics. Venture funding remains active, with Ambyint securing USD 26.5 million and Welligence attracting USD 41 million, underscoring the appetite for focused solutions targeting well-specific pain points. Cybersecurity pure-plays are emerging to protect edge nodes in offshore settings where attack surfaces expand with every sensor addition.
Competitive dynamics are shifting from isolated pilots toward enterprise-scale rollouts that necessitate MLOps, data-governance, and change-management expertise. Players capable of bundling platforms, advisory, and managed services under a single commercial construct are best positioned to capture wallet share as the AI in the oil and gas market matures.
AI In Oil And Gas Industry Leaders
-
C3.ai Inc.
-
SparkCognition Inc.
-
Uptake Technologies Inc.
-
Tachyus Corporation
-
Akselos SA
- *Disclaimer: Major Players sorted in no particular order
AI In Oil And Gas Market Companies Covered in this Report
- C3.ai Inc.
- SparkCognition Inc.
- Uptake Technologies Inc.
- Tachyus Corporation
- Akselos SA
- IBM Corporation
- Microsoft Corporation
- Amazon Web Services Inc.
- Google Cloud LLC
- ABB Ltd.
- Honeywell International Inc.
- Schlumberger NV
- Halliburton Company
- Baker Hughes Company
- Siemens Energy AG
- Huawei Technologies Co. Ltd.
- Infosys Limited
- NVIDIA Corporation
- Cognite AS
- Wipro Limited
- Aspen Technology Inc.
- PETROSHELF LLC
- Arundo Analytics Inc.
- Kongsberg Digital AS
- Expert Petroleum SRL
- OPRO.ai Inc.
Market Opportunities and Future Outlook
A key whitespace is the shift from decision-support analytics to closed-loop automation that executes drilling and completion actions directly, with edge analytics and ruggedized inference closing the latency gap in offshore and remote onshore assets. In July 2026, Halliburton and Eni completed an industry-first closed-loop rig automation and managed pressure drilling deployment on a deepwater exploration well offshore Indonesia, reporting drilling-efficiency improvement of more than 15%. This illustrates how automation-centric AI changes operator procurement toward integrated control, sensing, and model-orchestration stacks. Similar closed-loop fracturing deployments, including Chevron and Halliburton in Colorado (June 2026), expand opportunities for AI vendors that can integrate real-time subsurface signals, completion design updates, and safety interlocks.
A second opportunity is scaling AI through standardized infrastructure and operator-specific platforms that reduce deployment friction across multi-asset portfolios, especially for predictive maintenance, subsurface interpretation, and surface optimization. SLB and NVIDIA partnered in March 2026 to build AI Factories for Energy using modular data center designs and domain-specific generative AI. PETRONAS signed a third Joint Development Agreement in July 2026 with IBM and Tridiagonal.AI to advance TriCipta AI for surface equipment optimization after earlier 2025 deployments (AI.SEEK and Global Exploration Basin Screening). Large-operator disclosures also support expansion of physics-informed and foundation-model approaches for subsurface workflows, including Saudi Aramco citing a 20% aggregate production lift from the first full year of its upstream AI program across eleven sites (reported April 2026) and ExxonMobil describing an AI model with a 90% success rate in identifying known accumulations in Guyana using offshore seismic data (June 2026), supported by governance-ready enterprise MLOps.
Recent Industry Developments in AI In Oil And Gas Market
- June 2026: Shell expanded its collaboration with C3 AI to scale C3 AI Reliability and the C3 Agentic AI Platform across global operations, extending use from anomaly detection into agent-based root cause analysis and maintenance remediation. The initiative points to a move toward automating the maintenance lifecycle end-to-end, which increases requirements for governed data integration across sensor streams, work orders, and operational logs.
- May 2025: C3 AI and Baker Hughes renewed and expanded their joint venture agreement through June 2028 to deliver enterprise AI solutions for oil and gas and chemical customers. The extension reinforces how domain workflow expertise and industrial deployment capabilities support scaling AI from pilots to repeatable enterprise programs.
- November 2024: ADNOC and AIQ unveiled ENERGYai, an agentic AI solution featuring autonomous seismic agents designed to accelerate subsurface interpretation and operational monitoring. The launch heightened competitive intensity around operator-grade agentic AI for upstream workflows and increased emphasis on integrating domain data estates into production AI platforms.
AI In Oil And Gas Market Report Scope and Research Methodology
Market Definition and Coverage
This market covers spending on artificial intelligence solutions used by oil and gas companies to improve exploration, drilling, production, transportation, refining, and safety, including related software platforms and services. Revenue is counted where AI is deployed for oil and gas use cases, across onshore and offshore assets.
Scope exclusions: Excludes general IT outsourcing, standard automation without an AI layer, and generic cloud infrastructure revenue that is not tied to an oil and gas AI use case.
Segments Covered in This Report
- By Operation
- Upstream
- Midstream
- Downstream
- By Solution Type
- Platform
- Services
- By Asset Location
- Onshore
- Offshore
- By Application
- Quality Control
- Production Optimisation
- Predictive Maintenance
- HS&E Compliance
- Exploration and Drilling
- Other Applications
- By AI Technique
- Machine Learning
- Deep Learning
- Computer Vision
- Natural Language Processing
- Other AI Techniques
- By Deployment Mode
- Cloud
- On-Premises
- Edge
- By Geography
- North America
- United States
- Canada
- Mexico
- South America
- Brazil
- Argentina
- Chile
- Rest of South America
- Europe
- Germany
- United Kingdom
- France
- Italy
- Spain
- Rest of Europe
- Asia-Pacific
- China
- India
- Japan
- South Korea
- Malaysia
- Singapore
- Australia
- Rest of Asia-Pacific
- Middle East and Africa
- Middle East
- United Arab Emirates
- Saudi Arabia
- Turkey
- Rest of Middle East
- Africa
- South Africa
- Nigeria
- Rest of Africa
- Middle East
- North America
Data Sources, Market Sizing, and Validation
Desk Research
Desk research was used to set the industry context and anchor key inputs in public, checkable datasets. We relied on sources such as the U.S. Energy Information Administration for activity and price context, the International Energy Agency for energy outlook indicators, and OPEC reporting for upstream supply signals. For keeping AI definitions practical, we also referenced NIST publications, and peer reviewed journals were used to sanity check common oilfield AI use cases and the performance limits that are typically reported.
To keep assumptions realistic, we reviewed public company filings, annual reports, and investor presentations to understand where AI budgets are being placed across upstream, midstream, and downstream workflows. Additional validation came from association websites and standards bodies relevant to industrial data and safety, along with reputable press coverage on project launches and operating targets. Where needed, we used approved paid subscription sources for company financials and news, and an approved patent database to track investment intensity and solution direction. The sources listed here are illustrative only, and many other public references were reviewed for data collection, cross checks, and clarification.
Primary Interviews and Surveys
Primary work focused on confirming what is actually being bought and deployed, and how spending differs by asset type and operating environment. We spoke with a mix of oil and gas operators, digital and engineering leaders, and solution delivery stakeholders across major regions, so assumptions on deployment mix (cloud, on premises, and edge) and adoption timing could be corrected when reality differed from desk signals.
Distribution of primary research fieldwork respondents
| Company type | Respondent position | Region |
|---|---|---|
| Top tier: 32% | CXOs: 17% | APAC: 46% |
| Mid tier: 51% | Functional/Unit leaders: 28% | EMEA: 36% |
| Smaller Players: 17% | Managers: 55% | Americas: 18% |
Market-Sizing & Forecasting
Sizing starts with a top-down build that reconstructs the reachable demand pool from oil and gas digital spending signals, then applies AI adoption rates by operation type and deployment environment. To keep totals grounded, we corroborate results with selective bottom-up approximations, such as sampled contract values, channel checks on platform versus services mix, and volume times average selling price checks for common workflows.
Inputs used in the model include upstream activity indicators (rig count and well intervention intensity), asset monitoring needs (pipeline and facility footprint proxies), the share of workflows moving to real time analytics at the edge, the platform versus services mix by operation type, and the pace at which models are refreshed in operational settings. Where data is thin, gaps are handled using ranges validated through interviews, and then narrowed using region level capex direction and observed rollout timelines from public disclosures.
For forecasting, scenario analysis is used to translate energy price and capex direction into adoption outcomes, followed by smoothing to avoid unrealistic year to year jumps. Final outputs are adjusted only when multiple signals line up, such as capex guidance, project announcements, and interview based expectations on budget protection for reliability and safety use cases.
Data Validation & Update Cycle
Validation is done in layers so unusual results are flagged early and fixed before sign off. We compare model outputs against independent signals, such as oil and gas capex direction, the mix of onshore versus offshore activity, and whether spend is trending toward services heavy pilots or scaled platform rollouts. When a region or operation shows an unexpected spike, assumptions are rechecked, and when needed, respondents are recontacted to confirm whether it is a one time project wave or a sustained shift.
Before release, the numbers go through variance checks across segments, followed by a separate analyst review to confirm definitions were applied consistently. Reports are refreshed annually, with interim updates when material events change deployment pace, budgets, or adoption constraints. Right before delivery, a final pass is completed so clients receive the latest updated view at that time.
Mordor Intelligence's Oil and Gas AI Market Size Compared Against Other Published Estimates
Published estimates for this market often vary because groups do not treat the same spend buckets as in scope, even when they use similar labels like AI platform, analytics, or digital oilfield. Differences also show up when services are counted too broadly, when adjacent digital transformation lines are blended in, or when a base year is chosen during a higher or lower capex cycle.
The main gap comes from whether non-AI industrial automation and general cloud modernization are blended into the total. In its analysis, Mordor Intelligence counts only AI platforms and AI related services that are directly tied to upstream, midstream, and downstream use cases, while keeping the platform to services split consistent by operation type.
Benchmark comparison
| Source | Market Size | Gaps in Research Methodology |
|---|---|---|
| Mordor Intelligence | USD 4.28 B (2026) | |
| Global Consultancy A | USD 6.34 B (2025) | Uses a broader framing that can blend AI with wider digital transformation revenue lines and applies an earlier base year, which can lift the starting value and accelerate the implied growth curve. |
| Industry Publisher B | USD 4.00 B (2025) | Uses a different component split that can treat implementation and managed services as a larger addressable pool, and it also uses a longer horizon where adoption is assumed to ramp faster across regions. |
Looking across the three numbers, most of the spread is explained by scope boundaries and base year timing, rather than disagreement that AI adoption is rising in oil and gas. When the included revenue lines and adoption pacing assumptions are made explicit, the market size becomes easier to trace, review, and update through repeatable steps.
Key Questions Answered in the Report
How quickly is artificial intelligence adoption growing across global oil and gas operations?
Spending is advancing at a 13.03% CAGR, with the AI in oil and gas market forecast to expand from USD 4.28 billion in 2026 to USD 7.91 billion by 2031.
Which operational segment captures the largest share of digital-intelligence spending?
Upstream dominates with 61.05% of 2025 revenue because data-heavy exploration and production workflows benefit most from advanced analytics.
What application currently delivers the clearest return on investment?
Predictive-maintenance programs lead, representing 37.60% of 2025 spending and delivering documented cuts in unplanned downtime and maintenance costs.
Why is edge computing receiving heightened attention?
Edge deployments are growing at a 14.15% CAGR because low-latency inference is essential for remote drill ships, frac sites and offshore platforms with limited connectivity.
Which region is expanding fastest in digital-energy investments?
Asia-Pacific is projected to log a 14.41% CAGR through 2031, driven by upstream investment in India, Indonesia and China and aggressive digital-transformation agendas.
What is the main barrier restricting broader AI rollout among independents?
High up-front CAPEX for platform deployment, coupled with a shortage of domain-savvy data scientists, constrains adoption among smaller operators.