
Market Overview
| Study Period | 2020 - 2031 |
|---|---|
| Market Size (2026) | USD 1.20 Billion |
| Market Size (2031) | USD 3.53 Billion |
| Growth Rate (2026 - 2031) | 24.08 % |
| Fastest Growing Market | Europe |
| Largest Market | Europe |
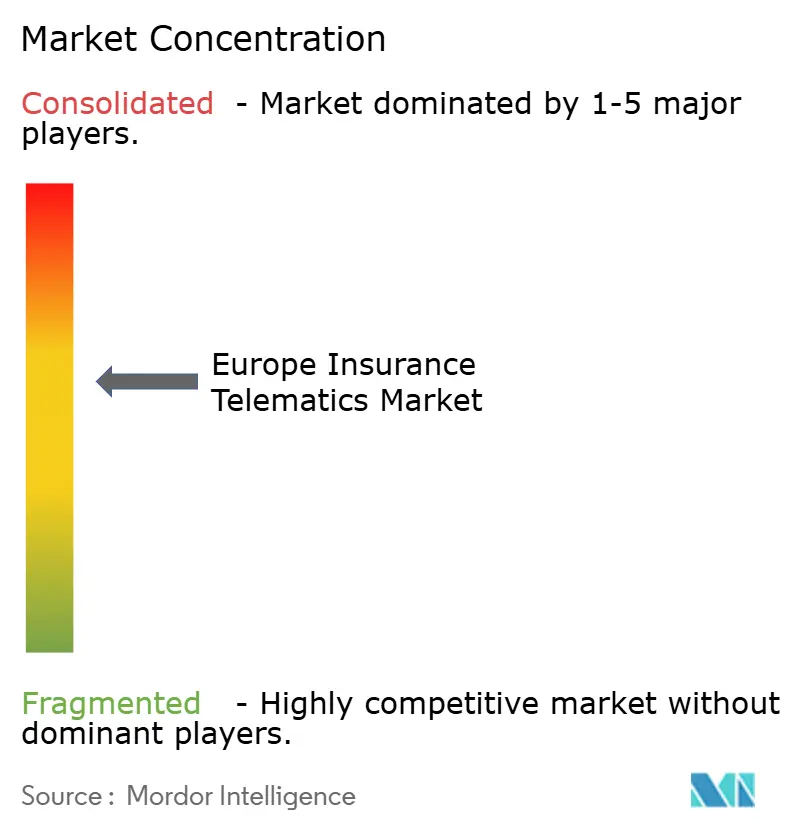
| Market Concentration | Medium |
Major Players *Disclaimer: Major Players sorted in no particular order Image © Mordor Intelligence. Reuse requires attribution under CC BY 4.0. | |

Europe Insurance Telematics Market Analysis by Mordor Intelligence
The Europe Insurance Telematics Market size is estimated at USD 1.20 billion in 2026, and is expected to reach USD 3.53 billion by 2031, at a CAGR of 24.08% during the forecast period (2026-2031).
Growth is fueled by embedded original-equipment-manufacturer (OEM) connectivity, expanding smartphone-only propositions, and demonstrated loss-ratio cuts of 15-25 percentage points when artificial-intelligence (AI) claims triage is paired with real-time driving data. Italy retained its first-mover edge through a decade of black-box deployment, yet Germany is ascending on a pure-app model that sidesteps hardware, positioning the country for the region’s fastest expansion. Manage-how-you-drive coaching products, cloud deployment, and shared-mobility fleets are outperforming their respective averages as insurers seek lower device costs, elastic compute, and new commercial-fleet revenues. Meanwhile, the European Commission’s eCall data-access regulation and fast-growing neutral data marketplaces are fragmenting competitive advantage by making factory data broadly available.[1]European Commission, “Delegated Regulation on Vehicle Data Access,” ec.europa.eu
Key Report Takeaways
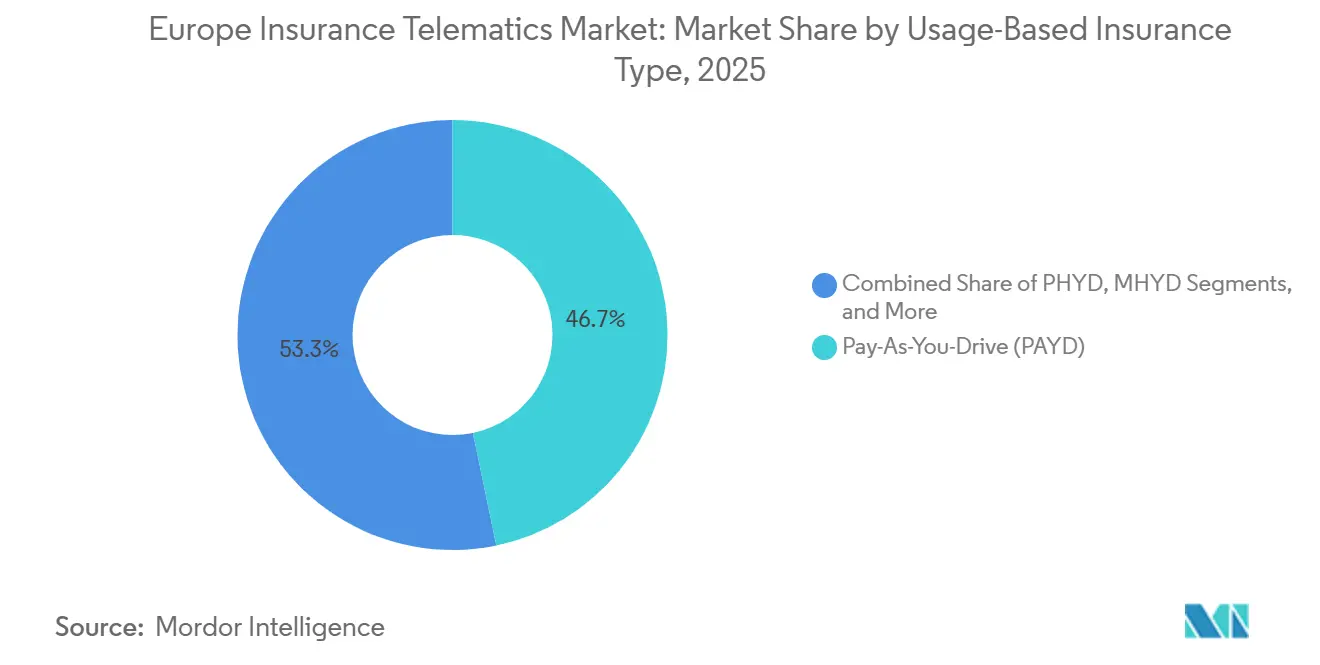
- By usage-based insurance type, pay-as-you-drive led with 46.73% revenue share in 2025 of Europe insurance telematics market, while manage-how-you-drive is projected to advance at a 24.88% CAGR through 2031.
- By telematics technology, black-box devices held 38.74% of Europe insurance telematics market share in 2025, whereas smartphone-only solutions record the highest projected CAGR at 24.65% to 2031.
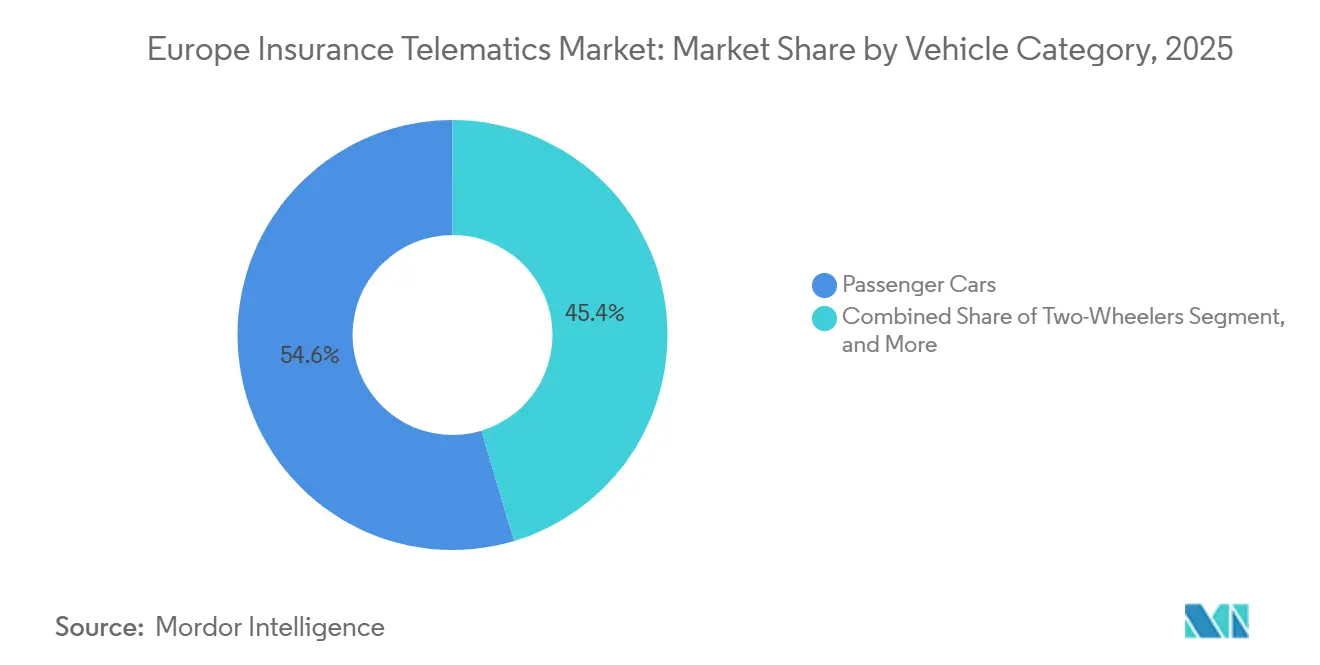
- By vehicle category, passenger cars commanded 54.63% of Europe insurance telematics market size in 2025 and shared-mobility fleets are forecast to expand at 25.02% CAGR between 2026-2031.
- By deployment model, cloud platforms captured 62.61% share in 2025 of Europe insurance telematics market and will grow at a 25.33% CAGR, eclipsing on-premise alternatives.
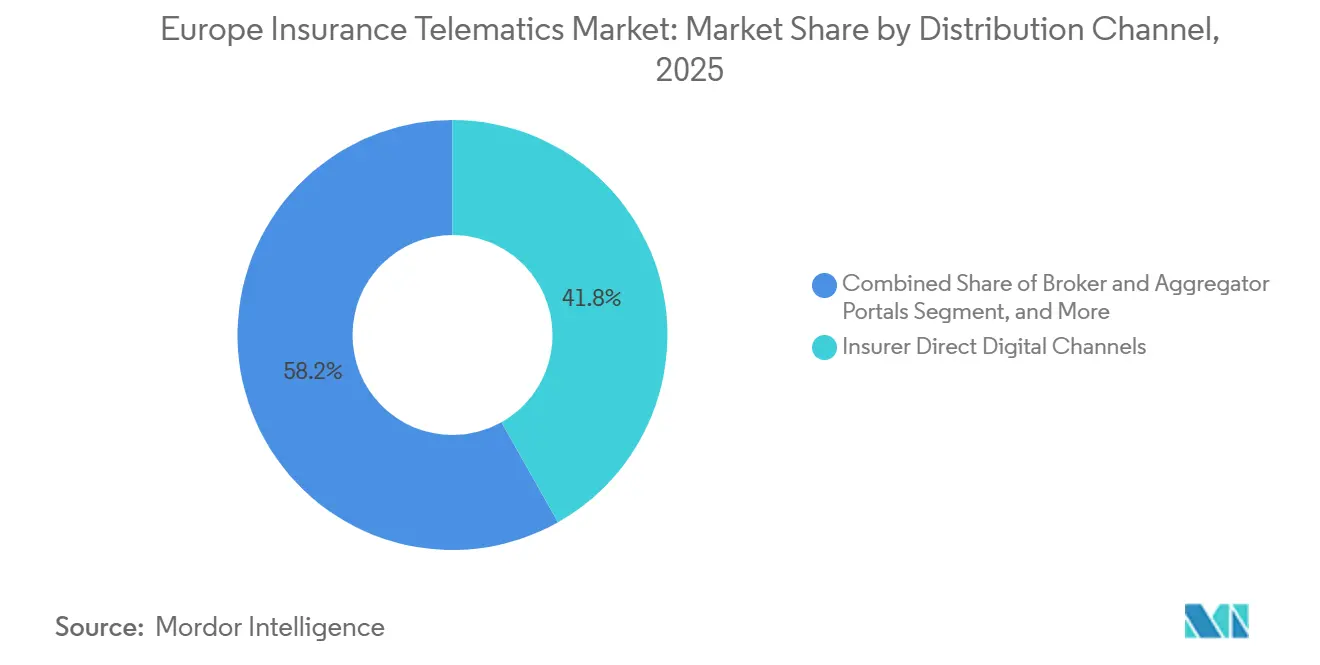
- By distribution channel, insurer direct digital remained largest at 41.84% in 2025 of Europe insurance telematics market, while OEM partnerships will climb at 24.66% CAGR through 2031.
- By country, Italy remained the largest at 32.84% in 2025 of Europe insurance telematics market, while Germany will climb at 24.98% CAGR through 2031.
Note: Market size and forecast figures in this report are generated using Mordor Intelligence’s proprietary estimation framework, updated with the latest available data and insights as of January 2026.
Market Trends and Insights
Drivers Impact Analysis of Europe Insurance Telematics Market*
| Driver | (~) % Impact on CAGR Forecast | Geographic Relevance | Impact Timeline |
|---|---|---|---|
| Rising Penetration of Embedded OEM Telematics in New-Vehicle Sales | +4.2% | Germany, France, United Kingdom, Italy | Medium term (2-4 years) |
| Rapid Scale-up of Smartphone-based UBI Solutions among Price-Sensitive Drivers | +3.8% | Spain, Poland, Czech Republic, Rest of Central and Eastern Europe | Short term (≤ 2 years) |
| EU eCall and Data-Access Regulations Catalysing Data Availability for Insurers | +4.5% | European Union-wide, strongest in Italy, Germany, France | Long term (≥ 4 years) |
| AI-Driven Claims Automation Reducing Loss Ratios and Fraud | +3.9% | United Kingdom, Germany, Netherlands, Sweden, Denmark | Medium term (2-4 years) |
| Demand for Eco-Driving and ESG-Linked Premium Discounts | +2.7% | Netherlands, Sweden, Denmark, Belgium, Switzerland, Austria | Medium term (2-4 years) |
| Emergence of Neutral Data Marketplaces Enabling Smaller Insurers | +2.1% | Spain, Poland, Czech Republic, Rest of Western Europe | Long term (≥ 4 years) |
| Source: Mordor Intelligence | |||
Rising Penetration of Embedded OEM Telematics in New-Vehicle Sales
Factory-installed telematics control units shipped in 4.2 million new European cars during 2025, allowing insurers to activate usage-based policies at the point of sale.[2]Stellantis N.V., “Stellantis and Wrisk Partner on Embedded Insurance Solutions,” stellantis.com Stellantis and Wrisk estimate 40% lower customer-acquisition cost from this embedded model, while BMW’s Qover partnership locks drivers into multi-year contracts that secure predictable premium income. Operational expenses drop by EUR 15-20 (USD 16.9-22.5) per policy once device-return logistics disappear, offsetting OEM data-access fees. Volkswagen disclosed that 68% of its 2025 deliveries carried embedded connectivity, signaling that telematics-ready vehicles will be standard before 2027.[3]Volkswagen Group, “Sustainability Report 2025: Connected Mobility,” volkswagenag.com
Rapid Scale-up of Smartphone-Based UBI Solutions Among Price-Sensitive Drivers
Smartphone-only telematics removes hardware subsidies, letting insurers bind policies within minutes. By Miles reported 22% higher retention than black-box equivalents in 2025 because drivers can pause coverage when their cars sit idle. Sentiance’s software kit detects harsh cornering and distraction with 92% accuracy, equaling dedicated devices at one-tenth cost. Spain and Poland doubled penetration to 14% in 2025 as younger demographics readily grant location permissions, easing working-capital burdens on insurers.
EU eCall and Data-Access Regulations Catalyzing Data Availability for Insurers
The European Commission mandated fair, reasonable, and non-discriminatory access to crash, odometer, and diagnostic feeds starting March 2024. Generali’s 2025 quick-quote tool in Belgium cut underwriting time from 48 hours to 12 minutes using OEM feeds. Application-programming-interface (API) openness lets platforms such as Octo’s Mobilisights aggregate multi-brand data, shrinking integration cycles for mid-tier carriers.
AI-Driven Claims Automation Reducing Loss Ratios and Fraud
Telematics-linked AI reconstructs low-speed collisions, settling 60-70% of cases without adjuster visits. Aviva’s MyDrive automation saved GBP 150-200 (USD 190-253) per file in 2025. Cambridge Mobile Telematics achieved 94% true-positive crash detection, shaving emergency response times and raising customer satisfaction by 18 points. Allianz reported 18% lower leakage, equating to EUR 120 million (USD 135 million) annual savings.
Restraints Impact Analysis of Europe Insurance Telematics Market*
| Restraint | (~) % Impact on CAGR Forecast | Geographic Relevance | Impact Timeline |
|---|---|---|---|
| GDPR-Driven Data-Privacy Compliance Costs | -2.3% | European Union-wide, highest in Germany, France, Netherlands | Short term (≤ 2 years) |
| Fragmented National Pricing and Taxation Rules Limiting Cross-Border Scalability | -1.8% | Multi-country operators, strongest impact in Spain, Italy, Belgium | Medium term (2-4 years) |
| Data-Quality Variability across Telematics Devices | -1.2% | Poland, Czech Republic, Rest of Central and Eastern Europe | Short term (≤ 2 years) |
| OEM-Insurer Bargaining Power Imbalance over Data Fees | -1.5% | Germany, United Kingdom, France, Italy | Long term (≥ 4 years) |
| Source: Mordor Intelligence | |||
GDPR-Driven Data-Privacy Compliance Costs
Explicit consent, double-opt-in mechanisms, and 30-day deletion requests raised 2025 compliance spending to EUR 2-5 million (USD 2.25-5.63 million) per mid-tier insurer, eroding underwriting margins by up to 60 basis points. Fines totaling EUR 8.3 million (USD 9.34 million) in Germany highlighted the penalty risk. Data-residency clauses force EU-only hosting, adding 25-35% to cloud bills, while human review rules for premium changes above 15% reduce automation upside.
Fragmented National Pricing and Taxation Rules Limiting Cross-Border Scalability
Member-state sovereignty over premium bands and insurance taxes slows regional rollouts. Re-filing a German pay-how-you-drive product in France can take up to 12 months, missing prime sales windows. Spain caps usage-based discounts at 30%, dampening telematics appeal, while Italy’s 12.5% stamp duty on device costs nudges customers toward smartphone solutions that avoid hardware levies.
*Our forecasts treat driver/restraint impacts as directional, not additive. The impact forecasts reflect baseline growth, mix effects, and variable interactions.
Europe Insurance Telematics Market Segment Analysis
By Usage-Based Insurance Type:
Coaching Models Gain TractionManage-how-you-drive policies are projected to be the fastest-growing component of the Europe insurance telematics market, expanding at 24.88% through 2031. The segment already reduced harsh-braking events by up to 25% within three months, unlocking deeper premium reductions that resonate with fleet managers chasing ESG targets. Pay-as-you-drive retained 46.73% revenue share in 2025 and dominates urban motorists under 8,000 kilometers annually. Mile-based products remain niche but flourish in the United Kingdom, thanks to By Miles’ pure-app offer. Allianz’s 2025 collaboration with Ticker showed that coaching features appeal to over-50 drivers once messaging shifts from surveillance to safer motoring. Regulatory shifts in France and Germany now permit monthly premium recalibration, accelerating adoption.
The wider behavioral pivot reflects insurers’ realization that exposure-hour metrics understate risk relative to micro-driving style. Fleet operators gravitate to driver-score dashboards that document duty-of-care compliance. Gamified rewards and cashback schemes pioneered by challenger brands like Ticker hint at future convergence between insurance and mobility-subscription services. In parallel, the Europe insurance telematics market size for mileage-only products will plateau as embedded OEM connectivity and AI scoring democratize behavior-based underwriting across mass-market segments.



By Telematics Technology:
Smartphone Solutions Challenge Hardware IncumbentsSmartphone-only products are forecast to outpace overall Europe insurance telematics market growth at 24.65% CAGR, capturing consumers drawn to zero-hardware onboarding. Black-boxes held 38.74% share in 2025 amid Italy’s legacy base, but subsidies of EUR 50-80 (USD 56.25-90) per policy mark a rising cost line as inflation hits components. OBD dongles show marginal gains, while embedded OEM units are scaling rapidly as connectivity becomes default. Hybrid tag-and-app architectures serve as a bridge, especially in dense urban corridors where Bluetooth beacons improve GPS fidelity.
Vodafone Automotive’s 2025 pivot toward software-defined services underscores the hardware margin squeeze. The Floow’s processing of 1.2 billion smartphone-kilometers monthly feeds 90-day premium refresh cycles that conventional annual renewals cannot match, reinforcing app-centric momentum. Europe insurance telematics market share advantages will increasingly hinge on algorithmic accuracy rather than device inventory, prompting incumbents to retool supply chains for software delivery.
By Vehicle Category:
Shared-Mobility Fleets Drive Fastest ExpansionShared-mobility fleets are set to contribute the quickest lift to Europe insurance telematics market size, climbing at 25.02% through 2031. Passenger cars still accounted for 54.63% of policies in 2025, yet ride-hail platforms embed telematics to negotiate dynamic group coverage and surcharge high-risk drivers. Light commercial vehicles leverage telematics for route optimization and liability defense, warranting premium discounts that reach double-digit percentages. Heavy commercial rigs add layers of usage-based pricing atop mandatory tachograph data, reinforcing compliance while cutting claims frequency.
Two-wheeler penetration sits in low single digits because smartphone sensors misclassify lean angles and vibration patterns, creating underwriting noise. Samsara’s 2025 partnership with Allianz showcases the growing demand for integrated dashcam and maintenance analytics across commercial segments. As e-commerce surges and city-center delivery windows condense, fleet insurers will use telematics to align premiums with real-time safety scores and vehicle-health indicators.
By Deployment Model:
Cloud Infrastructure DominatesCloud deployments captured 62.61% of Europe insurance telematics market in 2025 and will sustain a 25.33% CAGR trajectory. Elastic compute addresses terabyte-scale ingestion and AI model retraining, while sovereign-cloud zones satisfy data-residency mandates. On-premise installations persist among insurers with sunk investments, yet rising energy costs and new processor upgrades tilt the cost-benefit calculus toward hyperscalers. Generali’s Belgian quick-quote engine, built on cloud APIs, illustrates latency and conversion gains that legacy data centers cannot match.
Microsoft Azure, Amazon Web Services, and Google Cloud added EU sovereign regions in 2025, lowering legal risk for mid-tier carriers. Cloud-native microservices also accelerate time-to-market: replicating instance images across regions trims launch cycles from quarters to weeks. Consequently, Europe insurance telematics market participants focused on on-premise deployments risk slower innovation and higher operating expenses.
By Distribution Channel:
OEM Partnerships Reshape Customer AcquisitionOEM channels are projected to be the fastest-growing route to market, rising at 24.66% CAGR. BMW’s 2025 Irish rollout with Qover achieved 42% attachment at vehicle finance close, proving point-of-sale potency. Digital direct still dominated at 41.84% of 2025 distribution but faces increasing ad-cost inflation and lower differentiation as comparison sites commoditize quotes. Broker and aggregator portals lag due to difficulty integrating dynamic telematics data, though API upgrades are underway.
White-label platforms like Octo and The Floow act as distribution plumbing for mid-size insurers that lack cloud and data-science resources. Bancassurance and retail partnerships add niche volume, yet misaligned incentives restrict scale. Car-maker embedded connectivity reshapes bargaining power: insurers without OEM ties encounter rising acquisition costs and risk demographic drift toward older, lower-value customers.
Geography Analysis
Italy and Germany Insurance Telematics Market
Italy remained the largest regional contributor with 32.84% of Europe insurance telematics market revenue in 2025. Penetration neared 22% of private-car policies, but growth is moderating as addressable first-time adopters dwindle. Recurring subscription revenues and adjacent stolen-vehicle services maintain profitability. Germany shows the region’s highest projected rate at 24.98% CAGR through 2031, propelled by Allianz and AXA smartphone offers and a 68% factory-fit connectivity ratio disclosed by Volkswagen in 2025.
Broader European Markets
The United Kingdom holds an estimated 18% penetration anchored by Admiral, The Floow, and By Miles. France, Spain, and the Netherlands post mid-teens growth as insurers port proven Italian models, while Nordic countries accelerate eco-driving adoption under ambitious climate targets. Poland and Czech Republic exceed 25% growth through affordable app-only propositions aimed at young drivers. Switzerland and Austria display elevated commercial-fleet uptake tied to strict liability statutes, whereas Belgium’s linguistic and tax fragmentation slows household adoption despite Generali’s fast-quote cloud launch.
Regulatory Landscape
The Europe insurance telematics market operates under a layered EU framework that combines vehicle-data access rights with strict privacy rules. Regulation (EU) 2023/2854 (the EU Data Act) sets rules for access to data generated by connected products such as vehicles, enabling users to share that data with third parties under FRAND terms. The European Commission also supplemented this with vehicle-data guidance released in September 2025, clarifying how automotive stakeholders, including insurers, should implement the Data Act.
On the privacy side, GDPR and the ePrivacy Directive (Directive 2002/58/EC) govern processing of personal data and access to information on vehicle terminal equipment. European Data Protection Board (EDPB) guidance on connected vehicles reinforces consent and data-minimization expectations for mobility data, which increases compliance demands for telematics-driven underwriting and claims workflows and raises the operational weight of privacy-by-design scoring and EU-only data residency where required.
Value Chain Analysis
The value chain runs from data generation (vehicle sensors, smartphones, dashcams and embedded OEM telematics) to connectivity (mobile network operators), then to data aggregation and analytics (telematics service providers and AI scoring vendors), and finally to insurance product design and pricing. Distribution follows through insurer-direct digital, brokers/aggregators, and OEM embedded channels, and the flow ends at claims and roadside response. In Europe, established telematics ecosystems include insurers such as Generali, Allianz and AXA working with platforms such as Octo, The Floow and Cambridge Mobile Telematics. The supply-side mix is also shifting as OEM data feeds and app-only telemetry reduce dependence on black-box installation and reverse-logistics.
Value capture is increasingly concentrated in the data-access and analytics layers, where integration effort, data quality, and governance shape insurer performance. EU rules influence operating steps across the chain: the ePrivacy framework restricts how in-vehicle data is accessed, the EDPB positions explicit user consent as central to connected-vehicle data processing, and the EU Data Act creates a more formal route for insurers to obtain vehicle-generated data from data holders under defined terms. This pushes more activity toward standardized APIs, cloud ingestion, and third-party marketplaces rather than proprietary device-led models.
Competitive Landscape
The five leading providers control about most of regional revenue, evidencing a moderately concentrated arena. OEM integration reshapes value capture as Stellantis, BMW, and Volkswagen monetize data streams directly, forcing insurers to compete on algorithmic precision rather than exclusive access. Technology vendors, such as Cambridge Mobile Telematics and DriveQuant, lower entry barriers by licensing AI risk engines, shifting the competitive focus toward brand trust, distribution reach, and customer experience.
Disruptors By Miles, Ticker, and Wrisk target urban millennials with pay-per-mile pricing and instant smartphone onboarding. Octo’s 2025 neutral-data platform, with Mobilisights, underscores the pivot from device sales to standardized data marketplaces, thereby diluting legacy carrier advantages. Patent filings rose 34% year-over-year, as incumbents and challengers race to secure intellectual property related to claims automation and dynamic pricing. GDPR compliance costs weigh heavier on sub-scale insurers, accelerating partnerships or exits.
Europe Insurance Telematics Industry Leaders
Unipolsai Assicurazioni S.P.A.
Octo Group S.P.A .
AXA S.A.
LexisNexis Risk Solutions Group
Towergate Insurance
- *Disclaimer: Major Players sorted in no particular order
Europe Insurance Telematics Market Companies Covered in this Report
- UnipolSai Assicurazioni
- Octo Group S.p.A.
- Allianz SE
- AXA S.A.
- Admiral Group plc
- Targa Telematics
- The Floow Limited
- Vodafone Automotive S.p.A.
- Viasat Group
- Towergate Insurance
- IMS (Insurance and Mobility Solutions)
- LexisNexis Risk Solutions
- Cambridge Mobile Telematics
- Generali Group
- Sentiance NV
- Redtail Telematics
- By Miles Ltd.
- Agero, Inc.
- Otonomo Technologies Ltd.
- Scope Technologies
- Telepass

Market Opportunities and Future Outlook
Embedded and OEM-data-led insurance distribution is creating new whitespace in Europe as insurers and intermediaries plug into manufacturer data platforms at point of sale and during ownership. June 2026 provides an example of this shift, with Ageas UK partnering with Wrisk to deliver embedded motor insurance integrated with vehicle manufacturer data platforms. February 2026 also showed how integration is moving into insurer scoring, when IMS connected Volkswagen vehicle sensor data (via High Mobility) to pay-how-you-drive scoring for insurers, reducing reliance on aftermarket hardware and speeding onboarding.
The opportunity set expands further around AI risk scoring and claims automation as capital and partnerships concentrate on telematics-grade analytics. In March 2026, Allianz X and TPG led a USD 350 million strategic investment in Cambridge Mobile Telematics to scale road-safety platforms and advance AI models for risk assessment, strengthening vendor capacity for higher-frequency pricing refresh, crash detection, and fraud controls across Europe. These steps track the EU Data Act implementation cycle and vehicle-data guidance, which together improve practical availability of connected-vehicle data for insurers that can meet GDPR and ePrivacy design requirements.
Recent Industry Developments in Europe Insurance Telematics Market
- June 2026: AXA XL partnered with Samsara in the UK to incorporate Samsara's Connected Operations platform into AXA XL risk solutions for fleets. The tie-up supports continuous safety monitoring and risk mitigation using real-time telemetry, reinforcing fleet-focused telematics insurance propositions where claims prevention and loss control are central.
- May 2026: Octo partnered with Sedgwick to integrate telematics data into claims management workflows, emphasizing automated crash detection, fraud reduction, and liability assessment. The collaboration strengthens the linkage between driving-event data and downstream claims outcomes, raising the value of standardized event reconstruction across multi-insurer portfolios.
- May 2024: UnipolSai reported continued execution on its telematics-driven motor insurance approach within its broader portfolio update for the period. The disclosure points to the persistence of Italy's large installed base and the role of connected services in customer retention and ancillary offerings tied to motor policies.


Europe Insurance Telematics Market Report Scope and Research Methodology
Market Definition and Coverage
For this study, the Europe insurance telematics market is defined as the revenue earned from telematics-enabled insurance programs where driving or vehicle data is used to price, manage, or service motor insurance policies across European countries.
Scope exclusions: We exclude general fleet tracking sold for non-insurance use cases, and we also exclude the core insurance premium value that is not directly tied to telematics service revenue.
Segments Covered in This Report
- By Usage-Based Insurance Type
- Pay-As-You-Drive (PAYD)
- Pay-How-You-Drive (PHYD)
- Manage-How-You-Drive (MHYD)
- Mile-Based Insurance
- Reward-Based Models
- By Telematics Technology
- Black Box Device
- OBD Dongle
- Smartphone-Only
- Embedded OEM Unit
- Hybrid Tag and App
- Dashcam-Centric
- By Vehicle Category
- Passenger Cars
- Light Commercial Vehicles
- Heavy Commercial Vehicles
- Two-Wheelers
- Shared-Mobility Fleets
- By Deployment Model
- Cloud-Based
- On-Premise
- By Distribution Channel
- Insurer Direct Digital Channels
- Broker and Aggregator Portals
- OEM Insurance Partnerships
- Third-Party Telematics Providers
- Bancassurance and Retail Partners
- By Country
- Italy
- United Kingdom
- Germany
- France
- Spain
- Netherlands
- Sweden
- Denmark
- Belgium
- Switzerland
- Austria
- Poland
- Czech Republic
- Rest of Western Europe
- Rest of Central and Eastern Europe
Data Sources, Market Sizing, and Validation
Desk Research
Desk research was used to set the boundaries of what should be counted as insurance telematics revenue in Europe, and to collect baseline indicators for how fast usage-based programs are being adopted. We relied on public and official sources such as the European Commission mobility and road safety publications, EEA transport datasets, national transport authorities, and regulator or supervisor websites that publish motor insurance and market notes, since the country-level context in Europe varies substantially.
In parallel, we reviewed company annual reports, investor decks, and press releases to map commercial models that affect revenue recognition, for example device bundles versus app-only programs, and the contract structures used with insurers. We also used a small set of paid subscriptions for company financials and news where public filings were thin, and we checked patent databases to see which driving behavior scoring technologies companies are actively filing. The desk sources listed here are illustrative, and other public documents and datasets were also used during data collection, validation, and assumption clarification.
Primary Interviews and Surveys
Primary work focused on interviews and short surveys with insurers, telematics service providers, and automotive connectivity stakeholders who see program economics first-hand. We used these discussions to confirm what is typically priced as a per-policy or per-vehicle fee, how smartphone versus device-based mixes are shifting, and what adoption hurdles show up across major European markets, then cross-checked the resulting totals where desk research alone was less detailed.
Distribution of primary research fieldwork respondents
| Company type | Respondent position |
|---|---|
| Top tier: 34% | CXOs: 15% |
| Mid tier: 47% | Functional/Unit leaders: 41% |
| Smaller Players: 19% | Managers: 44% |
Market-Sizing & Forecasting
Sizing starts with a top-down build that reconstructs the demand pool from insured vehicle and policy volumes, and then applies telematics program penetration and serviceable pricing to arrive at market value by country and roll it up to Europe. To keep the model practical, we used a limited set of measurable inputs, then pressure-tested the totals with selective bottom-up checks such as sampled provider revenues, channel checks on typical fee ranges, and volume times ASP snapshots where public evidence was available.
The main inputs that shape the market include the share of motor policies offered with usage-based options, the installed base of active telematics policies, the split of smartphone-led versus device-led programs, average monthly fees charged to insurers or policyholders, and churn or discontinuation rates that change active policy counts. Because Europe has large cross-country differences, the model also tracks country mix shifts, regulatory and privacy constraints that affect opt-in, and the pace of connected car data access arrangements that can change unit economics. For forecasting, we used scenario analysis where adoption and ASP paths were adjusted using consensus ranges gathered from interviews, then mapped to macro signals such as new vehicle connectivity and insurance digitization trends.
Where bottom-up visibility is incomplete, we fill gaps by using conservative fee bands and adoption ranges anchored to the closest comparable country program structures, followed by reconciliation back to the top-down demand pool so the final number remains internally consistent.
Data Validation & Update Cycle
Validation is done through triangulation across independent signals, where market totals are compared against policy-in-force references, provider revenue direction, and observable program launches and expansions. Any outliers, such as a country result that implies an unrealistic fee per active policy, are flagged and rechecked through another pass of assumptions, then reviewed within the team before sign-off.
The report is refreshed annually, and interim updates are triggered when material events occur, such as major pricing model changes, regulatory shifts, or step-changes in device versus smartphone mix. Before delivery, we run a final review so the latest currency timing, inflation effects on fees, and new disclosures are reflected in the published view.
Mordor Intelligence's Europe Insurance Telematics Market Size Compared Against Other Published Estimates
Published market sizes for Europe insurance telematics can look far apart even when the topic label sounds similar, because the counted revenue lines and the timing assumptions are not always aligned. Differences usually come from how programs are defined (service revenue versus premium value), the year used for exchange rates, and whether the model treats smartphone-led programs as low-ASP mass adoption or keeps legacy device economics for longer.
In this report, we kept the market tied to active telematics policies and recurring service fees, and we tightened the refresh cadence on ASP and currency timing so step-changes in program mix get reflected sooner, a modeling choice applied by Mordor Intelligence.
Benchmark comparison
| Source | Market Size | Gaps in Research Methodology |
|---|---|---|
| Mordor Intelligence | USD 1.20 B (2026) | |
| Industry Publisher A | USD 4.60 B (2025) | This figure aligns closer to usage-based insurance value pools and can partially reflect premium-related economics, which inflates the total versus a telematics service revenue-only view. It also uses a different base year, so currency conversion timing and adoption assumptions are not directly comparable to a 2026 starting point. |
| Trade Brief B | USD 4.10 B (2023) | The estimate appears to lean on policy counts and program announcements without fully separating smartphone programs priced at low monthly fees from device-led contracts priced higher. The year is earlier, and without a consistent ASP update method, results can stay anchored to older price points even as the market mix shifts. |
Taken together, the spread is mainly explained by what gets counted and when the pricing and FX assumptions are refreshed. Our approach stays traceable because the calculation can be walked back to active policy volumes, realistic fee bands, and country mix, and then checked against independent demand signals before the final total is published.


Key Questions Answered in the Report
How large is the Europe insurance telematics market today?
The market reached USD 1.2 billion in 2026 and is on track to hit USD 3.53 billion by 2031.
What CAGR is expected for usage-based insurance in Europe?
Overall market CAGR stands at 24.08% for 2026-2031, with manage-how-you-drive policies growing slightly faster at 24.88%.
Which technology segment is gaining fastest traction?
Smartphone-only telematics solutions are accelerating at 24.65% CAGR as they eliminate hardware costs and enable instant onboarding.
Why are OEM partnerships important for insurers?
Embedded insurance at vehicle sale captures customers before they reach comparison sites, delivering 40% lower acquisition costs and high attachment rates.
What role does GDPR play in telematics adoption?
GDPR mandates explicit consent, data residency, and human review for large premium adjustments, adding EUR 2-5 million compliance costs per mid-tier insurer and shaping data-management strategies.
Page last updated on:


 Your data is secure and never sold or shared.


