Semantic Layer And Knowledge Graph For Agentic AI Market Size and Share
Market Overview
| Study Period | 2019 - 2030 |
|---|---|
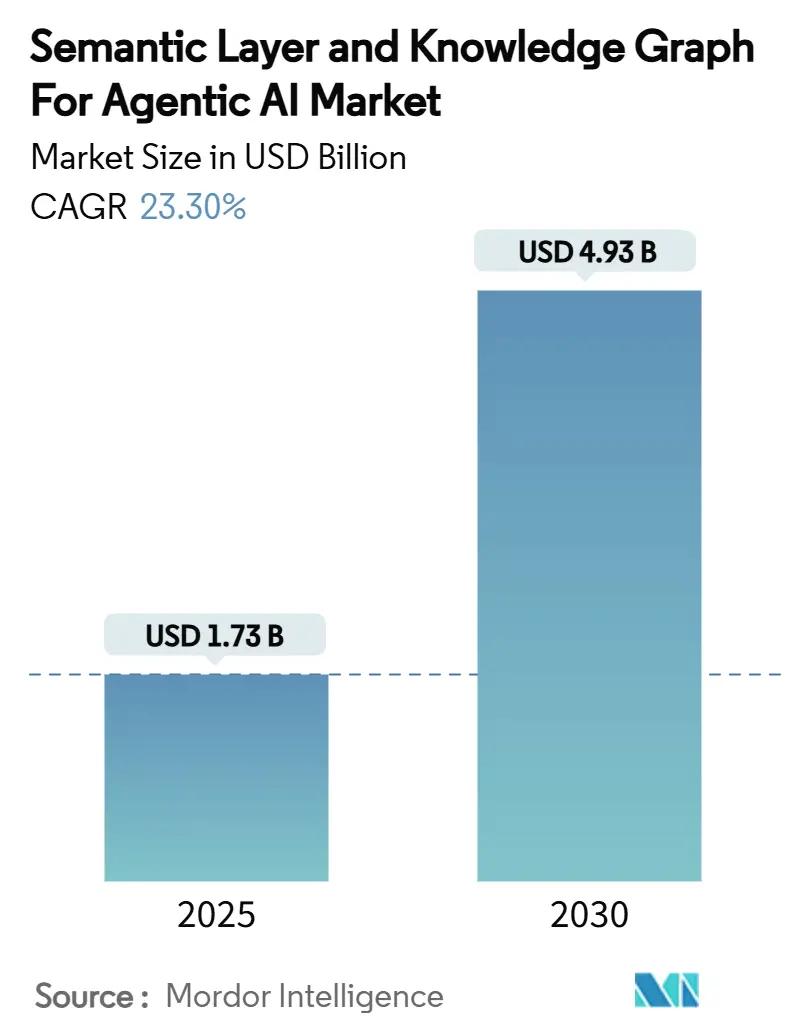
| Market Size (2025) | USD 1.73 Billion |
| Market Size (2030) | USD 4.93 Billion |
| Growth Rate (2025 - 2030) | 23.30% CAGR |
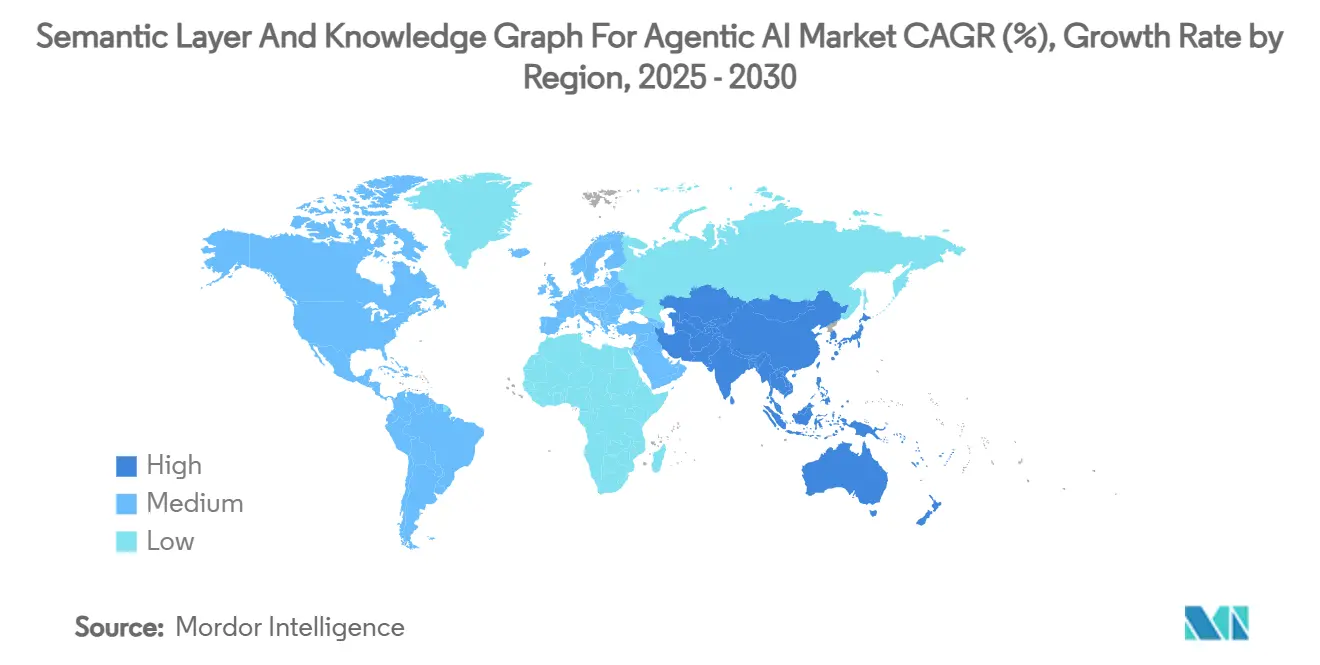
| Fastest Growing Market | North America |
| Largest Market | Asia Pacific |
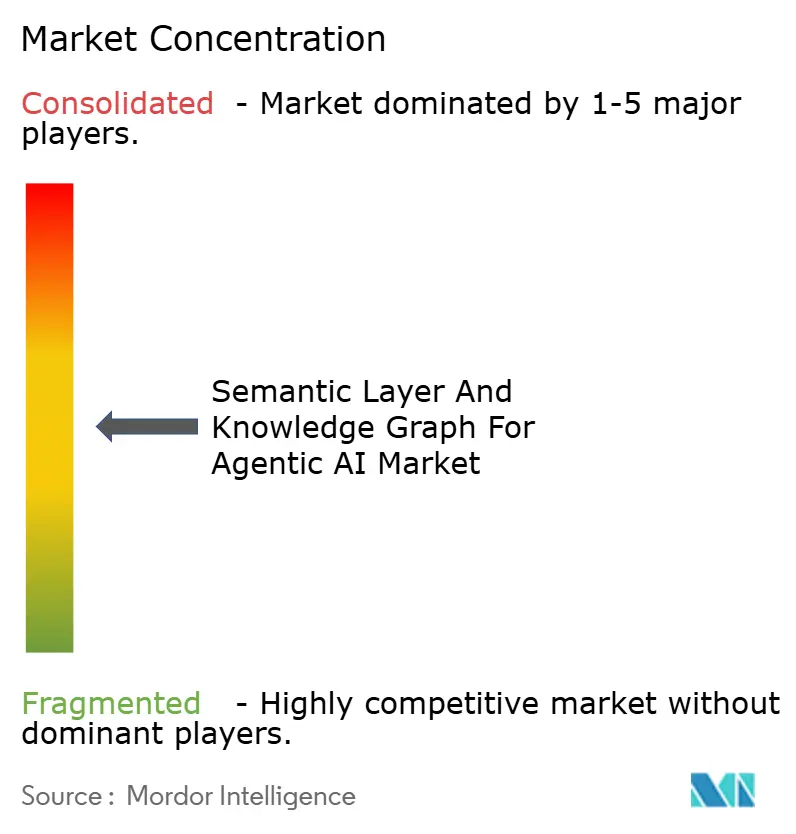
| Market Concentration | Medium |
Major Players *Disclaimer: Major Players sorted in no particular order Image © Mordor Intelligence. Reuse requires attribution under CC BY 4.0. | |
Semantic Layer And Knowledge Graph For Agentic AI Market Analysis by Mordor Intelligence
The semantic layer and knowledge graph in agentic AI market size stood at USD 1.73 billion in 2025, and it is forecast to climb to USD 4.93 billion by 2030 through a 23.30% CAGR. Capital inflows from both public and private sectors accelerate adoption because autonomous agents deliver measurable productivity gains when they are grounded in a structured, machine-readable context. Defense contracts worth USD 200 million each to Anthropic, Google, and xAI in 2024 have reinforced confidence that semantic layers are now mission-critical for high-stakes decision automation. Enterprise buyers increasingly favor integrated platforms over point tools, prompting vendors to bundle graph databases, ontology managers, and reasoning engines into a unified stack. Cloud-native deployment dominates because pay-as-you-go economics shorten time to value and eliminate the need for specialized database administration. Early movers also report faster innovation cycles when knowledge graphs serve as shared context stores for multi-agent orchestration.
Key Report Takeaways
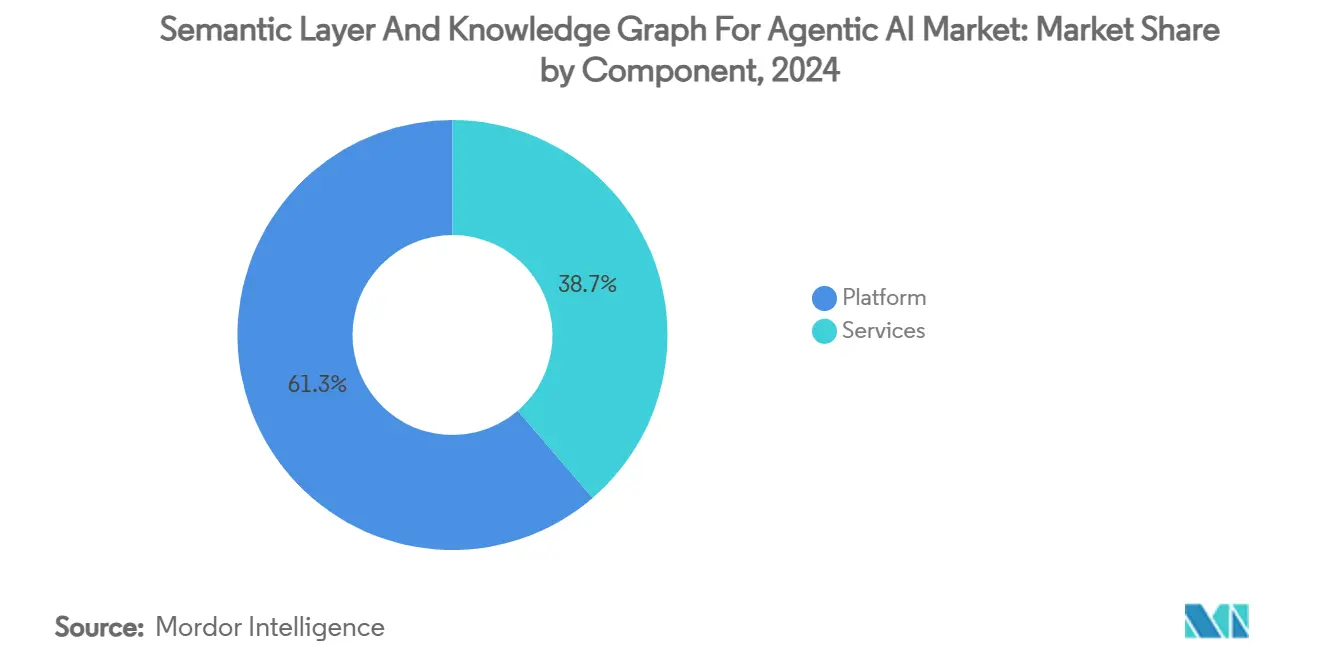
- By component, platform solutions held 61.3% of the semantic layer and knowledge graph in agentic AI market share in 2024.
- By deployment model, the cloud segment accounted for a 57.8% share of the semantic layer and knowledge graph in agentic AI market size in 2024 and is advancing at a 24.9% CAGR through 2030.
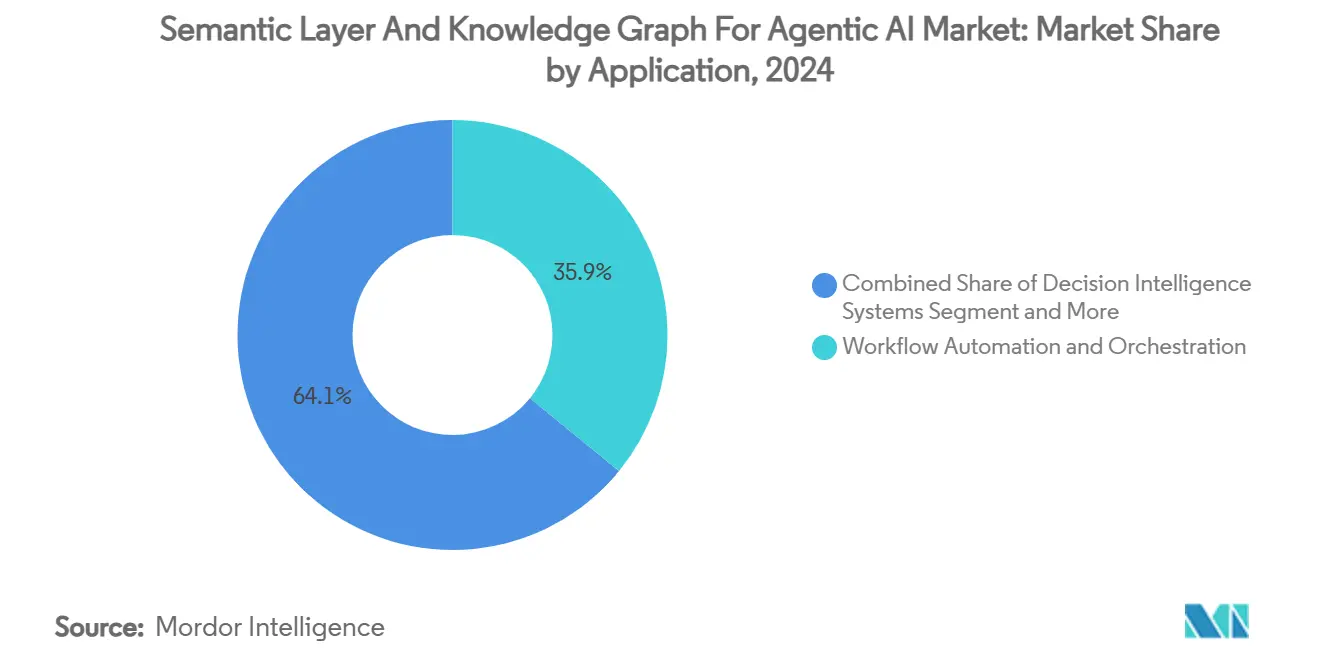
- By application, workflow automation led with 35.9% revenue share in 2024; autonomous agents and robotics are projected to expand at a 25.1% CAGR to 2030.
- By end-user industry, BFSI captured a 27.3% share in 2024, while healthcare is set to grow at a 24.5% CAGR.
- By geography, North America commanded a 42.1% share in 2024; the Asia Pacific region records the highest projected CAGR at 24.2% through 2030.
Global Semantic Layer And Knowledge Graph For Agentic AI Market Trends and Insights
Drivers Impact Analysis*
| Driver | (~) % Impact on CAGR Forecast | Geographic Relevance | Impact Timeline |
|---|---|---|---|
| Rapid adoption of LLM-powered autonomous agents | +6.2% | Global, with North America and EU leading | Medium term (2-4 years) |
| Need for explainable AI and governance frameworks | +4.8% | Global, regulatory focus in EU and North America | Long term (≥ 4 years) |
| Explosion of multi-modal data requiring semantic integration | +5.1% | Global, with Asia-Pacific manufacturing emphasis | Medium term (2-4 years) |
| Cloud-native graph databases lowering entry barriers | +3.7% | Global, with cloud-first regions leading | Short term (≤ 2 years) |
| Emergence of neuro-symbolic AI needing knowledge graphs | +2.9% | North America and EU research hubs | Long term (≥ 4 years) |
| Internal developer platforms embedding semantic layers "as-a-service" | +2.1% | Global, enterprise-focused regions | Medium term (2-4 years) |
| Source: Mordor Intelligence | |||
Rapid Adoption of LLM-Powered Autonomous Agents
Enterprises rolling out large-language-model agents now view structured context as mandatory for consistent task execution. Neo4j’s Graphiti framework, introduced in 2024, maintains a temporal knowledge graph so every interaction is anchored to an evolving state store. [1]Neo4j, “Graphiti: Temporal Knowledge Graphs for Agentic AI,” neo4j.com Microsoft’s autonomous SAP agents follow a similar blueprint, mapping transaction logic onto domain ontologies to avoid drift when processes span multiple systems. The transition from reactive chatbots to proactive agents has shifted budgets toward persistent semantic layers that capture causal and temporal dependencies. Companies deploying these agents report lower error rates and faster hand-off to downstream systems, reinforcing the driver’s positive growth impact.
Need for Explainable AI and Governance Frameworks
The EU AI Act mandates auditable decision pathways, and comparable rules from US regulators are on the horizon.[2]Frontiers in Artificial Intelligence, “LLM Explanation Standards,” frontiersin.org Knowledge graphs enable line-of-sight from input data to model output, giving legal and risk teams a shared evidence chain. Deutsche Bank’s 2024 GenAI program placed semantic tracing at the core of its risk analytics stack, demonstrating that financial institutions are treating graph lineage as a compliance control rather than an IT choice. As regulators fine-tune enforcement guidance, organizations adopt semantic layers pre-emptively to avoid future retrofits, making this driver a long-run catalyst.
Explosion of Multi-Modal Data Requiring Semantic Integration
Industry 4.0 plants combine vision feeds, IoT telemetry, and historical maintenance logs. Siemens has shown that unifying these modalities in a knowledge graph cuts downtime by surfacing hidden failure patterns across assets. [3]Siemens, “Smart Manufacturing Knowledge Graphs,” siemens.com Data lakes do not expose entity relationships, so predictive agents struggle to correlate sensor anomalies with maintenance schedules. Manufacturers, therefore, channel capital toward semantic infrastructure that scales horizontally across plant networks. This effect is most visible in the Asia Pacific, where electronics assemblers deploy edge-resident micro-graphs for in-line quality control.
Cloud-Native Graph Databases Lowering Entry Barriers
Amazon Neptune Serverless provisions capacity on demand, freeing mid-size firms from up-front hardware spending. TigerGraph’s cloud services run graph algorithms 10-100 times faster than legacy systems without DBA oversight. Competitive price points allow proof-of-concept pilots to start small and expand incrementally, enlarging the total addressable market. As a result, cloud availability converts latent interest into paid adoption within months rather than years, accelerating near-term growth.
Restraints Impact Analysis*
| Restraint | (~) % Impact on CAGR Forecast | Geographic Relevance | Impact Timeline |
|---|---|---|---|
| Data silos and integration complexity | -3.4% | Global, legacy enterprise focus | Medium term (2-4 years) |
| Scarcity and cost of ontology/knowledge-engineering talent | -2.8% | Global, acute in emerging markets | Long term (≥ 4 years) |
| Lack of standard benchmarks and ROI metrics | -1.9% | Global, enterprise adoption focus | Short term (≤ 2 years) |
| Real-time latency constraints for agentic orchestration | -1.6% | Global, edge computing emphasis | Medium term (2-4 years) |
| Source: Mordor Intelligence | |||
Data Silos and Integration Complexity
Most large firms still operate hundreds of isolated databases, many without modern APIs. Converting them into unified semantic models demands exhaustive mapping, cleansing, and governance. Ontotext notes that integration consumes 40–60% of knowledge-graph budgets and can stretch implementation timelines beyond initial estimates. Delays reduce executive patience, slowing rollouts despite clear strategic value. Companies often stage projects by domain to limit scope, but fragmentation persists until a critical mass of systems is integrated.
Scarcity and Cost of Ontology/Knowledge-Engineering Talent
Academic programs graduate too few specialists versed in description logic and domain modeling. Median salaries now top USD 200,000 in major tech hubs, putting pressure on IT budgets and service-provider margins. Emerging markets feel the pinch more acutely because local talent pools are shallow, raising project risk when external consultants rotate off. This human-capital bottleneck depresses adoption velocity, especially outside leading economies.
*Our forecasts treat driver/restraint impacts as directional, not additive. The impact forecasts reflect baseline growth, mix effects, and variable interactions.
Segment Analysis
By Component: Integrated Platforms Yield Operational Simplicity
Platform offerings dominated revenue in 2024, with a 61.3% semantic layer and knowledge graph in the agentic AI market share, as buyers opted for single-vendor stacks that include storage, reasoning, and visualization. The semantic layer and knowledge graph in the agentic AI market size for services is expected to grow at a 23.6% CAGR to 2030 because platform rollouts create follow-on demand for ontology refinement and performance tuning. Vendors such as Stardog highlight ROI studies showing USD 9.86 million in net benefits over three years once unified virtualization is in place. Implementation partners then monetize ongoing optimization, forming a self-reinforcing services loop.
Second-generation platforms embed ML-driven schema induction that accelerates onboarding of new domains. However, full automation remains aspirational, ensuring that managed service providers continue to capture value from manual curation tasks. Over time, platform providers will integrate low-code toolkits so business analysts can extend taxonomies without writing SPARQL, a shift that could reshape the services revenue mix after 2028.


By Deployment Mode: Cloud Flexibility Outpaces On-Premise Control
Cloud environments represented 57.8% of 2024 revenue and are growing faster than any other deployment class. Firms cite elastic scaling and global availability as core benefits, especially when agents must access the same knowledge base from multiple regions. Meanwhile, on-premise installations persist in the public sector and highly regulated verticals where data residency rules are strict. Hybrid topologies bridge both worlds by syncing sensitive triples locally while pushing non-confidential context to the cloud. Vendors now ship managed connectors that keep graphs consistent across boundary lines, neutralizing one of the main objections to off-premise adoption.
Operating-expense accounting also favors cloud subscriptions because teams can start with experimental pilots and expand monthly. CFOs view this spend as variable, supporting agile budgeting. Conversely, capital expenditures on physical clusters are approved only for long-horizon programs. As cloud unit costs fall, new entrants with limited cash reserves gain access to enterprise-grade graph services, broadening geographic penetration.
By Application: Workflow Automation Leads, Autonomous Systems Accelerate
Workflow automation commanded 35.9% of 2024 revenue as enterprises linked process graphs to RPA bots and business-rule engines. Finance, HR, and procurement teams use the semantic layer to harmonize data across transaction systems, removing reconciliation effort. Autonomous agents and robotics remain smaller today but carry a 25.1% CAGR because manufacturing and logistics operators allocate fresh capital to self-optimizing production lines. Digital twin initiatives also rely on these same graphs, ensuring that the semantic layer and knowledge graph in the agentic AI market size expand in tandem with physical automation budgets.
Decision-intelligence engines gain traction where compliance mandates precise rule tracing. Knowledge graphs allow models to reason over explicit constraints, and this attribute resonates with lenders and insurers. Personalized assistants exploit relationship graphs to deliver context-aware employee help-desk support, yet revenue contribution is still niche. Nevertheless, cross-application synergy means the same graph can serve multiple workloads, improving ROI for early adopters.

By End-User Industry: BFSI Sets Benchmark, Healthcare Surges
BFSI entities held 27.3% of total spend in 2024 because regulatory reporting and risk analytics require auditable data lineage. The semantic layer and knowledge graph in agentic AI market size tied to healthcare will expand rapidly at 24.5% CAGR as hospitals deploy clinical-decision agents that integrate imaging, EHR, and genomic data streams. Manufacturing ranks third due to predictive maintenance and smart-factory programs. Retail and e-commerce use semantic recommendations to increase cart size, though revenue remains moderate relative to banking. Government agencies fund intelligence-analysis graphs, often built in classified networks, sustaining a baseline of sovereign demand regardless of economic cycles.
Geography Analysis
North America accounted for 42.1% of 2024 global value, supported by venture capital and defense procurement that validate technology maturity. North America continues to lead in absolute revenue because federal contracts and private venture funding keep the innovation flywheel spinning. Defense agencies spend aggressively on explainable autonomous systems, while Silicon Valley startups commercialize research breakthroughs at a rapid pace. Financial institutions also account for a sizable portion of spend because semantic audit trails satisfy stringent reporting statutes. The region benefits from a deep pool of ontology engineers and a dense network of managed-service partners that accelerate time to production.
Asia Pacific, by contrast, is the clear growth engine. Governments in China, Japan, and South Korea prioritize local graph ecosystems to curb foreign dependency. Electronics and automotive manufacturers retrofit plants with sensor networks that feed edge-resident knowledge graphs, enabling real-time control loops. India’s IT-services firms package graph expertise into exportable offerings, further widening regional skill availability. These combined dynamics underpin the 24.2% forecast CAGR.

Competitive Landscape
Market concentration is moderate. Neo4j remains the revenue leader thanks to its mature graph store, wide connector library, and large developer community. Amazon, Microsoft, and Google press their advantage by bundling managed graph databases and generative-AI toolchains within existing hyperscale relationships, compressing sales cycles. Specialized vendors such as Stardog and Ontotext carve out space through domain-specific reasoning and virtualization features that large clouds do not yet replicate.
TigerGraph differentiates on low-latency analytics for streaming workloads, attracting manufacturers and fintechs with millisecond response requirements. ArangoDB competes via multi-model flexibility, supporting both document and graph queries in a single engine that simplifies stack complexity for mixed-workload enterprises. RelationalAI and Diffbot concentrate on automated schema generation, reducing onboarding friction for data teams lacking formal ontology expertise.
Strategic partnerships shape vendor positioning. Neo4j aligns with Microsoft to integrate graph connectors into Azure OpenAI services, making it easier for customers to augment GPT models with knowledge graphs. Google Vertex AI plugs into its managed Neptune-equivalent, encouraging developers to build agentic workflows within a single console. IBM extends its AI governance suite by weaving Watson Knowledge Catalog into broader compliance frameworks, courting highly regulated industries.
Semantic Layer And Knowledge Graph For Agentic AI Industry Leaders
Neo4j
Stardog
Ontotext
Cambridge Semantics
TigerGraph
- *Disclaimer: Major Players sorted in no particular order

Recent Industry Developments
- January 2025: WisdomAI launched with USD 23 million in funding to integrate reasoning agents and knowledge fabric technology into enterprise BI stacks.
- November 2024: PuppyGraph raised USD 5 million to accelerate its engine that converts relational data into unified graph models.
- June 2024: Illumex secured USD 13 million to automate semantic layer creation for governed generative AI.
- April 2024: Neo4j partnered with Microsoft to embed graph databases into generative-AI workflows.


Global Semantic Layer And Knowledge Graph For Agentic AI Market Report Scope
| Platform |
| Services |
| On-Premise |
| Cloud-based |
| Autonomous Agents and Robotics |
| Digital Twins and Simulation |
| Workflow Automation and Orchestration |
| Decision Intelligence Systems |
| Personalized Assistants |
| BFSI |
| Healthcare |
| Manufacturing and Industry 4.0 |
| Retail and E-commerce |
| Government and Defense |
| Telecom and Media |
| North America | United States | |
| Canada | ||
| Mexico | ||
| South America | Brazil | |
| Argentina | ||
| Rest of South America | ||
| Europe | Germany | |
| United Kingdom | ||
| France | ||
| Russia | ||
| Rest of Europe | ||
| Asia-Pacific | China | |
| Japan | ||
| India | ||
| South Korea | ||
| Rest of Asia-Pacific | ||
| Middle East and Africa | Middle East | Saudi Arabia |
| UAE | ||
| Turkey | ||
| Rest of Middle East | ||
| Africa | South Africa | |
| Nigeria | ||
| Rest of Africa | ||
| By Component | Platform | ||
| Services | |||
| By Deployment Mode | On-Premise | ||
| Cloud-based | |||
| By Application | Autonomous Agents and Robotics | ||
| Digital Twins and Simulation | |||
| Workflow Automation and Orchestration | |||
| Decision Intelligence Systems | |||
| Personalized Assistants | |||
| By End-User Industry | BFSI | ||
| Healthcare | |||
| Manufacturing and Industry 4.0 | |||
| Retail and E-commerce | |||
| Government and Defense | |||
| Telecom and Media | |||
| By Geography | North America | United States | |
| Canada | |||
| Mexico | |||
| South America | Brazil | ||
| Argentina | |||
| Rest of South America | |||
| Europe | Germany | ||
| United Kingdom | |||
| France | |||
| Russia | |||
| Rest of Europe | |||
| Asia-Pacific | China | ||
| Japan | |||
| India | |||
| South Korea | |||
| Rest of Asia-Pacific | |||
| Middle East and Africa | Middle East | Saudi Arabia | |
| UAE | |||
| Turkey | |||
| Rest of Middle East | |||
| Africa | South Africa | ||
| Nigeria | |||
| Rest of Africa | |||


Key Questions Answered in the Report
What is driving the sharp CAGR in the semantic layer and knowledge graph in agentic AI market?
Enterprise demand for autonomous agents that deliver auditable, context-aware decisions is the primary catalyst, with regulatory pressure for explainable AI and the rise of cloud-native graph services acting as accelerants.
Which segment holds the largest revenue share today?
Platform solutions account for 61.3% of 2024 revenue because integrated stacks reduce operational complexity and shorten deployment timelines.
Why are BFSI companies early adopters of semantic layers?
Banks and insurers face strict lineage and governance mandates, and knowledge graphs provide transparent audit trails that satisfy regulators while supporting real-time risk analytics.
How does cloud deployment compare with on-premise models?
Cloud installations capture 57.8% share because elastic capacity, consumption-based pricing, and managed security features lower the barriers to entry, especially for mid-size enterprises.
Page last updated on:


