Agentic AI In Financial Services Market Size and Share
Market Overview
| Study Period | 2020 - 2031 |
|---|---|
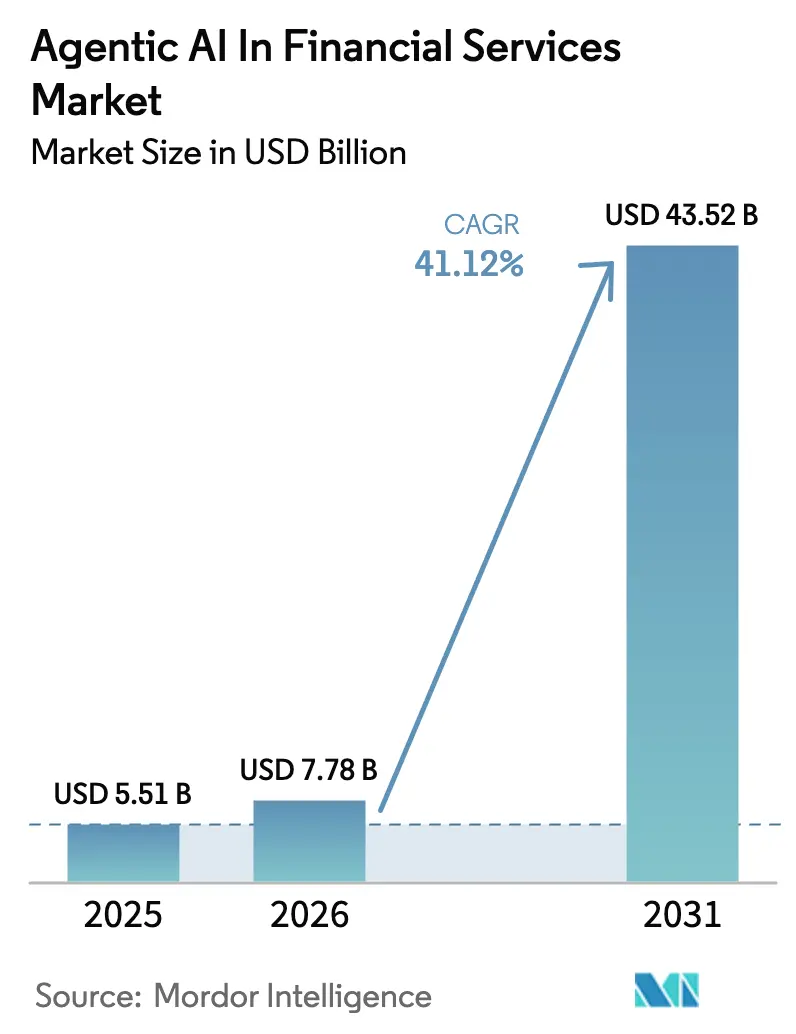
| Market Size (2026) | USD 7.78 Billion |
| Market Size (2031) | USD 43.52 Billion |
| Growth Rate (2026 - 2031) | 41.12% CAGR |
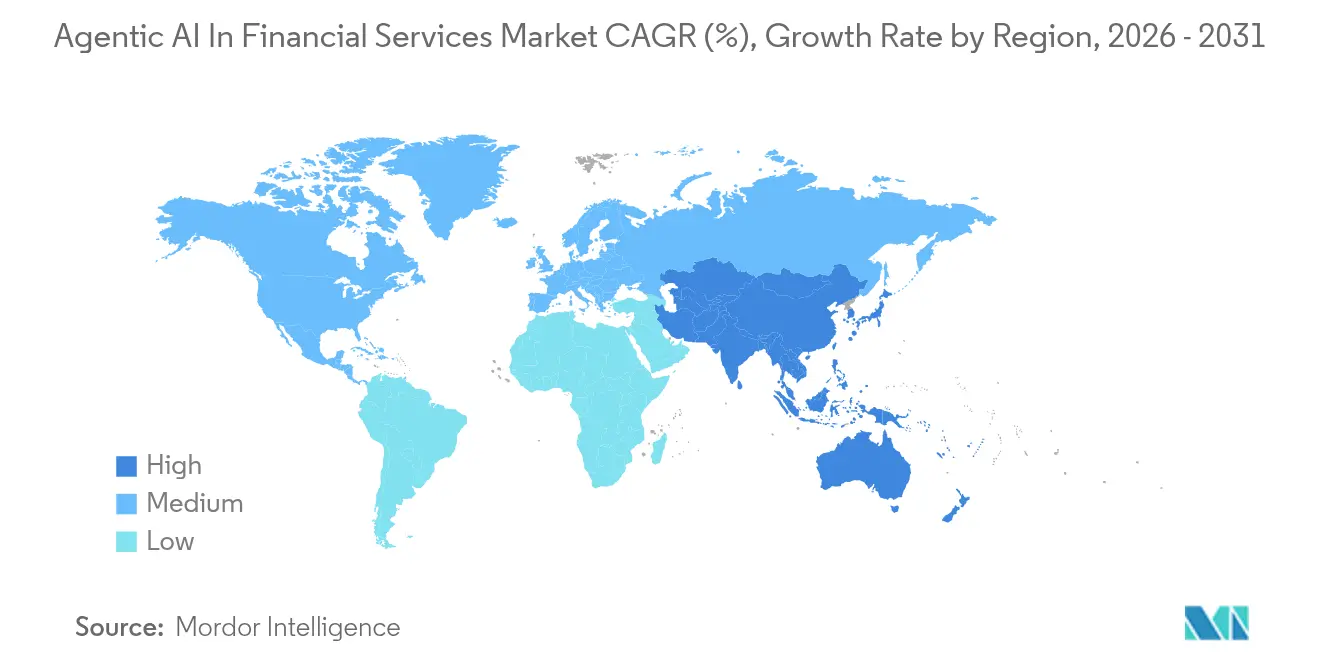
| Fastest Growing Market | Asia Pacific |
| Largest Market | North America |
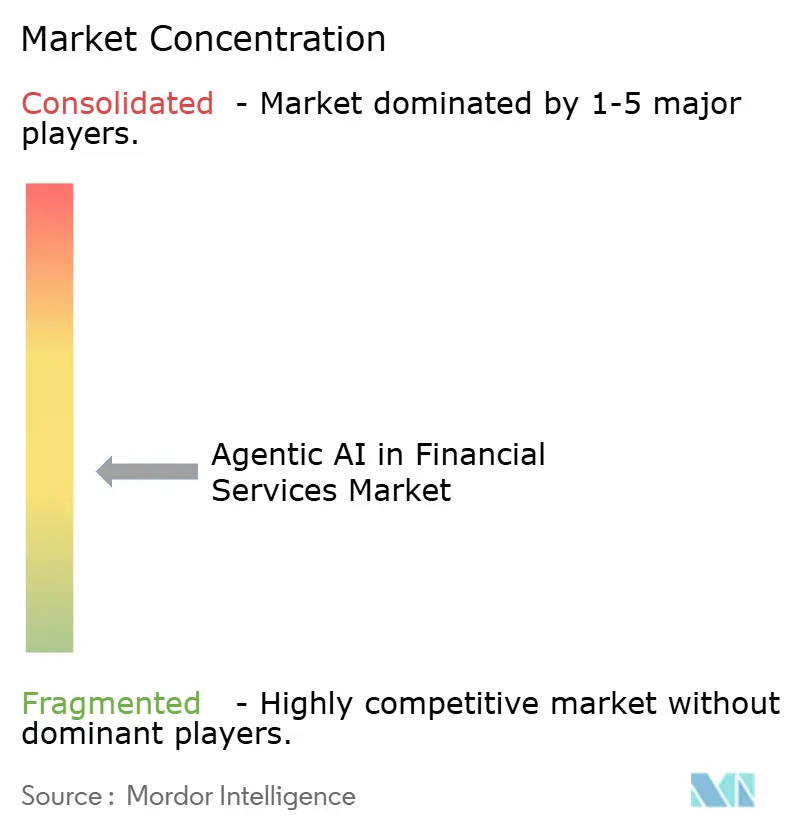
| Market Concentration | Medium |
Major Players *Disclaimer: Major Players sorted in no particular order Image © Mordor Intelligence. Reuse requires attribution under CC BY 4.0. | |
Agentic AI In Financial Services Market Analysis by Mordor Intelligence
The Agentic AI in the financial services market size in 2026 is estimated at USD 7.78 billion, growing from 2025 value of USD 5.51 billion with 2031 projections showing USD 43.52 billion, growing at 41.12% CAGR over 2026-2031. Rapid adoption stems from banks’ need to process larger data sets, comply with stricter regulations, and cut operating costs without sacrificing accuracy. Financial institutions now deploy autonomous agents that interlink fraud detection, customer support, and portfolio optimization, creating unified decision loops that run continuously. JPMorgan Chase recorded a 95% drop in false fraud alerts after shifting to agentic AI, proving the technology’s impact on risk mitigation and cost control. At the same time, Klarna achieved 89% first-contact resolution by embedding autonomous agents in customer service, validating the model’s ability to streamline high-volume interactions. Venture funding remains robust as incumbents and start-ups race to build multi-agent orchestration frameworks that parse structured and unstructured data in real time. Regulation is no longer purely a hurdle; supervisors in the United Kingdom and Singapore now co-create guardrails that let firms commercialize agentic AI while staying within prudential limits.
Key Report Takeaways
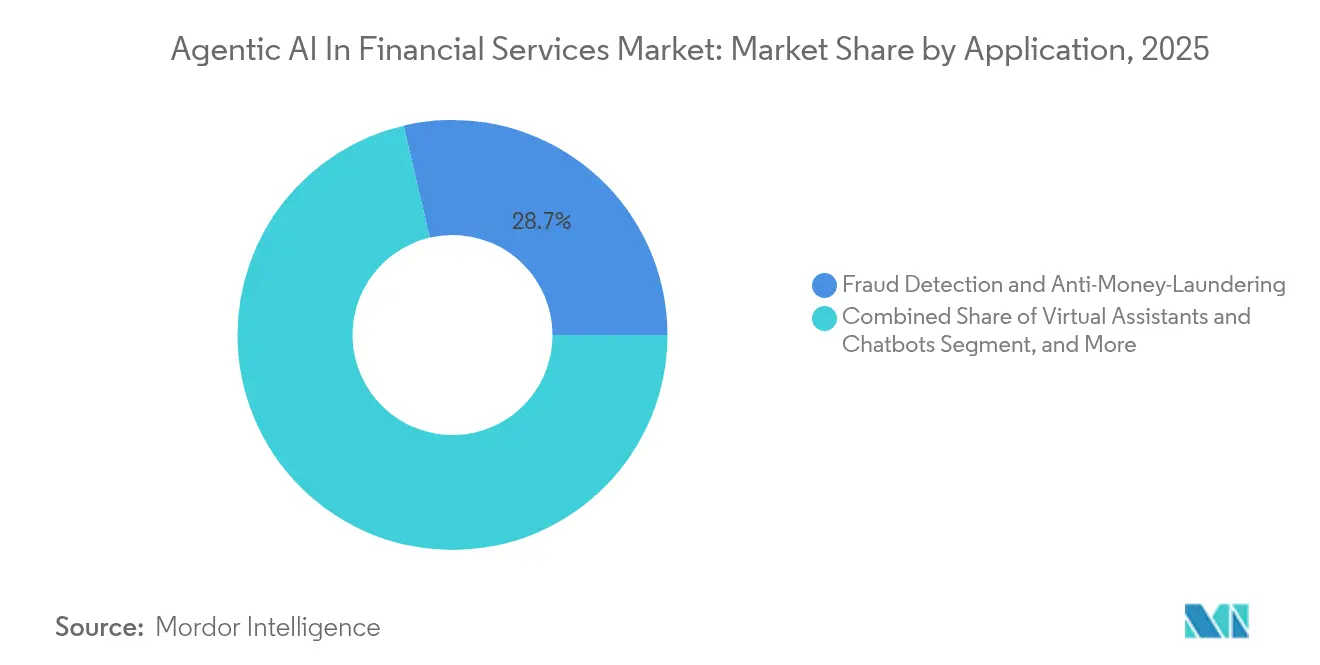
- By application, Fraud Detection and Anti-Money Laundering captured 28.65% of the Agentic AI in the financial services market share in 2025, while Virtual Assistants and Chatbots are advancing at a 35.91% CAGR to 2031.
- By component, Solutions accounted for 62.40% of the Agentic AI in the financial services market size in 2025, whereas Managed Services posted the highest projected CAGR at 34.10% through 2031.
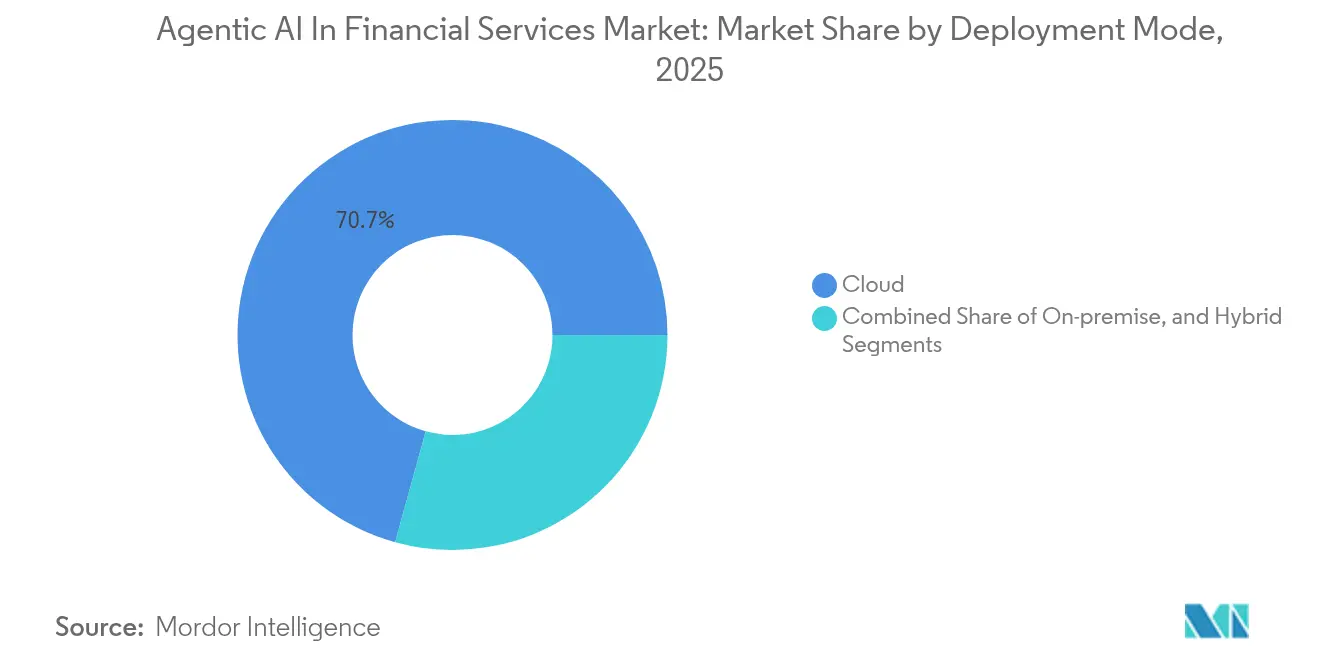
- By deployment mode, Cloud deployments held 70.70% of the Agentic AI in the financial services market size in 2025; Hybrid architectures are expanding at a 33.40% CAGR to 2031.
- By end-user, Commercial Banks led with 45.60% adoption in 2025, although FinTechs and Neobanks are growing at a 38.10% CAGR.
- By geography, North America commanded 38.80% revenue share in 2025, yet Asia-Pacific is projected to rise at a 35.20% CAGR through 2031.
Note: Market size and forecast figures in this report are generated using Mordor Intelligence’s proprietary estimation framework, updated with the latest available data and insights as of 2026.
Global Agentic AI In Financial Services Market Trends and Insights
Drivers Impact Analysis*
| Driver | (~) % Impact on CAGR Forecast | Geographic Relevance | Impact Timeline |
|---|---|---|---|
| Advanced fraud detection and AML adoption surge | +8.2% | Global, with concentrated impact in North America and the EU | Medium term (2-4 years) |
| Cost-reduction and efficiency-seeking across FIs | +7.8% | Global, particularly strong in the Asia-Pacific emerging markets | Short term (≤ 2 years) |
| Regulatory push for AI-enabled compliance | +6.5% | North America and the EU are primary, expanding to the Asia-Pacific | Medium term (2-4 years) |
| Multi-agent orchestration frameworks integrating LLMs with financial data lakes | +5.1% | North America and the EU core, spill-over to the Asia-Pacific | Long term (≥ 4 years) |
| Synthetic financial data generation is easing privacy barriers | +3.8% | Global, with early adoption in North America | Medium term (2-4 years) |
| Agentic AI-driven hyper-personalized wealth orchestration products | +4.6% | North America and EU primary, selective Asia-Pacific markets | Long term (≥ 4 years) |
| Source: Mordor Intelligence | |||
Advanced Fraud Detection and AML Adoption Surge
Institutions now embed autonomous agents directly into payment rails, so anomalies trigger microsecond interdiction. JPMorgan Chase cut false positives by 95%, freeing analysts to investigate higher-value alerts.[1]JPMorgan Chase, “Annual Report 2025,” jpmorganchase.com Regulators in the European Union upgraded due diligence directives that implicitly require real-time analytics, pushing banks toward agentic architectures. These agents cross-reference behavioral patterns, device fingerprints, and external threat feeds, improving detection rates while reducing customer friction. As guidelines tighten, fraud-focused deployments represent the quickest path to measurable returns, ensuring sustained investment in agentic AI in financial services market projects.
Cost Reduction and Efficiency Seeking Across Financial Institutions
Back-office processes—loan document review, KYC validation, tax preparation—now run on continuous loops of autonomous micro-agents. H&R Block’s AI tax copilots augment 60,000 professionals during peak season, saving the firm both overtime and rework costs. Similar deployments lower operating expense ratios by as much as 30%, an outcome prized in low-interest environments where margin compression intensifies. Emerging-market lenders in Indonesia and Vietnam accelerated adoption to bypass legacy mainframe upgrades and go straight to cloud-native agent stacks. The resulting cycle of cost release and productivity gain keeps the Agentic AI in the financial services market on a steep trajectory.
Regulatory Push for AI-Enabled Compliance
Supervisory bodies concede that manual monitoring cannot keep pace with cross-border trade and crypto asset velocity. The UK-Singapore accord signed in July 2025 outlines shared taxonomies and audit standards for explainable autonomous agents. Citigroup’s FX desk now uses an agent network that captures regulation changes automatically, adjusting hedging thresholds without code rewrites. Regulatory certainty reduces procurement friction, encourages multi-year contracts, and pulls late adopters into the Agentic AI in financial services market earlier than planned.
Multi-Agent Orchestration Frameworks Integrating LLMs with Financial Data Lakes
New orchestration layers let specialists assign discrete mandates—liquidity, credit, capital—to separate agents that still share a common knowledge graph. FinRobot demonstrated how twelve coordinated agents executed trades, updated risk dashboards, and logged regulatory reports in a single workflow. The architecture scales horizontally, supporting new asset classes or geographies by spinning up agents without re-engineering the core. Vendor roadmaps now cite orchestration as a decisive buying criterion, cementing it as a pillar of the Agentic AI in the financial services market.
Restraints Impact Analysis*
| Restraint | (~) % Impact on CAGR Forecast | Geographic Relevance | Impact Timeline |
|---|---|---|---|
| Data-governance and privacy compliance complexity | -4.2% | Global, particularly stringent in the EU under GDPR | Short term (≤ 2 years) |
| Talent shortage and upskilling gap in AI/ML | -3.8% | Global, acute in North America and the EU | Medium term (2-4 years) |
| Real-time decision-error risk (hallucinations) in autonomous agents | -5.1% | Global, critical in high-stakes financial decisions | Medium term (2-4 years) |
| Vendor lock-in via proprietary agent-control layers | -2.9% | Global, concentrated in enterprise deployments | Long term (≥ 4 years) |
| Source: Mordor Intelligence | |||
Data-Governance and Privacy Compliance Complexity
The EU’s GDPR mandates data lineage disclosure, compelling banks to expose every transformation step an agent performs. Institutions respond with synthetic data platforms that mimic statistical properties while masking personal identifiers, yet regulators differ on acceptable thresholds. Compliance teams add explainability modules that raise project costs and extend launch cycles, especially for cross-border payment hubs. These hurdles slow deployments of Agentic AI in the financial services market, though vendors that package privacy-by-design tooling stand to gain.
Real-Time Decision-Error Risk in Autonomous Agents
Large language models occasionally hallucinate corporate actions or misinterpret macro headlines, triggering flawed trades. A 2025 arXiv study showed sentiment-manipulating botnets could shift intraday prices for thinly traded equities. Banks, therefore, layer human checkpoints on high-value transactions, dialing back promised labor savings. Vendors now release sandbox modes that throttle agent autonomy until reliability metrics converge, but residual risk still tempers wholesale replacement of human traders, restraining expansion in the Agentic AI in financial services market during the forecast window.
*Our forecasts treat driver/restraint impacts as directional, not additive. The impact forecasts reflect baseline growth, mix effects, and variable interactions.
Segment Analysis
By Application: Virtual Assistants Drive Customer Experience Revolution
Virtual Assistants and Chatbots post the segment’s strongest growth at a 35.91% CAGR, reflecting rising demand for 24-hour self-service across retail banking. Fraud Detection and AML currently hold 28.65% of the Agentic AI in the financial services market share, underlining compliance urgency. Institutions such as Kasisto process millions of dialogues monthly, demonstrating high concurrency levels without latency spikes.
Supporting functions follow. Risk Management agents run continuous VaR checks, while Trading agents update portfolio allocations in milliseconds. Credit Scoring agents factor alternative datasets, widening financial inclusion in under-banked regions. Customer Insights engines personalize offers, increasing cross-sell rates. Together, these use cases illustrate the breadth of opportunity inside the Agentic AI in the financial services market.


By Component: Solutions Dominate While Services Accelerate
Solutions platforms contributed 62.40% of 2025 revenue as banks license orchestration layers and developer kits. Managed Services, however, register a 34.10% CAGR as institutions outsource model retraining and compliance back-testing. Providers such as UPTIQ bundle monitoring dashboards, drift alerts, and regulatory reporting, lowering the total cost of ownership.
Professional Services remain essential for legacy integration, especially where on-premise cores still process settlement. This blended pattern indicates that while software forms the spine of the Agentic AI in the financial services market, service specialists capture an expanding share as systems scale.
By Deployment Mode: Cloud Leadership with Hybrid Acceleration
Cloud still accounts for 70.70% of 2025 deployments thanks to burst-compute flexibility for model training. Hybrid rises at 33.40% CAGR because data-sovereignty rules now dictate local storage for personally identifiable information. UBS runs low-latency inferencing on-premise yet bursts to Azure for retraining cycles, illustrating the hybrid path.
On-premise persists in countries where regulators require in-country hardware. Yet capital adequacy calculations and anti-fraud scoring increasingly move to cloud clusters, underscoring that scalability, not hardware ownership, drives competitiveness in the Agentic AI in financial services market.
By End-User: FinTechs Lead Innovation While Banks Scale Operations
Commercial Banks constitute 45.60% of 2025 adoption, leveraging agents for core-system modernization and branchless service models. FinTechs and Neobanks record a 38.10% CAGR because greenfield architectures ease plug-and-play integration. Dave’s AI assistant handled 89% of incoming queries in 2024, freeing human staff for exception handling.
Investment Banks deploy multi-agent trading frameworks that monitor liquidity and regulatory capital triggers in real time, while Insurers automate claims triage. Compliance firms harness agents to scan evolving statutes and issue alerts. This diverse uptake confirms the expansive scope of the Agentic AI in the financial services market.
Geography Analysis
North America controls 38.80% of 2025 revenue, supported by deep AI talent pools and clear supervisory guidance. JPMorgan Chase, Citigroup, and Wells Fargo all scaled production deployments beyond pilot size, proving commercial feasibility. Venture capital continues to flow into orchestration start-ups, ensuring pipeline depth for the Agentic AI in the financial services market.
Asia-Pacific grows fastest at a 35.20% CAGR as governments fast-track open-data initiatives and issue sandbox licences that shorten approval times. Singapore’s Monetary Authority co-drafted model-risk guidelines that clarify allowed autonomy levels, removing uncertainty for regional banks.Japanese megabanks, meanwhile, retrofit cloud data lakes so agents can ingest decades of transaction records.
Europe advances steadily; GDPR obligations extend project timelines but also create high entry barriers that protect first movers. Institutions harmonize privacy engineering with agent orchestration, producing transferable blueprints for the wider Agentic AI in the financial services market.
Middle East and Africa emphasize fraud detection and chatbots to leapfrog branch networks, while South America’s neobanks exploit agents to underwrite thin-file borrowers. These divergent priorities demonstrate that local regulation and infrastructure maturity dictate adoption velocity, yet all territories contribute to the aggregate expansion of the Agentic AI in the financial services market.

Competitive Landscape
Competition remains moderately fragmented. Microsoft, IBM, and Google invest in domain-specific copilots, while Palantir layers ontology management over existing data warehouses. Anthropic’s July 2025 rollout of Claude for Financial Services signals new verticalized entrants that bundle LLMs with premium data feeds.
Acquisition activity intensifies. IBM bought a synthetic-data start-up to embed privacy controls natively, whereas FIS closed a deal for an orchestration engine that coordinates risk, treasury, and compliance agents. Such moves concentrate intellectual property, gradually raising entry barriers in the Agentic AI in the financial services market.
Specialists thrive by targeting whitespace. AgentSmyth focuses solely on covenant monitoring for private credit funds, while Kay automates repetitive reconciliation across payment gateways.[4]AgentSmyth, “Covenant Monitoring with AI Agents 2024,” agentsmyth.com Partnerships with cloud hyperscalers remain crucial because agents require GPU capacity and telemetry pipelines that smaller vendors cannot finance alone. Integration depth, explainability, and regulatory alignment, therefore, become decisive purchase criteria.
Agentic AI In Financial Services Industry Leaders
Microsoft Corporation
International Business Machines Corporation (IBM)
Alphabet Inc. (Google)
Amazon Web Services, Inc.
SAS Institute Inc.
- *Disclaimer: Major Players sorted in no particular order

Recent Industry Developments
- July 2025: Anthropic launched Claude for Financial Services, integrating FactSet and Morningstar data to streamline analyst research workflows.
- July 2025: WealthAi joined forces with MDOTM to embed Sphere’s autonomous portfolio design module into WealthAi’s MarketPlace.
- July 2025: Lloyds Banking Group began pilots with UnlikelyAI’s neuro-symbolic models inside its Innovation Sandbox.
- July 2025: The United Kingdom and Singapore formalized an alliance to coordinate AI governance in finance.


Global Agentic AI In Financial Services Market Report Scope
| Fraud Detection and AML |
| Virtual Assistants and Chatbots |
| Risk Management and Compliance Automation |
| Portfolio Management and Trading |
| Credit Scoring and Underwriting |
| Customer Insights and Personalization |
| Other Niche Applications |
| Solutions | Agentic-AI Platforms |
| SDKs and Frameworks | |
| Services | Professional Services |
| Managed Services |
| Cloud |
| On-premise |
| Hybrid |
| Commercial Banks |
| Investment Banks and Asset Managers |
| Insurance Companies |
| FinTechs and Neobanks |
| Regulatory and Compliance Firms |
| Other Financial Institutions |
| North America | United States | |
| Canada | ||
| Mexico | ||
| South America | Brazil | |
| Argentina | ||
| Rest of South America | ||
| Europe | United Kingdom | |
| Germany | ||
| France | ||
| Italy | ||
| Spain | ||
| Russia | ||
| Rest of Europe | ||
| Asia-Pacific | China | |
| Japan | ||
| India | ||
| South Korea | ||
| ASEAN | ||
| Rest of Asia-Pacific | ||
| Middle East and Africa | Middle East | United Arab Emirates |
| Saudi Arabia | ||
| Turkey | ||
| Qatar | ||
| Rest of Middle East | ||
| Africa | South Africa | |
| Nigeria | ||
| Egypt | ||
| Rest of Africa | ||
| By Application | Fraud Detection and AML | ||
| Virtual Assistants and Chatbots | |||
| Risk Management and Compliance Automation | |||
| Portfolio Management and Trading | |||
| Credit Scoring and Underwriting | |||
| Customer Insights and Personalization | |||
| Other Niche Applications | |||
| By Component | Solutions | Agentic-AI Platforms | |
| SDKs and Frameworks | |||
| Services | Professional Services | ||
| Managed Services | |||
| By Deployment Mode | Cloud | ||
| On-premise | |||
| Hybrid | |||
| By End-User | Commercial Banks | ||
| Investment Banks and Asset Managers | |||
| Insurance Companies | |||
| FinTechs and Neobanks | |||
| Regulatory and Compliance Firms | |||
| Other Financial Institutions | |||
| By Geography | North America | United States | |
| Canada | |||
| Mexico | |||
| South America | Brazil | ||
| Argentina | |||
| Rest of South America | |||
| Europe | United Kingdom | ||
| Germany | |||
| France | |||
| Italy | |||
| Spain | |||
| Russia | |||
| Rest of Europe | |||
| Asia-Pacific | China | ||
| Japan | |||
| India | |||
| South Korea | |||
| ASEAN | |||
| Rest of Asia-Pacific | |||
| Middle East and Africa | Middle East | United Arab Emirates | |
| Saudi Arabia | |||
| Turkey | |||
| Qatar | |||
| Rest of Middle East | |||
| Africa | South Africa | ||
| Nigeria | |||
| Egypt | |||
| Rest of Africa | |||


Key Questions Answered in the Report
What is the current Agentic AI in the financial services market size?
The market is valued at USD 7.78 billion in 2026, with expectations to reach USD 43.52 billion by 2031.
Which application area leads the Agentic AI in the financial services market?
Fraud Detection and Anti-Money Laundering hold the largest share at 28.65% of 2025 revenue.
How fast is the virtual assistant segment growing?
Virtual Assistants and Chatbots expand at a 35.91% CAGR, the quickest among all applications.
Why are hybrid deployments gaining traction?
Hybrid architectures meet strict data-residency rules while still offering cloud-level scalability, growing at a 33.40% CAGR.
Which region is set to grow fastest?
Asia-Pacific shows the strongest momentum with a forecast CAGR of 35.20% as regulatory reforms foster AI innovation.
Page last updated on:


