Aerostructures Market Size and Share
Market Overview
| Study Period | 2020 - 2031 |
|---|---|
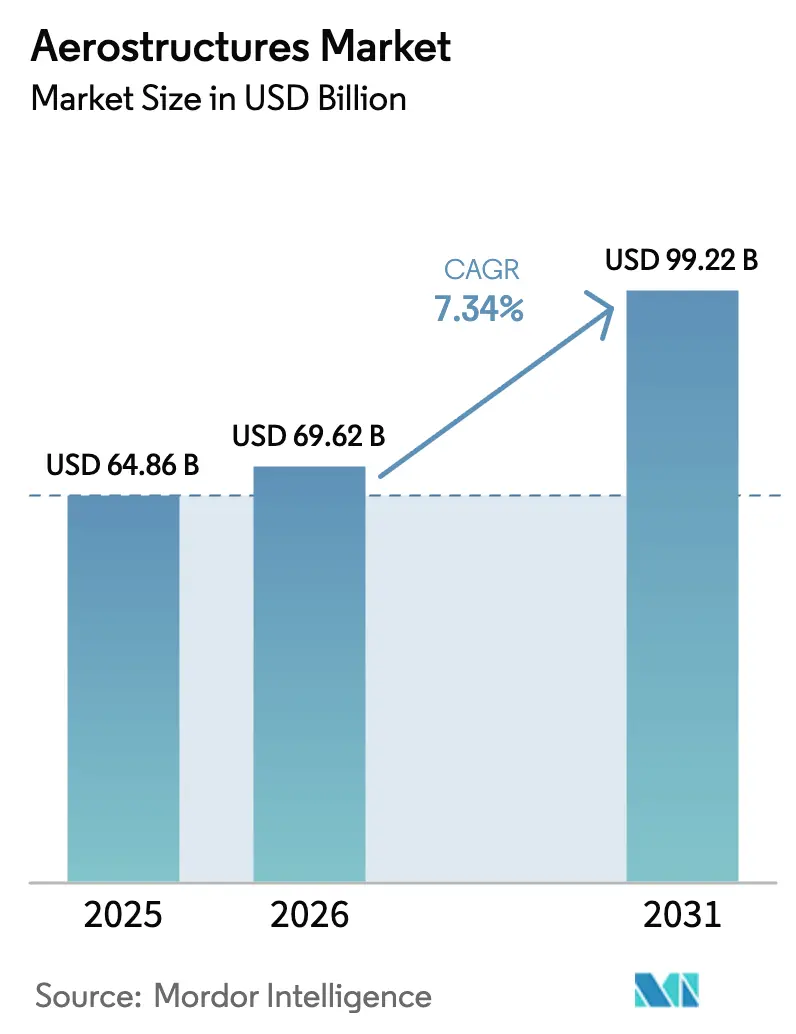
| Market Size (2026) | USD 69.62 Billion |
| Market Size (2031) | USD 99.22 Billion |
| Growth Rate (2026 - 2031) | 7.34% CAGR |
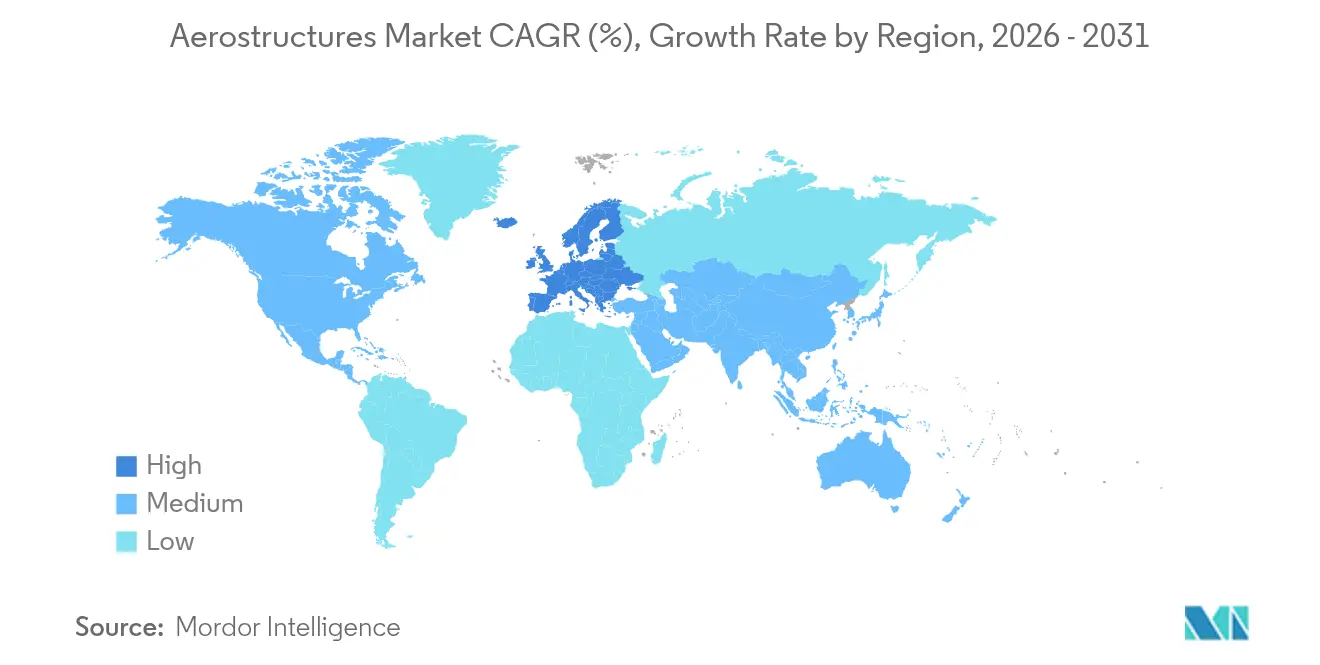
| Fastest Growing Market | Asia Pacific |
| Largest Market | North America |
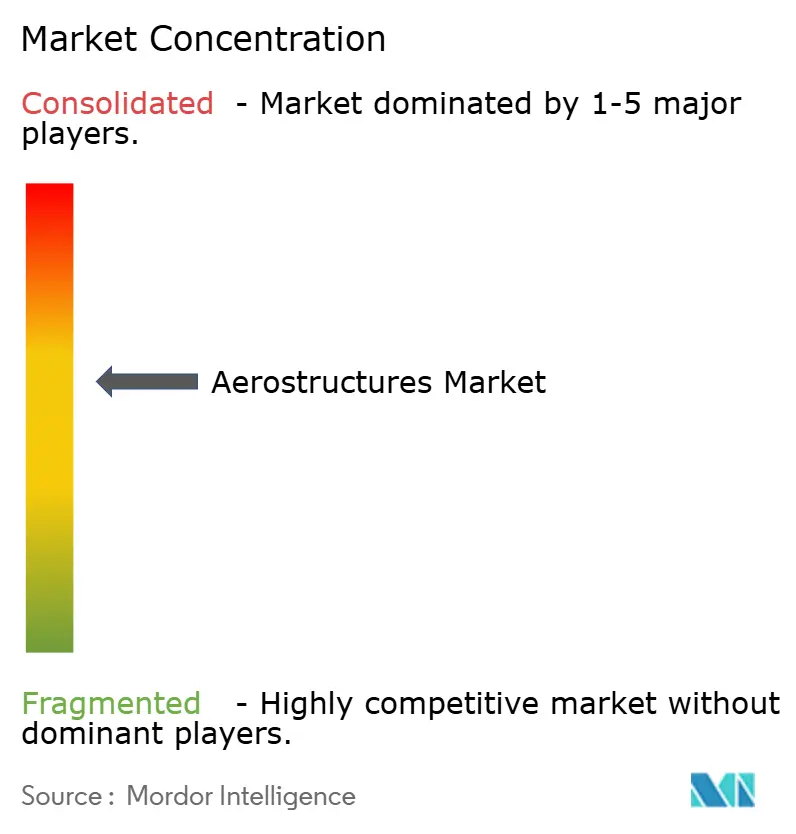
| Market Concentration | Medium |
Major Players *Disclaimer: Major Players sorted in no particular order Image © Mordor Intelligence. Reuse requires attribution under CC BY 4.0. | |
Aerostructures Market Analysis by Mordor Intelligence
Aerostructures market size in 2026 is estimated at USD 69.62 billion, growing from 2025 value of USD 64.86 billion with 2031 projections showing USD 99.22 billion, growing at 7.34% CAGR over 2026-2031. Strong order books at aircraft OEMs, accelerated defense modernization, and a rebound in passenger traffic underpin this growth. Narrow-body production ramp-ups, the rise of unmanned aerial vehicles, and lightweight composite penetration reinforce demand visibility for the tiered supply base. Supply chain bottlenecks in forgings, castings, and strategic metals have tightened pricing power in favor of qualified suppliers. Vertical integration moves—most notably Boeing’s acquisition of Spirit AeroSystems—signal a shift toward tighter control of critical structures as OEMs balance rate increases with quality assurance.
Key Report Takeaways
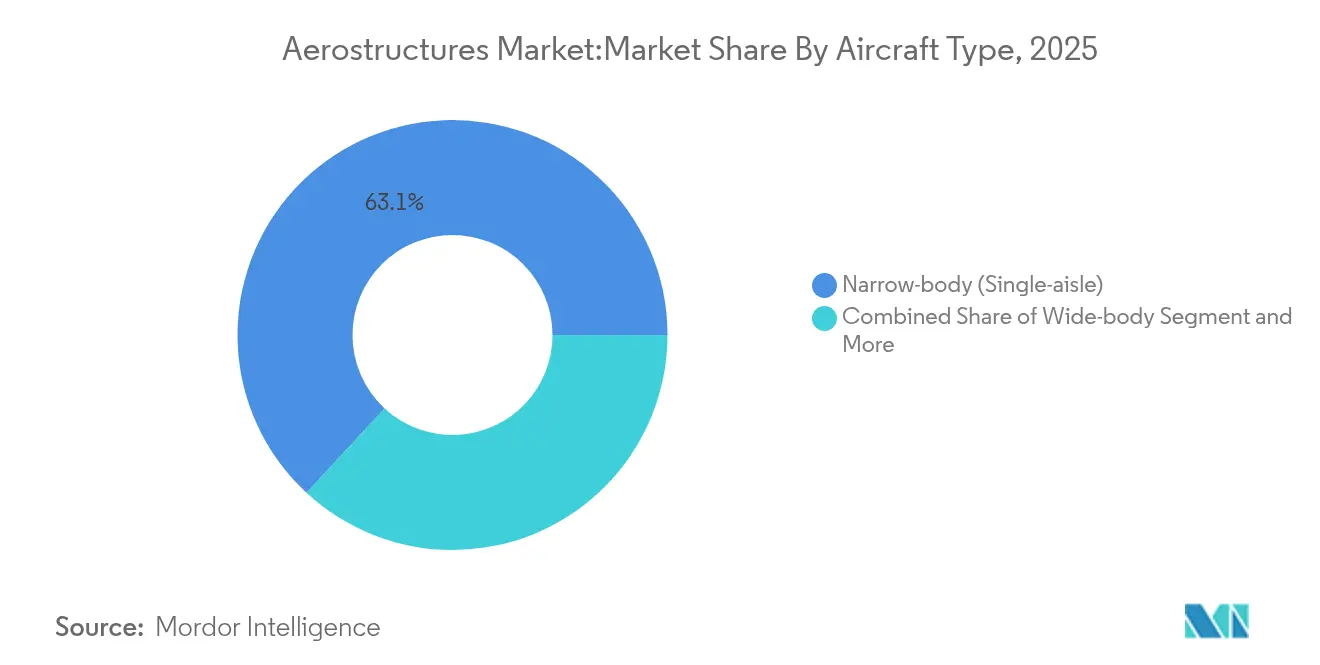
- By aircraft type, narrow-body platforms led with 63.12% revenue share in 2025, while unmanned aerial vehicles are projected to grow at a 17.05% CAGR through 2031.
- By component, wings and winglets accounted for 26.42% of the aerostructures market share in 2025; nacelles and pylons are advancing at a 12.08% CAGR to 2031.
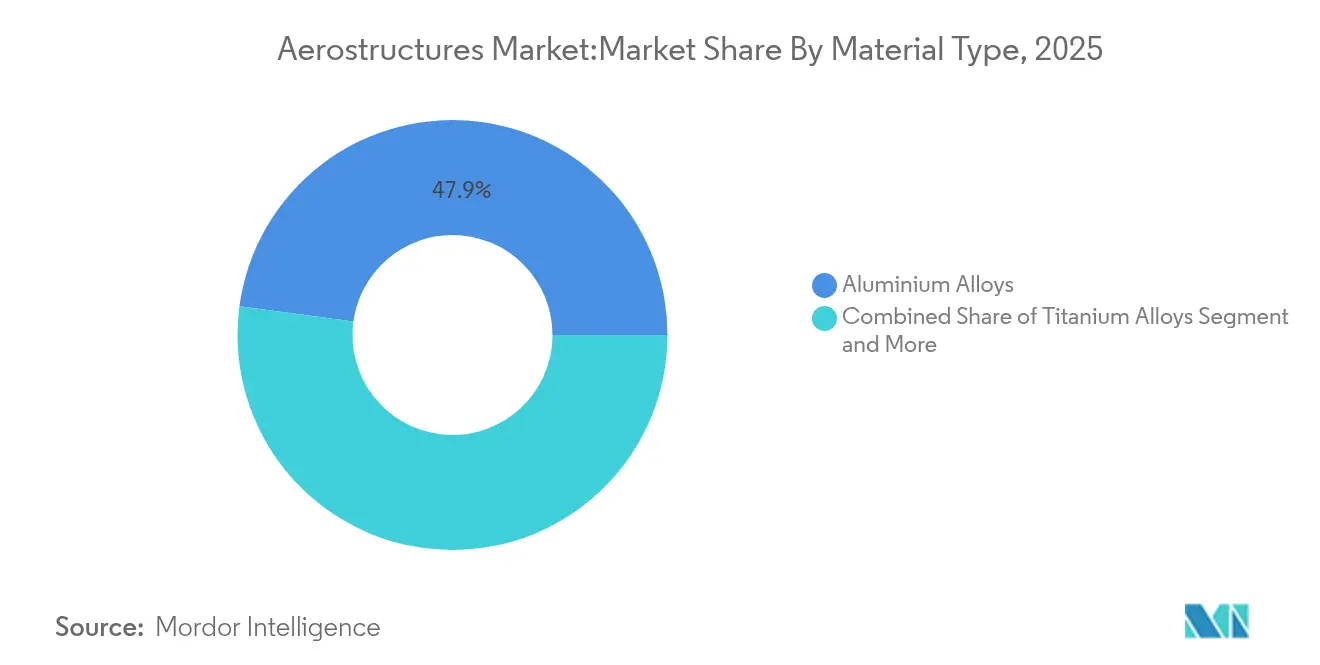
- By material, aluminum alloys retained 47.86% share in 2025, whereas thermoplastic composites are forecast to expand at a 12.23% CAGR.
- By end user, tier-1 integrators held 70.15% of the aerostructures market size in 2025 and are growing at 8.92% CAGR this decade.
- By geography, Europe captured 33.12% revenue in 2025; Asia-Pacific is expected to post the fastest 8.38% CAGR through 2031.
Note: Market size and forecast figures in this report are generated using Mordor Intelligence’s proprietary estimation framework, updated with the latest available data and insights as of 2026.
Global Aerostructures Market Trends and Insights
Drivers Impact Analysis*
| Driver | (~) % Impact on CAGR Forecast | Geographic Relevance | Impact Timeline |
|---|---|---|---|
| Commercial aircraft backlog at record highs | +2.1% | Global, concentrated in North America and Europe | Medium term (2-4 years) |
| Accelerating shift to lightweight composite wings | +1.8% | Global, led by North America and Europe | Long term (≥ 4 years) |
| Rising defence budgets for next-gen fighters | +1.5% | North America, Europe, Asia-Pacific core | Medium term (2-4 years) |
| Additive-manufactured titanium sub-assemblies | +0.9% | North America and Europe, expanding to Asia-Pacific | Long term (≥ 4 years) |
| India and GCC offset policies localising build-to-print parts | +0.7% | Asia-Pacific and Middle East, spill-over to global supply chains | Medium term (2-4 years) |
| eVTOL/advanced air-mobility airframes needing low-cost nacelles | +0.4% | North America and Europe, early adoption in APAC | Long term (≥ 4 years) |
| Source: Mordor Intelligence | |||
Commercial aircraft backlog at record highs
Airbus reported 8,658 aircraft on order valued at EUR 629 billion as of 2024, while Boeing’s backlog exceeded USD 460 billion. These unprecedented queues provide multi-year revenue visibility to the aerostructures market[1]Airbus Staff, “Orders & Deliveries December 2024,” Airbus, airbus.com. Narrow-body jets account for 76% of future deliveries, prompting capacity expansions across wing, fuselage, and nacelle suppliers. Output targets—75 A320s per month by 2027 at Airbus and 38 737 MAX jets per month at Boeing—require synchronized rate readiness among tier-1 integrators. Asia-Pacific’s share of outstanding orders nears 50%, driving localization investments and reshaping sourcing footprints.
Accelerating shift to lightweight composite wings
Thermoplastic composites enable 50% weight savings on nacelles and reduce manufacturing cycles by 80%, demonstrated by Collins Aerospace’s recent programs. CF-PEEK grades raise tensile strength to 425 MPa versus 311 MPa for CF-Epoxy, while permitting recycling. Arkema and Hexcel’s fully thermoplastic wingbox trial in 2024 validated readiness for primary structures. Automated deposition lines at ATC Manufacturing now produce 1 million thermoplastic parts annually, underscoring scalability. Regulatory pressure for lower emissions reinforces adoption across both civil and defense airframes.
Rising defence budgets for next-gen fighters
Program outlays such as NGAD, GCAP, and continued F-35 procurement increase demand for stealth-capable, high-temperature structures. Saudi Arabia’s potential entry into GCAP links defense spend to domestic industrialization. Lockheed Martin’s generative-AI partnership with Google Cloud exemplifies digital integration in complex aerostructures. European engine consortium EURA widens downstream demand for specialized housings and pylon structures Safran. Localization stipulations embedded in new contracts direct investment toward regional build-to-print facilities, further enlarging the aerostructures market.
Additive-manufactured titanium sub-assemblies
Powder-bed fusion cuts material waste by 90% relative to subtractive machining, easing exposure to volatile sponge supply. PBS GROUP and Lockheed Martin target 2029 qualification of fully printed F-35 brackets[2]Editorial Board, “PBS Group to Print F-35 Parts,” PBS Group, pbs.cz. EOS and Godrej have introduced large-scale multi-laser platforms to India’s aerospace corridor, merging localization goals with design freedom. As 90% of US titanium sponge is imported, distributed printing hubs improve resilience and lower logistics risk.
Restraint Impact Analysis*
| Restraint | (~) % Impact on CAGR Forecast | Geographic Relevance | Impact Timeline |
|---|---|---|---|
| Volatile aluminum and CFRP precursor prices | -1.2% | Global, acute impact in North America and Europe | Short term (≤ 2 years) |
| Global supply-chain bottlenecks in forgings and castings | -0.8% | Global, concentrated in North America and Europe | Medium term (2-4 years) |
| End-of-life composite recycling and landfill liability | -0.6% | Europe and North America, expanding globally | Long term (≥ 4 years) |
| Export-control squeeze on Russian titanium sponge | -0.9% | Europe and North America have, indirect impact on Asia-Pacific | Medium term (2-4 years) |
| Source: Mordor Intelligence | |||
Volatile aluminum and CFRP precursor prices
Aluminum averaged USD 2,600 per ton in 2025, while carbon fiber precursor costs swung similarly, compressing margins for long-term fixed-price contracts. Energy-driven smelter closures in Europe squeezed supply; US import tariffs at 25% elevated domestic input costs. Middle River Aerostructure Systems’ switch to automated fiber placement sought to offset higher material expenses through better buy-to-fly ratios. Suppliers hedge volatility via multi-alloy purchasing strategies and growing substitution with thermoplastic composites.
Global supply-chain bottlenecks in forgings and castings
Lead times for large titanium forgings now exceed 18 months. GAO found 9 of 15 tier-2 suppliers missing delivery schedules in 2024, knocking on OEM production targets. Boeing’s counterfeit titanium episode exposed quality-control vulnerabilities arising from constrained capacity. Consolidation moves and dual-source approvals aim to restore buffers, yet skilled labor shortages limit near-term relief. Digital tracking of material pedigrees and vertical integration, as illustrated by Boeing–Spirit, help mitigate recurrence risks.
*Our forecasts treat driver/restraint impacts as directional, not additive. The impact forecasts reflect baseline growth, mix effects, and variable interactions.
Segment Analysis
By Aircraft Type: Narrow-body focus amid UAV surge
Narrow-body platforms generated 63.12% of the 2025 aerostructures market size, anchored by airlines prioritizing fuel-efficient single-aisle fleets. Monthly output escalations at Boeing and Airbus align with network carriers shifting capacity from wide-body to point-to-point routes. Wide-body demand remains steady for intercontinental services, whereas regional jets serve rightsizing niches. Business jets revive on corporate travel normalization, and military transports sustain baseline defense allocations.
The unmanned aerial vehicles category is projected to compound at 17.05% annually to 2031. Defense ministries seek cost-effective ISR and strike options, and civil regulators clear larger platforms for logistics and inspection roles. Leonardo and Baykar’s joint venture targeting the USD 100 billion European UAV opportunity underlines commercial traction Leonardo. Advanced composites and modular architectures dominate structural design, differing markedly from manned aircraft build philosophies.


By Component: Wing scale versus nacelle momentum
Wing and winglet structures accounted for 26.42% of 2025 revenue, owing to aerodynamically driven complexity and span growth on latest narrow-body derivatives. High-rate automated tapelaying for spars and skins accelerates throughput while lowering touch labor. Fuselage panels represent the next-largest pool, with demand rising as twin-aisle recovery gains tempo. Empennage, landing-gear support structures, and control surfaces round out airframe needs, each requiring niche alloys and composites.
Nacelles and pylons are expanding at a 12.08% CAGR. Ultra-high bypass ratio engines demand acoustic liners and integrated thrust reversers with tight tolerance control. Collins Aerospace has delivered more than 40,000 nacelles across 35 programs, demonstrating industrial maturity. Emerging eVTOL concepts require distributed propulsion housings, pushing suppliers to develop modular, lightweight, and thermally robust solutions.
By Material Type: Metals prevail, thermoplastics accelerate.
Aluminum commanded 47.86% of 2025 revenue thanks to cost competitiveness and repair familiarity. Titanium remains essential for hot-zone and high-stress locations. Traditional carbon-fiber composites broadened use in fuselages and wings as autoclave capacity scaled globally.
Thermoplastic composites, however, are set to outpace all categories at 12.23% CAGR. Consolidated lamination and induction welding remove autoclave bottlenecks and deliver repeatable quality. Collins Aerospace’s 80% cycle-time cut on thermoplastic nacelles proves production readiness. EU programs targeting 10% airframe weight reduction through thermoplastic fuselage barrels highlight acceptance in primary load paths.
By End User: Tier-1 integrators control design risk
Tier-1 suppliers managed 70.15% of value in 2025, capturing aero-system integration responsibility and life-cycle risk sharing with OEMs. Financial heft allows them to invest in automation, digital twins, and global supply coordination.
Boeing’s USD 8.3 billion Spirit AeroSystems buyout closes a dependency gap and sets a precedent for tighter OEM oversight. Original equipment manufacturers retain production of classified or proprietary elements, while independent MRO providers grow in tandem with fleet in-service maturity.
Geography Analysis
Europe accounted for 33.12% of aerostructures market revenue in 2025, supported by Airbus ramp-ups and stepped-up defense allocations that keep production lines in France, Germany and the UK running near capacity. Government-funded R&D programs such as Clean Aviation accelerate adoption of thermoplastic wings and additive-manufactured fittings, further anchoring high-value work in the region. Suppliers clustered around Toulouse and Hamburg already benefit from Airbus’s plan to deliver 820 commercial jets in 2025, a 7% jump over 2024 output, and from Eurofighter and GCAP fighter upgrades that demand advanced composites for stealthy control surfaces.
North America sits a close second, driven by Boeing’s single-aisle recovery, robust F-35 production and steady rotorcraft demand. Monthly output of 38 737 MAX airframes has tightened capacity across fuselage panels, nacelles and pylons, while defense spending bills passed in 2025 fund Next Generation Air Dominance demonstrators that require titanium-rich sub-assemblies. Canada and Mexico contribute growing shares of build-to-print assemblies, leveraging USMCA trade provisions to attract foreign direct investment into composite winglets and landing-gear structures.Asia-Pacific is projected to post the fastest 8.38% CAGR through 2031 as China’s C919 moves from low-rate to serial production and India’s 30% offset rule channels defense procurement into domestic machining and composite lay-up shops. COMAC has logged more than 1,000 C919 orders, prompting tier-1 integrators to establish joint ventures in Shanghai, while HAL and Tata Advanced Systems expand build-to-spec fuselage and empennage lines in Hyderabad and Bengaluru. Gulf Cooperation Council states round out the demand picture with in-country-value programs that attracted AED 48 billion of local aerospace spend in 2024, positioning the Middle East as a future composite-repair and MRO hub.

Competitive Landscape
The competitive landscape is moderately consolidated, with the five largest suppliers delivering just over half of external tier-1 aerostructures content in 2024 and relying on decades-long risk-sharing partnerships that pose high switching costs for OEMs. Boeing’s USD 8.3 billion takeover of Spirit AeroSystems marks the biggest vertical integration play in recent aerospace history and is likely to spur Airbus and Lockheed Martin to consider similar moves to secure critical structures at higher production rates. Safran’s acquisition of Collins Aerospace’s actuation and flight-control units illustrates how system breadth is becoming a key differentiator as airframers demand single-accountability suppliers for large work packages.
Digital manufacturing prowess now shapes competitive edge more than sheer capacity. GKN Aerospace has deployed AI-guided sanding cells from GrayMatter Robotics that triple productivity on complex composite skins while cutting defect rates by 15%. Airbus, meanwhile, connects more than 12,000 in-service aircraft to its Skywise platform, feeding real-time load data back to design offices and giving its preferred suppliers insights to engineer lighter structures with higher maintainability. Collins Aerospace showcases thermoplastic nacelle demonstrators that slash part count by 30%, signaling a shift toward out-of-autoclave architectures that smaller competitors struggle to match.
White-space opportunities are emerging in eVTOL aerostructures, additive-manufactured titanium and blended-wing-body programs. JetZero’s USD 4.7 billion Greensboro plant will build 20 blended-wing aircraft per month by the late 2030s, creating a new demand stream for wide, single-piece composite skins and multi-spar wing boxes that incumbent suppliers are racing to qualify. Smaller disruptors leverage regional funding to carve niches: EOS and Godrej deploy multi-laser powder-bed platforms in Bengaluru to print near-net-shape pylons, while Nasmyth and PTC Industries set up integrated machining-to-assembly lines in Lucknow to serve both COMAC and Boeing programs.
Aerostructures Industry Leaders
Spirit AeroSystems Holdings Inc.
Triumph Group Inc.
Airbus SE
The Boeing Company
Leonardo SpA
- *Disclaimer: Major Players sorted in no particular order

Recent Industry Developments
- June 2025: JetZero chose Greensboro, NC for a USD 4.7 billion plant to build Z4 blended-wing aircraft with 50% fuel-burn gains.
- May 2025: Vertical Aerospace and Honeywell deepened cooperation on the VX4 eVTOL under a contract worth USD 1 billion.
- April 2025: Airbus moved to acquire select Spirit AeroSystems facilities supporting A350 and A220 programs.
- March 2025: : Leonardo and Baykar formed a joint venture for European UAS design and sustainment.


Research Methodology Framework and Report Scope
Market Definitions and Key Coverage
Our study defines the aerostructures market as the new-build wings, fuselages, empennages, nacelles, pylons, landing-gear housings, and major flight-control surfaces supplied to fixed-wing and rotary-wing aircraft programs across commercial, military, business-jet, and unmanned platforms. We capture revenue generated at tier-1 and super-tier-1 levels before final assembly.
(Scope exclusion) Cabin interiors, fasteners, systems integration labor, and MRO-only revenues sit outside our stated boundary to keep the data strictly structural.
Segmentation Overview
- By Aircraft Type
- Narrow-body (Single-aisle)
- Wide-body
- Regional Jets (?150 seats)
- Business Jets
- Military Fixed-Wing
- Rotorcraft
- Unmanned Aerial Vehicles
- By Component
- Fuselage Sections
- Wings and Winglets
- Empennage (Tail)
- Nacelles and Pylons
- Landing-Gear Structures
- Doors and Control Surfaces
- By Material Type
- Aluminium Alloys
- Titanium Alloys
- Carbon-Fibre Composites
- Glass-Fibre Composites
- Thermoplastic Composites
- By End-User
- OEMs
- Tier-1 Integrators
- Aftermarket / MRO
- By Geography
- North America
- United States
- Canada
- Mexico
- South America
- Brazil
- Argentina
- Rest of South America
- Europe
- United Kingdom
- Germany
- France
- Italy
- Spain
- Nordics
- Rest of Europe
- Middle East and Africa
- Middle East
- Saudi Arabia
- United Arab Emirates
- Turkey
- Rest of Middle East
- Africa
- South Africa
- Egypt
- Nigeria
- Rest of Africa
- Middle East
- Asia-Pacific
- China
- India
- Japan
- South Korea
- ASEAN
- Australia
- New Zealand
- Rest of Asia-Pacific
- North America
Detailed Research Methodology and Data Validation
Primary Research
We interview engineering directors at tier-1 integrators, procurement leads at airlines and defense forces, composite-shop owners in Asia-Pacific, and MRO planners on three continents. Their insights let us test secondary findings, close granular data gaps, and fine-tune model drivers such as composite penetration rates and labor-hour coefficients.
Desk Research
We aggregate public-domain reference points, production and delivery logs from Airbus, Boeing, EASA and FAA airworthiness databases, ICAO traffic statistics, IATA fleet forecasts, and trade-flow records from UN Comtrade; then enrich them with financial disclosures housed in D&B Hoovers and news archives in Dow Jones Factiva. The U.S. Bureau of Transportation Statistics, European Defense Agency budget notes, and material-price series from the London Metal Exchange help our analysts align cost and demand baselines.
Global trade-association white papers, peer-reviewed composite-material journals, and patent analytics from Questel support technology uptake assumptions. This list is illustrative; many other sources underpin data capture, sense-checking, and clarification.
Market-Sizing & Forecasting
A top-down build begins with annual aircraft production and in-service fleet counts, which are then multiplied by typical structural content values (USD per aircraft) segmented by platform and material. Results are corroborated with selective bottom-up roll-ups of supplier revenue samples to adjust totals. Key variables feeding the model include narrow-body delivery schedules, aluminum-alloy spot prices, carbon-fiber share in primary structures, defense procurement outlays, and global revenue-passenger-kilometer growth. Multivariate regression blended with ARIMA smoothing projects these drivers to 2030.
Data Validation & Update Cycle
Three-way cross checks, variance flags, and senior-analyst reviews precede sign-off. We refresh every twelve months; material events such as major OEM rate changes trigger interim updates, ensuring clients receive the latest calibrated view.
Why Mordor's Aerostructures Baseline Deserves Confidence
Published values often diverge because each firm chooses its own component mix, valuation basis, and refresh cadence. Our team anchors estimates on program-level build data that are reconciled with supplier earnings calls, limiting over- or under-statement.
Key gap drivers include whether aftermarket labor is folded into revenue, if advanced-air-mobility craft are counted, list-price versus realized-price treatment, and the point in the tiered supply chain where revenue is booked. Mordor Intelligence discloses these scoping decisions and updates annually, while some external studies rely on older currency conversions or single-source assumptions.
Benchmark comparison
| Market Size | Anonymized source | Primary gap driver |
|---|---|---|
| USD 64.86 B (2025) | Mordor Intelligence | - |
| USD 68.00 B (2024) | Global Consultancy A | Includes heavy MRO spend and uses OEM deliveries only |
| USD 123.25 B (2024) | Trade Journal B | Adds space vehicles and AAM platforms, values at list prices |
| USD 80.32 B (2025) | Industry Association C | Capacity-based model with limited primary validation |
In sum, the disciplined scope choices, transparent variable selection, and yearly refresh cycle adopted by Mordor Intelligence produce a balanced, reproducible baseline that executives can trust when making aircraft-program or supply-chain decisions.


Key Questions Answered in the Report
What is the current value of the aerostructures market?
The aerostructures market was valued at USD 69.62 billion in 2026 and is projected to reach USD 99.22 billion by 2031.
Which segment holds the largest share of the aerostructures market?
Narrow-body aircraft commanded a 63.12% share in 2025, making them the largest segment.
Why are thermoplastic composites gaining traction in aerostructures?
Thermoplastic composites cut component weight by up to 50% and reduce cycle times by 80% compared to traditional materials, while enabling recycling and automated manufacturing.
How is Boeing's acquisition of Spirit AeroSystems impacting the market?
The USD 8.3 billion acquisition represents significant vertical integration, potentially triggering further consolidation as OEMs seek greater control over critical supply chains.
Which region is expected to grow fastest in the aerostructures market?
Asia-Pacific is forecast to grow at 8.38% CAGR through 2031, driven by China's C919 program and India's aerospace localization initiatives.
What materials dominate the aerostructures market?
Aluminum alloys maintained 47.86% market share in 2025, though advanced composites are growing faster, particularly thermoplastic composites at 12.23% CAGR.
Page last updated on:


