Green Technology Market Size and Share
Market Overview
| Study Period | 2020 - 2031 |
|---|---|
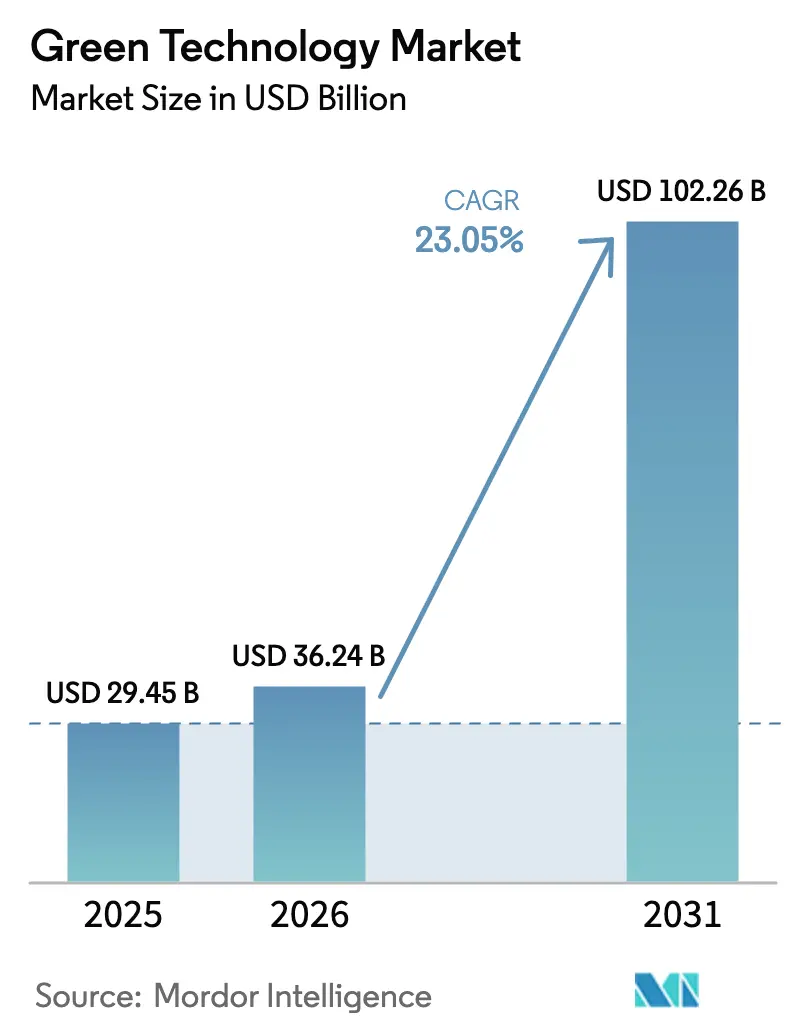
| Market Size (2026) | USD 36.24 Billion |
| Market Size (2031) | USD 102.26 Billion |
| Growth Rate (2026 - 2031) | 23.05% CAGR |
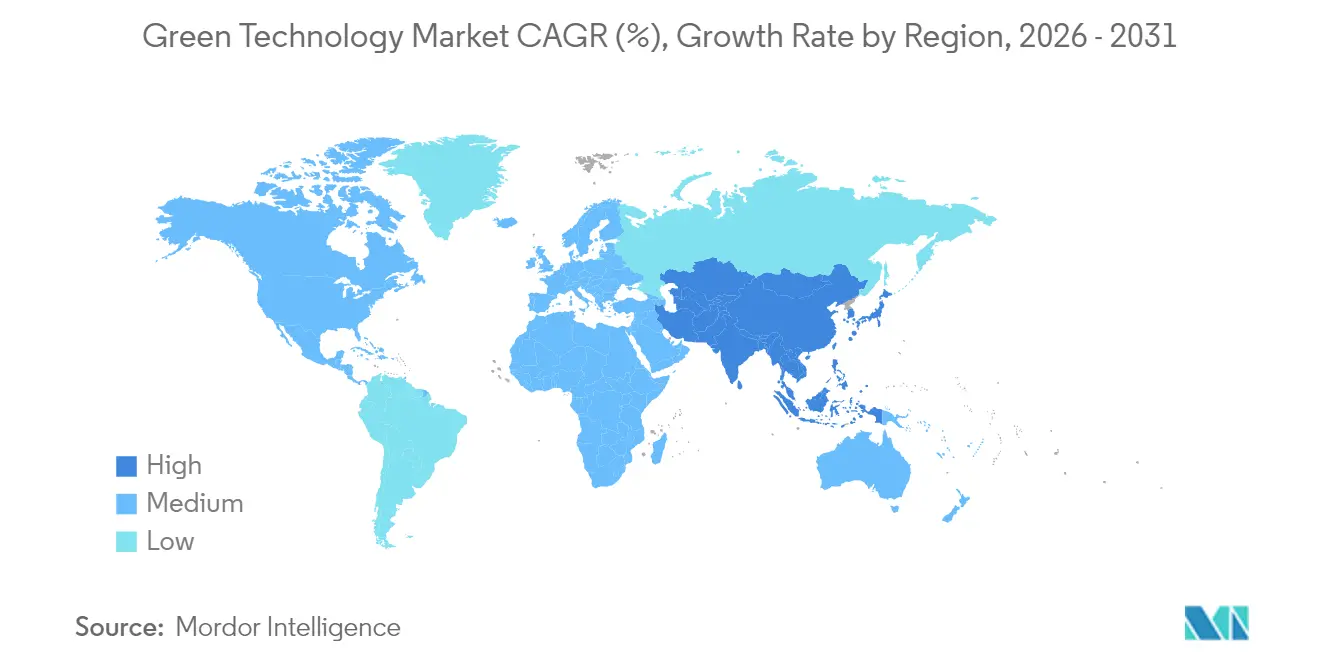
| Fastest Growing Market | Asia Pacific |
| Largest Market | North America |
| Market Concentration | Medium |
Major Players *Disclaimer: Major Players sorted in no particular order Image © Mordor Intelligence. Reuse requires attribution under CC BY 4.0. | |
Green Technology Market Analysis by Mordor Intelligence
Green technology market size in 2026 is estimated at USD 36.24 billion, growing from 2025 value of USD 29.45 billion with 2031 projections showing USD 102.26 billion, growing at 23.05% CAGR over 2026-2031. Momentum stems from mandatory decarbonization rules, rapid sensor price declines, and the steady integration of AI-driven carbon accounting in enterprise software portfolios. Enterprises now embed real-time environmental data into procurement and production decisions, while investors channel capital toward low-carbon data-center designs that serve compute-heavy Gen-AI workloads. At the same time, supply-chain transparency initiatives spur demand for integrated monitoring platforms that cover everything from raw-material sourcing to last-mile logistics. As a result, the green technology market is moving from pilot projects to organization-wide deployments that align sustainability metrics with revenue goals.
Key Report Takeaways
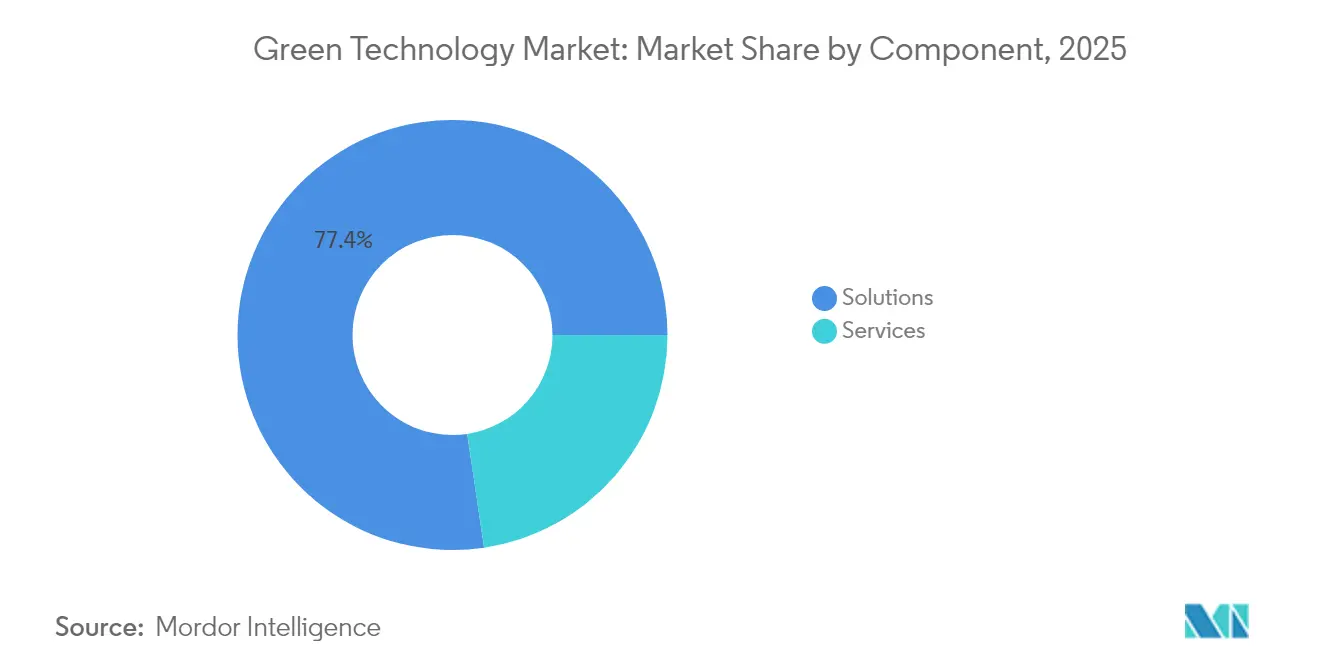
- By component, Solutions led with 77.35% of green technology market share in 2025; Services are expanding at a 24.6% CAGR through 2031.
- By technology, IoT held 32.55% of the green technology market in 2025, while Blockchain is advancing at a 25.4% CAGR to 2031.
- By application, Green Building accounted for 35.70% of the green technology market size in 2025; Crop Monitoring is forecast to grow at a 24.1% CAGR to 2031.
- By end-user, Energy and Utilities commanded 35.15% of the green technology market in 2025, whereas Agriculture shows the sharpest climb at a 23.3% CAGR through 2031.
- By geography, North America captured 23.45% of the green technology market in 2025; Asia-Pacific is on course for a 23.8% CAGR through 2031.
Note: Market size and forecast figures in this report are generated using Mordor Intelligence’s proprietary estimation framework, updated with the latest available data and insights as of 2026.
Global Green Technology Market Trends and Insights
Drivers Impact Analysis*
| Driver | (~)% Impact on CAGR Forecast | Geographic Relevance | Impact Timeline |
|---|---|---|---|
| Rising environmental awareness and corporate net-zero mandates | +6.20% | Global, with leadership in North America and EU | Medium term (2-4 years) |
| Stringent decarbonization policies and carbon pricing | +5.80% | EU core, expanding to Asia-Pacific and North America | Long term (≥ 4 years) |
| Rapid cost decline of IoT sensors and cloud platforms | +4.10% | Global, with manufacturing concentration in Asia-Pacific | Short term (≤ 2 years) |
| AI-driven carbon-accounting platforms embedded in ERP stacks | +3.70% | North America and EU enterprise markets | Medium term (2-4 years) |
| Surge in green data-centre investments for Gen-AI workloads | +2.90% | North America, expanding to Asia-Pacific | Short term (≤ 2 years) |
| Blockchain-based voluntary carbon "insetting" marketplaces | +1.50% | Global, with early adoption in developed markets | Long term (≥ 4 years) |
| Source: Mordor Intelligence | |||
Rising Environmental Awareness and Corporate Net-Zero Mandates
Mandatory sustainability reporting now links executive compensation to emissions targets, prompting companies to embed sensor networks across factories, offices, and logistics nodes. Over 300 listed firms in China must file sustainability disclosures by 2026, reinforcing demand for continuous monitoring tools. Schneider Electric reported record 2024 profits after targeting 800 million tonnes of customer emissions savings by 2025, illustrating how environmental performance is reshaping competitive positioning. Predictable subscription revenues emerge as enterprises move from annual audits to always-on dashboards, and procurement teams increasingly score suppliers on real-time carbon metrics rather than static certificates.
Stringent Decarbonization Policies and Carbon Pricing
The European Commission’s Ecodesign for Sustainable Products Regulation extends environmental requirements to nearly all physical goods by 2025, turning optional upgrades into legal obligations.[1]European Commission, “Ecodesign for Sustainable Products Regulation,” ec.europa.euThe EU’s Carbon Border Adjustment Mechanism forces carbon-intensive exporters to document embedded emissions, encouraging Asia-Pacific manufacturers to accelerate digital monitoring rollouts. Bangladesh, Indonesia, and Vietnam now retrofit textile lines with sensor arrays so finished goods can clear European customs. As a result, multinational supply chains standardize on shared data models, deepening the addressable base for green technology market platforms.
Rapid Cost Decline of IoT Sensors and Cloud Platforms
Sensors priced in cents rather than dollars unlock building-wide and field-wide deployments. The PHOENIX program cut domestic hot-water energy use by 39% in Irish trials and slashed Greek residential peak demand by 86%, showing how scale drives savings. Small and midsize enterprises join the green technology market once monthly cloud fees replace up-front server purchases. Scalable analytics turn volume data into optimization scripts, giving firms the confidence to automate HVAC set-points, irrigation schedules, and fleet routing without in-house data-science teams.
AI-Driven Carbon Accounting Platforms Embedded in ERP Stacks
Microsoft and Siemens integrate AI modules that calculate scope-1, -2, and -3 footprints from live production data, collapsing formerly siloed compliance workflows into finance and operations dashboards.[2]International Energy Agency, “The Role of Critical Minerals in Clean Energy Transitions,” iea.org Plant managers can reroute orders or shift energy-intensive tasks to off-peak renewable hours after receiving automatic alerts. Scenario engines preview the carbon impact of supplier switches or facility expansions, making sustainability a core planning variable rather than a quarterly footnote. As adoption spreads, the green technology market benefits from ERP-license-based rollouts that scale across global subsidiaries with minimal extra coding.
Restraints Impact Analysis*
| Restraint | (~)% Impact on CAGR Forecast | Geographic Relevance | Impact Timeline |
|---|---|---|---|
| High upfront integration and lifecycle costs | -4.30% | Global, with acute impact in emerging markets | Short term (≤ 2 years) |
| Shortage of green-tech talent in emerging regions | -2.80% | APAC emerging markets, Latin America, Africa | Medium term (2-4 years) |
| Scrutiny of digital-infrastructure Scope-2 emissions | -2.10% | Global, with regulatory focus in EU and North America | Medium term (2-4 years) |
| Critical-mineral supply-chain bottlenecks | -1.90% | Global, with acute impact on manufacturing hubs | Long term (≥ 4 years) |
| Source: Mordor Intelligence | |||
High Upfront Integration and Lifecycle Costs
Total cost of ownership still deters smaller firms even as hardware prices fall. Integration fees can triple list prices once legacy industrial systems and staff retraining enter the equation. Many manufacturers struggle to monetize carbon visibility quickly enough to satisfy short-term budget cycles, so adoption skews toward large enterprises with ring-fenced sustainability capital. Consultants and managed-service providers fill capability gaps, yet their labor premiums widen the affordability gulf, slowing the green technology market in lower-margin sectors.
Critical-Mineral Supply-Chain Bottlenecks
Electric-vehicle and renewable-energy booms strain supplies of lithium, cobalt, and rare earths, materials that also underpin sensor boards and battery backups. China controls large portions of refining capacity, exposing downstream buyers to geopolitical risk. The International Energy Agency warns demand could quadruple by 2040, while current U.S. lithium output meets only 2-3% of projected needs.[3]Microsoft Corporation, “Siemens and Microsoft Collaborate to Enable AI-Driven Industrial Transformation,” microsoft.com Recycling and substitution research and development accelerates, yet commercialization lags, so component shortages may cap near-term production volumes in the green technology market.
*Our forecasts treat driver/restraint impacts as directional, not additive. The impact forecasts reflect baseline growth, mix effects, and variable interactions.
Segment Analysis
By Component: Solutions Drive Market Foundation
Solutions accounted for 77.35% of green technology market share in 2025 because enterprises prefer unified suites that consolidate energy, waste, and emissions dashboards. Vendors package IoT ingestion, analytics, and compliance reporting in single licenses, reducing procurement friction and integration risk. The services segment, growing at a 24.6% CAGR, handles configuration, data cleansing, and staff enablement. Many deployments reveal that realized energy savings often exceed 20%, but only after consultants fine-tune sensor thresholds and predictive algorithms. Services teams also update rule libraries as regulations evolve, safeguarding audit readiness.
Professional-service revenue rises further once firms progress from descriptive to prescriptive analytics. For example, smart-building retrofits that link occupancy sensors to HVAC dampers deliver 20–30% energy savings but require continuous model retraining. Carbon-accounting advisory units translate raw readings into scope-3 disclosures accepted by multiple jurisdictions, sparing clients from duplicated reporting cycles. Together, solutions and services form a flywheel: platform rollouts generate data that exposes new optimization opportunities, which in turn demand additional service engagements, reinforcing the expansion of the green technology market.


By Technology: IoT Leadership with Blockchain Acceleration
IoT maintained 32.55% of the green technology market in 2025, reflecting the sheer volume of connected meters deployed across power grids, farms, and factories. Sensor data underpins performance baselines, enabling AI modules to target anomalies. Blockchain, rising at a 25.4% CAGR, supports trusted carbon-credit provenance and supply-chain insetting schemes where brands offset emissions inside their own ecosystems. Artificial-intelligence workloads refine wind-turbine maintenance schedules, a focus highlighted when Aerones secured USD 62 million to expand robotic inspection services.
Digital-twin engines now mirror entire campuses, letting managers test retrofits virtually before touching assets. Cloud hyperscalers supply elastic compute that crunches high-frequency readings, while edge nodes tackle latency-sensitive tasks such as voltage balancing. Trusted ledgers close the loop by recording verified reductions, allowing automated offset purchases when targets slip. This interplay among sensing, modeling, optimization, and traceability secures IoT’s leadership yet leaves room for blockchain’s rapid rise, fueling technology diversity inside the green technology market.
By Application: Green Building Dominance with Agricultural Innovation
Green Building applications represented 35.70% of the green technology market size in 2025, driven by smart lighting, adaptive HVAC, and occupancy-based ventilation that cut operational expenses alongside emissions. Commercial landlords weaponize verified efficiency metrics to attract tenants under ESG mandates. Crop Monitoring, growing at a 24.1% CAGR, harnesses soil probes, drone imaging, and localized weather feeds to steer irrigation and nutrient delivery. Yield gains and input savings justify sensor rollouts even for smallholder farms once service bundles shift costs from capex to opex.
Carbon-footprint management systems, though smaller, gain steady traction as global disclosure frameworks converge. Air and water-quality networks guard urban health, while predictive pollution alerts steer city traffic policies. Weather-monitoring feeds plug into agricultural dashboards, informing pest-control timing. These interoperable applications converge on unified analytics layers, letting organizations toggle among building energy, field moisture, and factory emissions inside one pane, reinforcing cross-vertical synergies that enlarge the green technology market.

By End-User Industry: Energy Sector Leadership with Agricultural Transformation
Energy and Utilities controlled 35.15% of the green technology market in 2025 because regulators require granular emissions logs from generation to distribution. Grid operators deploy sub-second monitoring that balances variable renewable inputs with demand patterns. Agriculture, expanding at a 23.3% CAGR, adopts satellite imagery and autonomous machinery to lift yield per hectare while trimming chemical and water usage. Manufacturing plants insert environment-as-a-service modules into Industry 4.0 stacks, synchronizing quality, throughput, and carbon KPIs.
Transport fleets implement AI route optimizers that integrate charging-station availability for electric trucks. Construction firms specify low-carbon materials early in design phases, reducing retrofit costs. Data-center operators push immersion cooling and renewable power purchase agreements to offset AI workload surges. Municipal agencies fold building, waste, and mobility dashboards into smart-city control rooms. Each sector contributes domain-specific requirements yet shares common data pipelines, sustaining the horizontal expansion pathway for the green technology market.
Geography Analysis
North America led the green technology market with a 23.45% share in 2025 on the back of federal incentives and deep venture-capital pools. The Inflation Reduction Act funnels billions toward clean-energy infrastructure, while corporate buyers lock in multi-year sustainability budgets. United States firms bundle carbon analytics into enterprise contracts, leveraging mature software ecosystems. Canada scales similar platforms to track cross-border automotive and aerospace supply chains, and Mexico integrates emissions monitoring into maquiladora compliance workflows, reflecting region-wide policy alignment.
Asia-Pacific recorded the fastest projected growth at a 23.8% CAGR, powered by industrial expansion paired with tighter environmental mandates. China’s stock-exchange rules, which require sustainability reports from 2026, catalyze factory sensor retrofits. India doubles down on domestic clean-tech IP to offset mineral import risks, and Japan accelerates smart-factory rollouts to maintain export competitiveness. South Korea allotted about USD 101 million to its Strategic Smart City Program, embedding IoT nodes in transport and water grids.

Competitive Landscape
The green technology market remains moderately fragmented. Technology giants such as Microsoft, IBM, and Oracle embed environmental modules into existing ERP, CRM, and cloud offerings, giving them stickiness among Fortune 500 accounts. Microsoft’s partnership with Global Infrastructure Partners adds AI-ready, renewables-powered data centers to its stack, illustrating how incumbents invest in physical infrastructure that aligns software performance with sustainability promises. IBM deepens Red Hat integrations so containerized workloads can surface carbon telemetry without extra agents, trimming deployment overhead.
Specialist innovators carve out niches where domain expertise trumps scale. CropX uses soil-moisture analytics to help farmers optimize irrigation, while Trace Genomics maps microbial data to fertilizer recipes. Aerones deploys robotics and AI to inspect wind-turbine blades, reducing downtime and improving annual energy production. Blockchain startups verify carbon-credit integrity, easing corporate fears of greenwashing. These focused players partner rather than compete head-to-head with full-suite vendors, stitching end-to-end ecosystems that address client pain points.
Green Technology Industry Leaders
General Electric
IBM Corporation
Microsoft Corporation
Siemens AG
Schneider Electric SE
- *Disclaimer: Major Players sorted in no particular order

Recent Industry Developments
- June 2025: Aerones raised USD 62 million to scale AI-driven wind-turbine maintenance worldwide.
- June 2025: Swap Robotics secured new funding from Silicon Ranch to expand solar-farm robotics.
- May 2025: One Power Company obtained investment to accelerate Megawatt Hub deployments for industrial clients.
- April 2025: GE Vernova posted USD 8.0 billion Q1 revenue, citing electrification demand.


Research Methodology Framework and Report Scope
Market Definitions and Key Coverage
Our study defines the green technology market as the revenue generated in a given year from software, digital platforms, and related professional services that help enterprises monitor, report, and actively cut environmental footprints across energy, water, materials, and emissions. Solutions span IoT-enabled sensors, AI analytics, cloud-based carbon accounting, digital twins, and blockchain traceability, together with implementation, integration, and ongoing advisory services.
Scope exclusion: Hardware manufacturing of solar modules, wind turbines, batteries, and carbon credit trading platforms lies outside this valuation.
Segmentation Overview
- By Component
- Solutions
- Services
- By Technology
- Internet of Things (IoT)
- Artificial Intelligence and Analytics
- Digital Twin
- Cloud Computing
- Blockchain
- Other Emerging Technologies
- By Application
- Green Building
- Carbon Footprint Management
- Air and Water Pollution Monitoring
- Weather Monitoring and Forecasting
- Crop Monitoring
- Others
- By End-user Industry
- Energy and Utilities
- Manufacturing
- Transportation and Logistics
- Agriculture
- Construction and Real-estate
- IT and Telecom
- Government and Public Sector
- Other Industries
- By Geography
- North America
- United States
- Canada
- Mexico
- South America
- Brazil
- Argentina
- Rest of South America
- Europe
- Germany
- United Kingdom
- France
- Italy
- Spain
- Rest of Europe
- Asia-Pacific
- China
- India
- Japan
- South Korea
- Australia and New Zealand
- Rest of Asia-Pacific
- Middle East and Africa
- Middle East
- Saudi Arabia
- United Arab Emirates
- Turkey
- Rest of Middle East
- Africa
- Nigeria
- South Africa
- Egypt
- Rest of Africa
- Middle East
- North America
Detailed Research Methodology and Data Validation
Primary Research
To fill gaps, our team interviewed sustainability officers at large utilities, SaaS product leads, environmental auditors, and regional system integrators across North America, Europe, and Asia Pacific. These conversations validated price bands, typical contract lengths, and usage penetration of key technologies while reconciling differing regional adoption curves.
Desk Research
We began with public data sets that give the market its broad outlines. Our desk review pulled energy-efficiency spending from the International Energy Agency, patent families from Questel that flag fast-moving digital sustainability tools, company revenue splits disclosed in SEC 10-Ks, and investment flows tracked by the UN Environment Program. Trade associations such as the Green Software Foundation, regional IT industry bodies, and policy briefs from the European Commission provided additional context on adoption triggers.
Mordor analysts also screened news wires on Dow Jones Factiva, customs shipment logs on Volza for software-loaded gateways, and project awards on Tenders Info to gauge implementation momentum. The sources listed illustrate the mix; many others fed into data checks, cross-references, and scope clarifications.
Market-Sizing & Forecasting
We built the 2025 baseline through a top-down reconstruction of enterprise sustainability software and service spending, anchored on global IT investment tables and penetration-rate assessments for target user pools, and then cross-checked with sampled vendor roll-ups of average selling price times active licenses. Inputs such as corporate ESG disclosure counts, cloud workload migration rates, renewable power purchase agreements, sustainability headcount growth, and average software spend per certified facility were layered into the model. Forecasts to 2030 rely on multivariate regression that links those drivers to macro indicators like GDP and power-sector decarbonization budgets, with scenario ranges reviewed by our primary contacts. Where bottom-up estimates were too sparse, we applied ratio benchmarks from analog software categories before final triangulation.
Data Validation & Update Cycle
Every model pass undergoes variance checks against independent indicators, followed by a two-step peer review. Material deviations trigger re-contact of expert sources. Reports refresh yearly and, before delivery, an analyst reruns the model so clients receive the newest view.
Why Our Green Technology Baseline Commands Reliability
Published numbers rarely match because firms choose dissimilar service mixes, exchange-rate cut-offs, and refresh cadences. We acknowledge those moving pieces up front.
Key gap drivers include whether services such as integration are counted, the choice between booked revenue versus contract value, and how aggressively currency shifts are smoothed. Some studies freeze inputs at prior-year rates or limit coverage to software only; others roll multiple hardware streams into one pool, inflating totals.
Benchmark comparison
| Market Size | Anonymized source | Primary gap driver |
|---|---|---|
| USD 29.45 B (2025) | Mordor Intelligence | |
| USD 25.47 B (2025) | Global Consultancy A | Excludes advisory services and applies earlier scope freeze |
| USD 20.90 B (2024) | Industry Journal B | Omits post-implementation support and uses aggressive currency conversion |
| USD 28.13 B (2025) | Regional Consultancy C | Limits geography to three regions and inflates growth via single-scenario forecast |
The comparison shows that when scope, geography, and service coverage differ, totals diverge quickly. By selecting clear boundaries, updating datasets every year, and validating both top-down and bottom-up cues, Mordor Intelligence delivers a balanced, transparent baseline that decision makers can trace back to observable variables and repeatable steps.


Key Questions Answered in the Report
What is the current size of the green technology market?
The green technology market size is USD 36.24 billion in 2026 and is forecast to reach USD 102.26 billion by 2031.
Which component segment leads the green technology market?
Solutions dominate with 77.35% of green technology market share in 2025, reflecting buyer preference for unified platforms.
Which technology is growing fastest within the green technology industry?
Blockchain is the fastest-growing technology segment with a 25.4% CAGR, driven by demand for transparent carbon-credit verification.
What region is expanding most rapidly?
Asia-Pacific shows the quickest expansion at a 23.8% CAGR through 2031 due to industrial growth paired with stricter regulations.
Page last updated on:


