PropTech Market Size and Share
Market Overview
| Study Period | 2020 - 2031 |
|---|---|
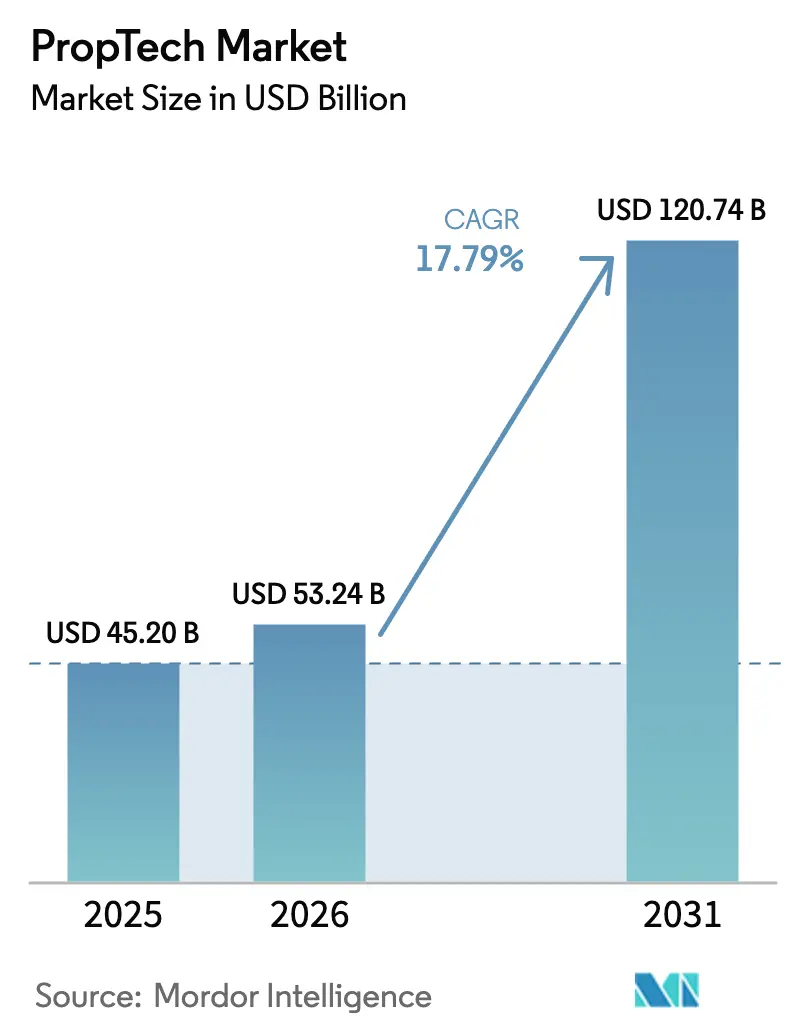
| Market Size (2026) | USD 53.24 Billion |
| Market Size (2031) | USD 120.74 Billion |
| Growth Rate (2026 - 2031) | 17.79% CAGR |
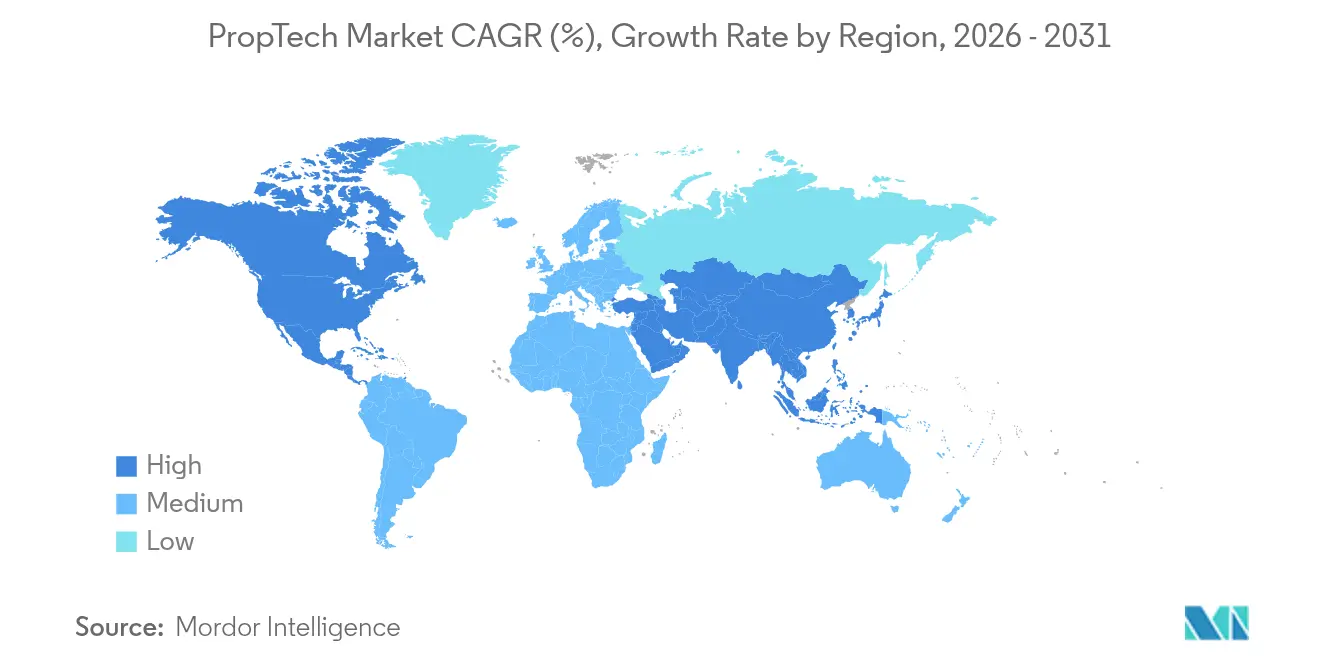
| Fastest Growing Market | Asia Pacific |
| Largest Market | North America |
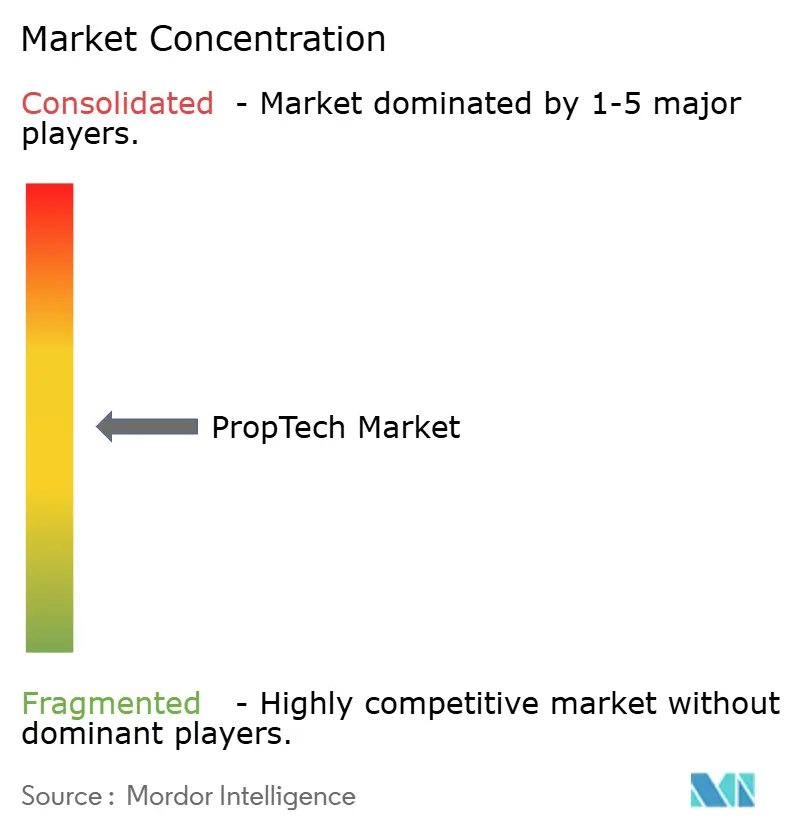
| Market Concentration | Medium |
Major Players *Disclaimer: Major Players sorted in no particular order Image © Mordor Intelligence. Reuse requires attribution under CC BY 4.0. | |
PropTech Market Analysis by Mordor Intelligence
PropTech market size in 2026 is estimated at USD 53.24 billion, growing from 2025 value of USD 45.20 billion with 2031 projections showing USD 120.74 billion, growing at 17.79% CAGR over 2026-2031. Tighter ESG disclosure rules, rising institutional allocations that exceeded USD 1.1 billion in dedicated funds during 2024, and the large-scale roll-out of IoT building systems are the principal growth catalysts. Commercial real-estate owners now cut operating costs by up to 30% after deploying integrated building-management and analytics platforms. Cloud deployment dominates as 78% of users favor the scalability and anytime access benefits of SaaS architectures. Growing reliance on outcome-based service models is reshaping revenue streams, while industrial and logistics assets show the quickest adoption as warehouse automation gains traction.
Key Report Takeaways
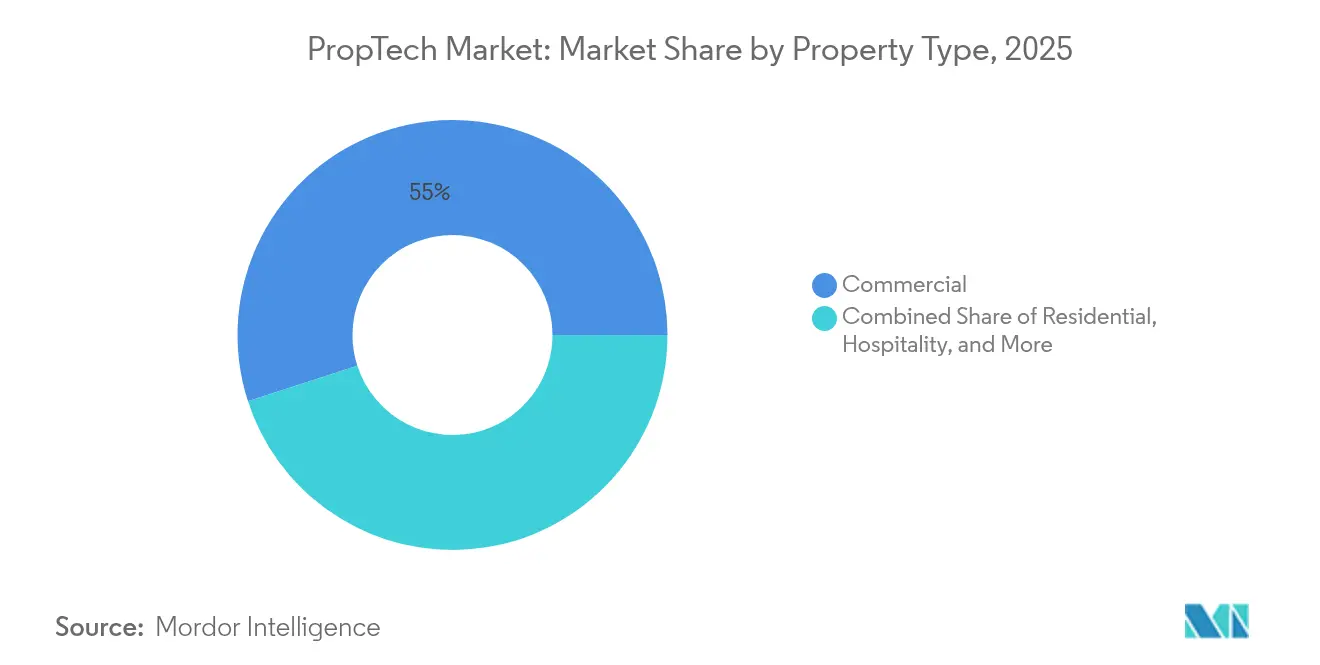
- By property type, commercial assets held 54.98% of PropTech market share in 2025; industrial and logistics is expected to expand at a 16.92% CAGR through 2031.
- By solution, software platforms accounted for 66.85% share of the PropTech market size in 2025, while services are projected to grow at a 16.15% CAGR.
- By deployment, cloud models secured 77.35% share of the PropTech market in 2025; hybrid deployment is forecast to post a 20.10% CAGR to 2031.
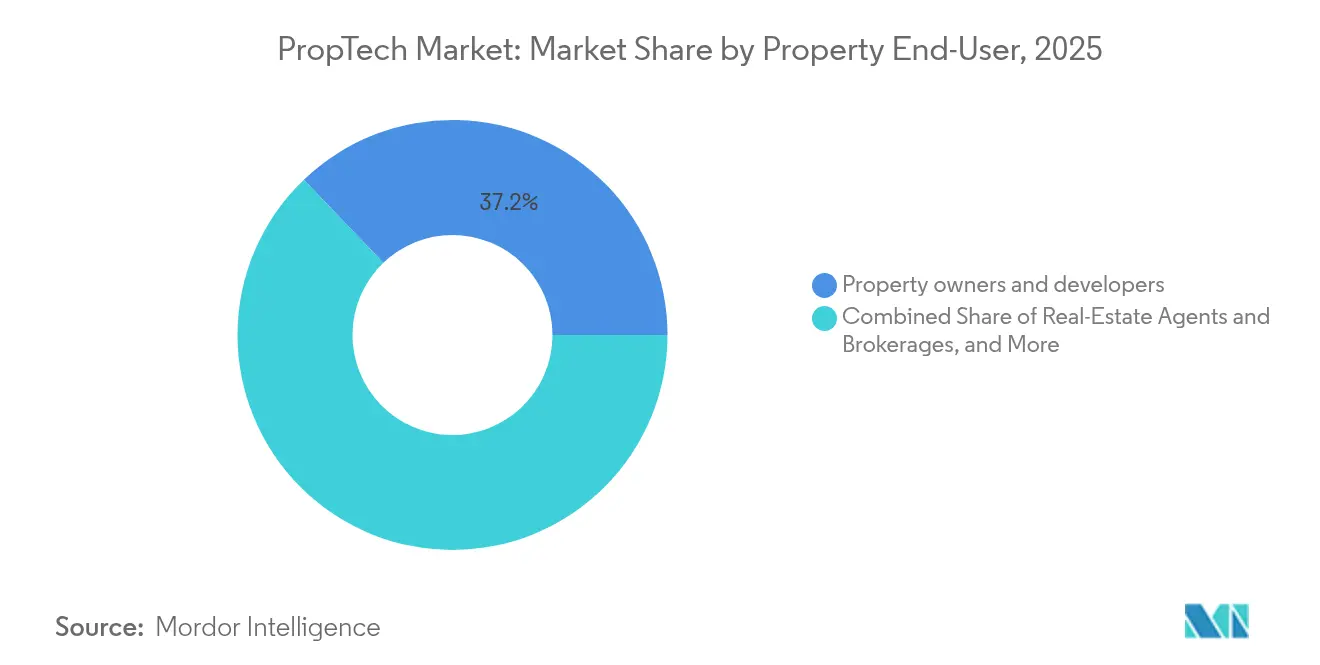
- By end-user, property owners commanded 37.15% of PropTech market size in 2025; facility managers lead growth at 18.05% CAGR.
- By technology, IoT and sensors contributed 40.88% share of the PropTech market in 2025; AR/VR and digital twins are advancing fastest at 23.05% CAGR.
- By geography, North America led with 36.29% share of PropTech market in 2025; Asia-Pacific is projected to record a 15.02% CAGR through 2031.
Note: Market size and forecast figures in this report are generated using Mordor Intelligence’s proprietary estimation framework, updated with the latest available data and insights as of 2026.
Global PropTech Market Trends and Insights
Driver Impact Analysis*
| Driver | (~) % Impact on CAGR Forecast | Geographic Relevance | Impact Timeline |
|---|---|---|---|
| Digital transformation imperative in real-estate operations | +3.2% | Global, with North America and Europe leading adoption | Medium term (2-4 years) |
| Rapid adoption of smart and connected buildings | +2.8% | Global, concentrated in developed markets | Short term (≤ 2 years) |
| Rising investments from institutional real-estate funds | +2.1% | North America, Europe, Asia-Pacific core markets | Medium term (2-4 years) |
| Mandatory ESG data-reporting pushing analytics platforms | +1.9% | Europe and North America primarily, expanding to Asia-Pacific | Long term (≥ 4 years) |
| Insurance-backed rent-guarantee platforms lowering default risk | +1.4% | North America and Europe, emerging in Asia-Pacific | Medium term (2-4 years) |
| Growing demand for digital twins in zoning-approval processes | +1.1% | Global, with early adoption in smart city initiatives | Long term (≥ 4 years) |
| Source: Mordor Intelligence | |||
Digital transformation imperative in real-estate operations
AI-driven leasing engines improve lead-to-lease conversions by 85%, reshaping marketing and tenant management economics. PropTech platforms act as a control hub, unifying energy, occupancy, and tenant communication data on a single dashboard to unlock portfolio-wide optimization. Hybrid work trends sustain demand for space-usage analytics that inform flexible leasing strategies. As a result, enterprises allocate larger technology budgets to platforms that provide immediate, quantifiable ROI.
Rapid adoption of smart and connected buildings
Smart building technologies have progressed from perk to necessity, with modern commercial structures integrating more than 8,000 real-time data points covering air quality, occupancy, and equipment health [1]Buildings IOT, “Integrated Building Management Case Studies,” buildingsiot.com. Automated energy controls slash utility expenses and improve sustainability ratings required for green financing. Data richness also feeds advanced analytics engines that predict space demand and inform layout changes without costly retrofits. Consequently, connected-building adoption is accelerating, especially among large portfolios seeking uniform performance metrics.
Rising investments from institutional real-estate funds
Dedicated PropTech vehicles attracted more than USD 1.1 billion in fresh capital during 2024, underscoring a strategic pivot from optional experimentation to mandatory capability building. Investors concentrate on firms with proven unit economics that address ESG compliance, energy efficiency, and tenant-experience priorities. Growth-stage funding now eclipses seed activity, signaling sector maturity and a preference for scale-ready platforms. The investment wave also speeds consolidation, enabling well-capitalized players to acquire niche specialists and assemble full-stack solutions. This institutional endorsement reduces perceived adoption risk for cautious property owners.
Mandatory ESG data-reporting pushing analytics platforms
Regulations such as New York City’s Local Law 97 and the EU Energy Performance of Buildings Directive impose measurable carbon caps that expose non-compliant portfolios to penalties and valuation risk [2]Cohesion, “Local Law 97 Compliance Guide,” cohesionib.com. Platforms from BuildingMinds and Enertiv now automate utility data capture and benchmark emissions against standards such as GRESB or SFDR. Real-time dashboards help owners meet disclosure deadlines and support financing tied to sustainability metrics. Because green performance directly influences tenant demand and asset pricing, analytics adoption has shifted from discretionary to essential capital protection.
Restraint Impact Analysis*
| Restraint | (~) % Impact on CAGR Forecast | Geographic Relevance | Impact Timeline |
|---|---|---|---|
| Fragmented regulations and compliance burdens | -2.1% | Global, particularly complex in Europe and Asia-Pacific | Long term (≥ 4 years) |
| Cyber-security and data-privacy concerns | -1.8% | Global, with stricter enforcement in Europe and California | Medium term (2-4 years) |
| Land-registry data quality hindering blockchain pilots | -1.2% | Emerging markets primarily, some developed market challenges | Long term (≥ 4 years) |
| Escalating cloud-usage fees squeezing unit-economics | -0.9% | Global, affecting SaaS-based PropTech providers | Short term (≤ 2 years) |
| Source: Mordor Intelligence | |||
Fragmented regulations and compliance burdens
PropTech firms incur rising legal costs as data-protection, tenant-rights, and building-safety rules diverge across jurisdictions, slowing cross-border scaling strategies. Blockchain-based asset tokenization faces unclear securities classifications that vary by market, delaying pilot conversions into commercial roll-outs. Compliance teams must continually reinterpret evolving statutes, pulling resources from product innovation. For global portfolios this complexity multiplies, forcing parallel system customizations that inflate deployment timelines and dampen perceived technology benefits.
Cyber-security and data-privacy concerns
Smart buildings with thousands of connected points offer extensive intrusion surfaces; compromised HVAC or access-control systems can trigger costly outages. Tenant data collection—from occupancy patterns to personal preferences—raises privacy questions under GDPR and CCPA. Deploying end-to-end encryption, zero-trust networks, and granular consent tools elevates operating costs for PropTech vendors. Fear of breaches slows adoption among risk-averse owners who require third-party audits and cyber-insurance before signing multi-year contracts.
*Our forecasts treat driver/restraint impacts as directional, not additive. The impact forecasts reflect baseline growth, mix effects, and variable interactions.
Segment Analysis
By Property Type: Commercial Dominance Drives Innovation
Commercial properties contributed 54.98% share of PropTech market in 2025, reflecting their sizable floor areas and complex systems that benefit most from integrated analytics. The segment leads spending as owners target operating-cost reductions that can reach 30% within two years, particularly through HVAC optimization and predictive maintenance. High-rise offices deploy digital visitor management and occupancy tracking to support flexible leasing and wellness certifications. Industrial and logistics properties, posting a 16.92% CAGR, implement real-time inventory tracking, autonomous robotics, and computer-vision safety monitoring that integrate with broader warehouse-management suites.
Residential adoption progresses through smart-home hubs, unified payment portals, and AI leasing assistants. Hospitality assets focus on contactless check-in and dynamic rate algorithms that respond to local demand signals. Across categories, virtual design and 3D capture allow stakeholders to identify construction clashes early, limiting expensive rework. AI spatial analytics help owners rearrange layouts in response to hybrid work patterns, maximizing revenue per square foot. The commercial cohort’s budget latitude and clear ROI continue to anchor the wider PropTech market.


By Solution: Software Platforms Lead Market Evolution
Software platforms held 66.85% share of PropTech market in 2025 as owners demanded consolidated dashboards that harmonize finance, operations, and tenant-engagement data. Cloud architectures lower upfront costs and enable rapid cross-portfolio roll-outs, making license fees predictable. Analytics modules powered by machine learning boost equipment uptime by 40–60% compared with manual processes, strengthening the business case.
Services revenues, expanding at 16.15% CAGR, indicate owners’ appetite for outcome-based contracts tied to energy savings or tenant-satisfaction metrics. Providers bundle advisory, implementation, and continuous optimization, creating stickier client relationships and recurring cash flows. The shift from pure licensing to managed performance underscores a maturing PropTech industry stance that favors long-term partnerships over transactional sales.
By Deployment: Cloud Infrastructure Drives Scalability
Cloud infrastructure captured 77.35% share of PropTech market in 2025 due to its elasticity and around-the-clock accessibility. Pandemic-era remote operations validated SaaS resilience, and many portfolios now prefer browser-based control rooms that synchronize global assets. Automatic feature upgrades and centralized security patches further lift adoption.
Hybrid deployment, advancing at 20.10% CAGR, blends cloud analytics with local edge gateways that handle latency-sensitive functions such as life-safety controls. This configuration satisfies data-sovereignty statutes while preserving scalability for non-critical workloads. On-premise stacks persist in highly regulated facilities but face shrinking share as cloud security certifications broaden acceptance.
By End-User: Property Owners Lead Adoption
Property owners and developers accounted for 37.15% of PropTech market size in 2025, driven by direct exposure to operating costs, asset valuations, and tenant churn. They prioritize solutions that demonstrate measurable savings and rent premiums. Developers increasingly integrate smart-building features at the blueprint stage to secure green financing and boost presale marketing.
Facility managers show the fastest expansion at 18.05% CAGR as their role elevates from maintenance to strategic performance guardian. IoT dashboards alert teams before faults escalate, shifting maintenance budgets from reactive repairs to planned interventions. Real-estate brokers adopt AI-powered listing and transaction tools that compress deal cycles, while REITs rely on unified data models for portfolio benchmarking.
By Technology: IoT Sensors Drive Current Value
IoT and sensors delivered 40.88% share of PropTech market in 2025 thanks to quick payback periods. Sub-metering, smart thermostats, and occupancy sensors feed analytics engines that pinpoint inefficiencies. Payback windows of 12–18 months justify rapid portfolio deployment.
AR/VR and digital twins rise at a 23.05% CAGR, enabling immersive design collaboration, remote property tours, and predictive scenario modeling. When linked to live sensor feeds, twins evolve into operational command centers that forecast energy peaks or tenant turnover risks. Blockchain sees cautious pilots for title verification and fractional ownership as clarity on legal frameworks progresses.
Geography Analysis
North America retained 36.29% share of PropTech market in 2025, supported by regulations such as Local Law 97 that embed technology mandates into building codes cohesionib.com. Venture investors committed over USD 2 billion to regional PropTech companies in 2024, reinforcing a robust funding pipeline for AI and building-automation innovators creti.org. Large metropolitan hubs offer dense customer bases willing to pilot next-generation capabilities, accelerating feedback loops and platform refinement. Nevertheless, labor shortages and elevated construction costs oblige technology providers to demonstrate clear productivity offsets.
Asia-Pacific is forecast to post a 15.02% CAGR to 2031, led by China, which has attracted 41% of global PropTech investment since 2013. Rapid urbanization fuels demand for asset management efficiency, while national smart-city programs supply policy incentives and infrastructure grants. Singapore operates as a regional launchpad owing to transparent regulation and talent depth, whereas Japan and South Korea champion robotics-heavy buildings that set performance benchmarks for neighboring markets.
Europe displays strong momentum as stringent sustainability frameworks push owners toward data-driven compliance. Energy Performance Certificates and impending CSRD rules elevate analytics adoption within commercial and residential portfolios. The United Kingdom maintains its innovation status with prop-cluster initiatives despite post-Brexit uncertainty; France and the Netherlands accelerate energy-efficiency retrofits backed by green-bond financing. Specialized vendors focusing on ESG and automation gain traction as European owners race to meet 2030 carbon targets.

Competitive Landscape
PropTech competition remains moderately fragmented, yet consolidation is accelerating. CoStar’s USD 1.6 billion acquisition of Matterport in February 2025 joined property data with 3D digital-twin technology, signalling a platform-centric direction [3]CoStar Group, “CoStar Completes Matterport Acquisition,” costargroup.com. Active start-up counts exceed 1,000 in Germany alone, but acquirers increasingly target specialists in AI leasing, facility robotics, and climate-risk analytics that complement portfolio solutions.
AI capability is the central differentiator. Vendors tout machine-learning engines that pattern-match utility spikes or predict tenant churn, enabling demonstrable ROI within 12–18 months. Platform breadth now outstrips point-solution novelty as owners favor end-to-end suites that minimize integration friction.
White-space opportunities persist in industrial automation, senior-living support, and climate-resilience modeling. Intellectual-property filings in building automation and predictive analytics climbed 40% year on year, indicating intensifying research and devlopment race [4]USPTO, “Patent Trends in Building Automation 2025,” uspto.gov. Firms that marry domain expertise with outcome guarantees are poised to command premium valuations as the PropTech market matures.
PropTech Industry Leaders
CoStar Group Inc.
RealPage Inc.
Opendoor Technologies Inc.
Procore Technologies Inc.
Matterport Inc.
- *Disclaimer: Major Players sorted in no particular order

Recent Industry Developments
- April 2025: PropTechBuzz launched the India PropTech Portal to fast-track innovation and investment across the country’s USD 1 trillion real-estate sector.
- April 2025: T3RRA announced its forthcoming global public launch with USD 2 billion in tokenized real estate accessible to verified users in more than 70 countries.
- February 2025: CoStar Group completed its USD 1.6 billion acquisition of Matterport, merging 3D digital-twin technology with extensive commercial property data.
- December 2024: Dcycle raised EUR 6 million (USD 6.3 million) for its ESG data-management platform, underlining investor demand for compliance-focused PropTech.


Research Methodology Framework and Report Scope
Market Definitions and Key Coverage
Our study defines the PropTech market as the aggregate revenue generated by software platforms and associated services that digitize any stage of the real-estate life cycle, including search, financing, construction oversight, asset management, tenant engagement, analytics, and disposition, across residential, commercial, industrial logistics, and hospitality assets worldwide. According to Mordor Intelligence, the baseline year 2025 value stands at USD 45.20 billion.
Scope exclusion: Pure-play construction robotics and generic fintech offerings not anchored to property transactions are excluded.
Segmentation Overview
- By Property Type
- Residential
- Commercial
- Industrial and Logistics
- Hospitality
- By Solution
- Software
- Services
- By Deployment
- Cloud
- On-Premise
- Hybrid
- By End-User
- Property Owners and Developers
- Real-Estate Agents and Brokerages
- Facility Managers
- Housing Associations and REITs
- By Technology
- IoT and Smart-Sensor Networks
- AI / Big-Data Analytics
- AR / VR and Digital Twins
- Blockchain and DLT
- By Geography
- North America
- United States
- Canada
- Mexico
- South America
- Brazil
- Argentina
- Rest of South America
- Europe
- Germany
- United Kingdom
- France
- Italy
- Spain
- Russia
- Rest of Europe
- Asia-Pacific
- China
- Japan
- India
- South Korea
- Australia and New Zealand
- Rest of Asia-Pacific
- Middle East and Africa
- Middle East
- Saudi Arabia
- United Arab Emirates
- Turkey
- Rest of Middle East
- Africa
- South Africa
- Nigeria
- Egypt
- Rest of Africa
- Middle East
- North America
Detailed Research Methodology and Data Validation
Primary Research
Our analysts conduct semistructured interviews and online surveys with PropTech founders, facility managers, real-estate brokers, and regional venture investors across North America, Europe, Asia-Pacific, and the GCC. These conversations validate pricing corridors, usage ratios, and payback periods that secondary sources rarely quantify, giving us confidence to refine inputs and stress test early model outputs.
Desk Research
We start with structured desk work that pulls building stock and transaction data from tier-1 public sources such as the National Association of Realtors, U.S. Census Building Permits, Eurostat property price indices, and UN Comtrade shipment codes for smart sensor imports, which help us size technology penetration. Macro indicators, including GDP, urbanization, and broadband subscriptions, are captured from the World Bank and IMF to anchor adoption ceilings.
These fundamentals are enriched with company filings, investor presentations, and curated news on Dow Jones Factiva, while Questel patent analytics signal emerging tech intensity and D&B Hoovers provides revenue splits for key vendors. The sources named are illustrative; many additional open datasets and regulatory portals are consulted for cross-checks and context building.
Market-Sizing & Forecasting
A top-down model reconstructs demand by multiplying total real-estate transaction value and managed floor space with observed digital spend ratios, followed by selective bottom-up vendor roll-ups to sanity check totals. Key variables include cloud adoption rate in property management, average monthly SaaS fee per asset, venture capital inflows, building completions, and regulatory pushes for energy monitoring. Gaps in bottom-up data, especially from private start-ups, are bridged using sampled ASP multiplied by user cohorts gathered during primary work.
For forecasting to 2030, we apply a multivariate ARIMA, letting the above drivers plus interest rate scenarios shape growth trajectories; coefficients are reviewed with industry experts before lock-in.
Data Validation & Update Cycle
Every quarter, our team reruns variance checks between model outputs and fresh indicators, including fund raising tallies, smart meter installations, and cloud bills from listed landlords. An anomaly triggers a secondary analyst review, and material shifts prompt an interim refresh; otherwise, the full model is rebuilt annually so clients always receive an up-to-date view.
Why Our PropTech Baseline Commands Reliability
Published PropTech estimates often diverge because firms choose different asset buckets, pricing assumptions, and refresh cadences. We acknowledge these gaps upfront so decision makers can judge which number aligns with their need.
Key gap drivers include whether industrial logistics space is counted, if blockchain-enabled transaction fees are booked as market revenue, currency conversion years, and the speed at which analysts assume on-premise users shift to cloud. Mordor's disciplined scope selection, annual refresh, and dual-track validation curb these distortions.
Benchmark comparison
| Market Size | Anonymized source | Primary gap driver |
|---|---|---|
| USD 45.20 B (2025) | Mordor Intelligence | - |
| USD 36.55 B (2024) | Global Consultancy A | Excludes hybrid deployments; older FX base year |
| USD 47.08 B (2025) | Global Consultancy B | Applies uniform ASPs across asset classes; limited primary checks |
| USD 44.88 B (2025) | Regional Advisory C | Omits blockchain transaction fees; counts only subscription software |
The comparison shows that variations stem less from arithmetic and more from scope discipline and data freshness. By grounding inputs in verifiable public series, validating them with domain insiders, and refreshing yearly, Mordor Intelligence delivers a balanced baseline that clients can trace, replicate, and defend internally.


Key Questions Answered in the Report
What is the current size of the PropTech market?
The PropTech market stands at USD 53.24 billion in 2026 and is projected to reach USD 120.74 billion by 2031.
Which property segment leads PropTech adoption?
Commercial assets hold 54.98% of PropTech market share, driven by integrated building-management and analytics deployments.
Why are cloud deployments dominant in PropTech?
Cloud models account for 77.35% of the market because they offer easy scalability, automatic updates, and remote portfolio oversight.
How fast is the Asia-Pacific PropTech market growing?
Asia-Pacific is forecast to expand at a 15.02% CAGR through 2031, led by China’s strong investment inflows and smart-city programs.
What impact do ESG regulations have on PropTech uptake?
Mandatory carbon-reporting frameworks such as Local Law 97 and EU directives make analytics platforms essential for compliance and valuation protection.
Which technology is growing quickest within PropTech?
AR/VR and digital-twin solutions are advancing at a 23.05% CAGR as owners adopt immersive design and predictive operations tools.
Page last updated on:


