Control Tower Market Size and Share
Market Overview
| Study Period | 2020 - 2031 |
|---|---|
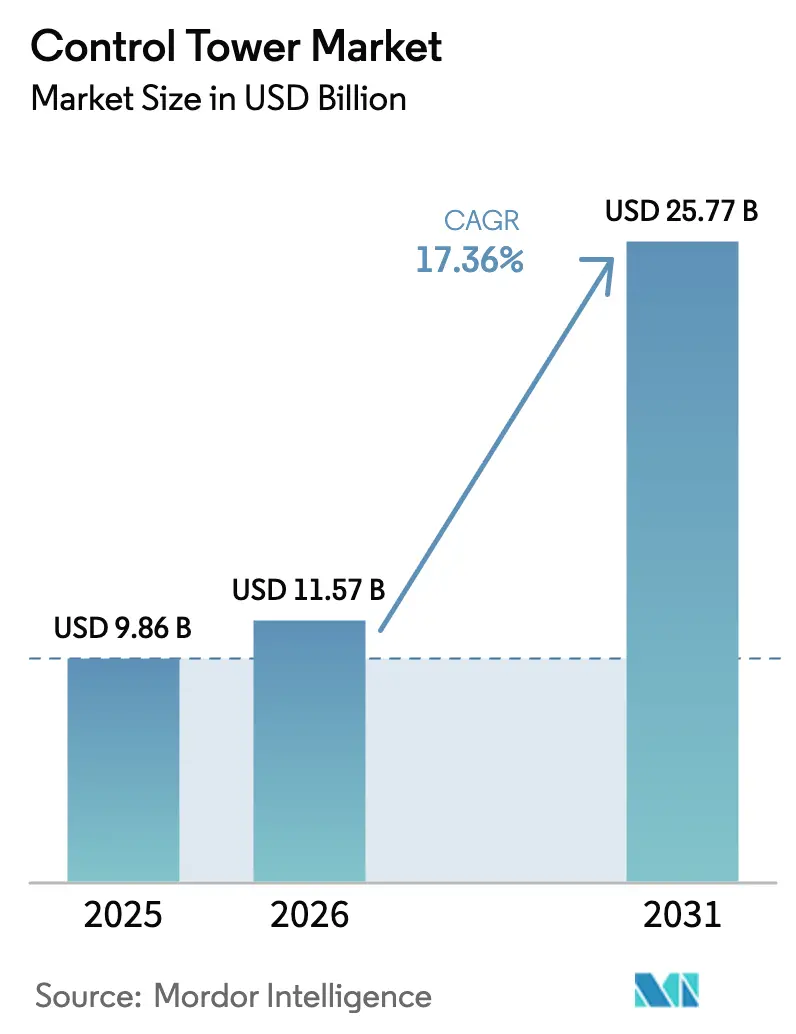
| Market Size (2026) | USD 11.57 Billion |
| Market Size (2031) | USD 25.77 Billion |
| Growth Rate (2026 - 2031) | 17.36% CAGR |
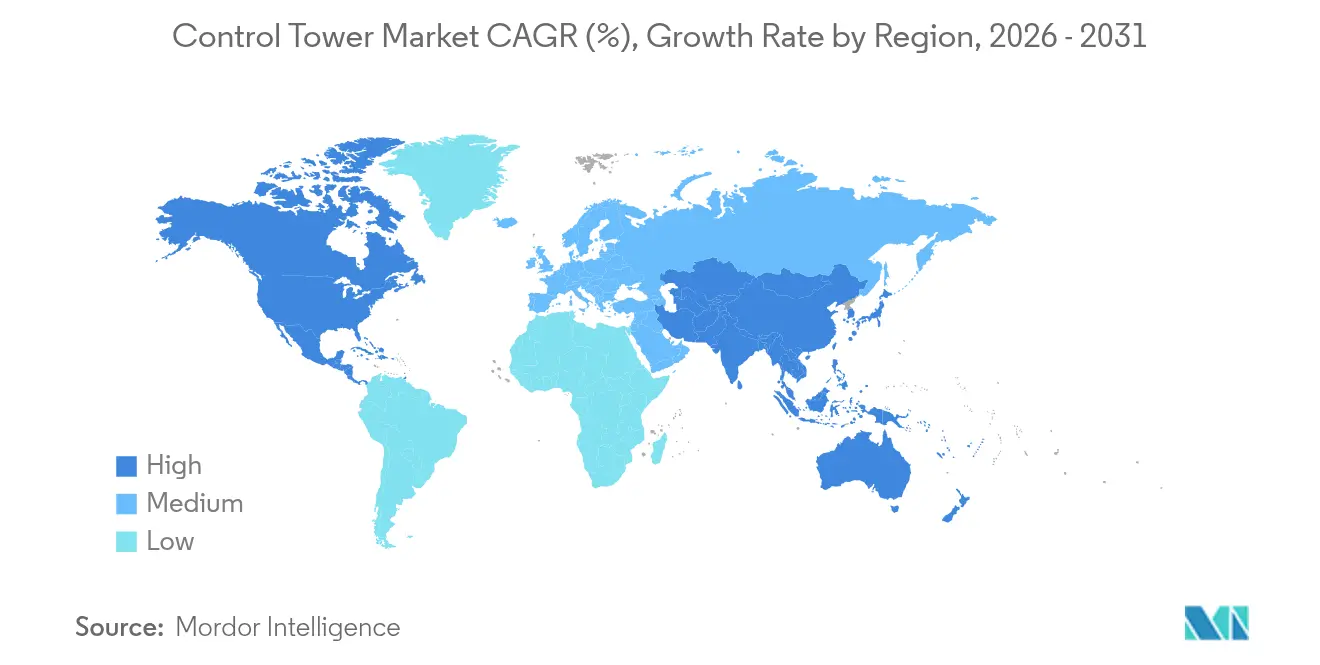
| Fastest Growing Market | Asia Pacific |
| Largest Market | North America |
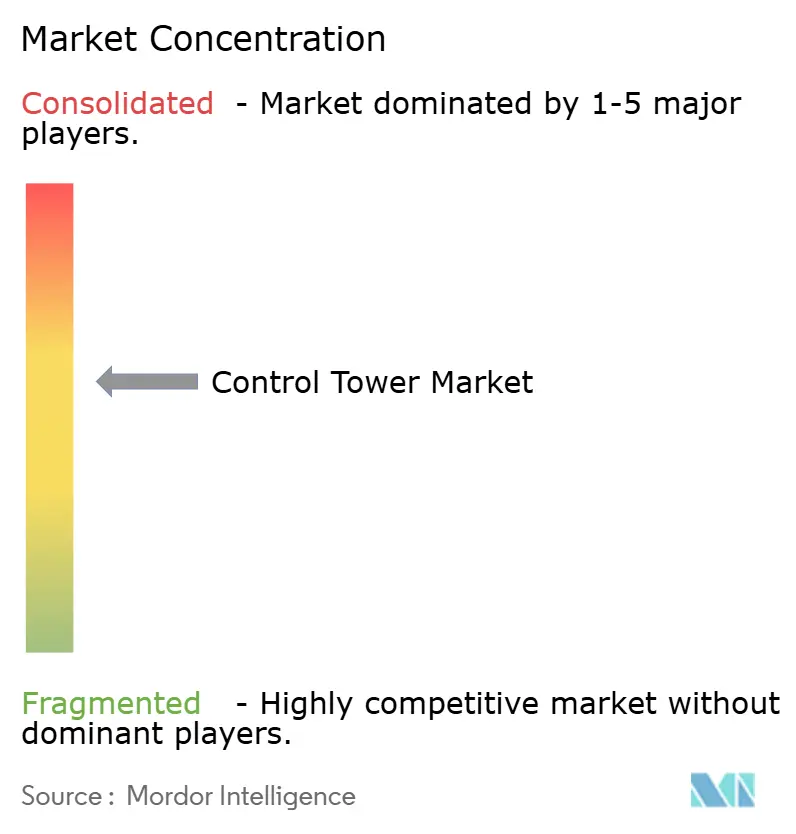
| Market Concentration | Medium |
Major Players *Disclaimer: Major Players sorted in no particular order Image © Mordor Intelligence. Reuse requires attribution under CC BY 4.0. | |
Control Tower Market Analysis by Mordor Intelligence
The control tower market size was valued at USD 9.86 billion in 2025 and estimated to grow from USD 11.57 billion in 2026 to reach USD 25.77 billion by 2031, at a CAGR of 17.36% during the forecast period (2026-2031). The expansion is powered by enterprises racing to digitize supply chains after material cost spikes and geopolitical disruptions exposed the limits of legacy visibility tools. Commercial pilots that blend quantum‐optimized simulations with generative-AI copilots now automate multi-tier risk sensing, shrinking reaction times from days to minutes[1] IBM, “Quantum-Accelerated Supply Chain Optimization,” ibm.com. Semiconductor shortages and raw-material inflation lifted automotive input costs by 15-20% in 2024, prompting manufacturers to adopt predictive analytics that model disruption scenarios before they hit the plant floor. In parallel, retail omnichannel growth, cold-chain compliance in life sciences, and government trade-digitalization initiatives across Asia-Pacific are widening the addressable base for control-tower deployments.
Key Report Takeaways
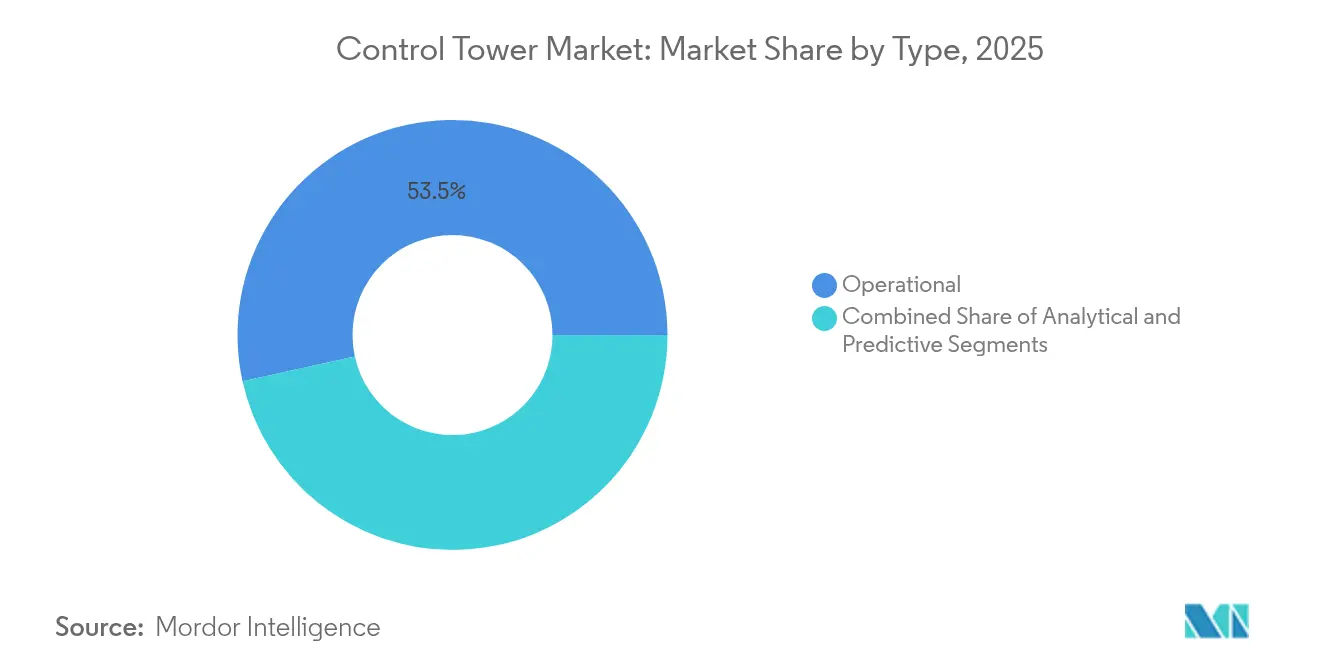
- By type, the operational segment led with 53.45% of control tower market share in 2025, while end-to-end predictive solutions are set to surge at a 17.40% CAGR through 2031.
- By component, software accounted for 66.15% of the control tower market size in 2025; services are accelerating at 15.21% CAGR to 2031.
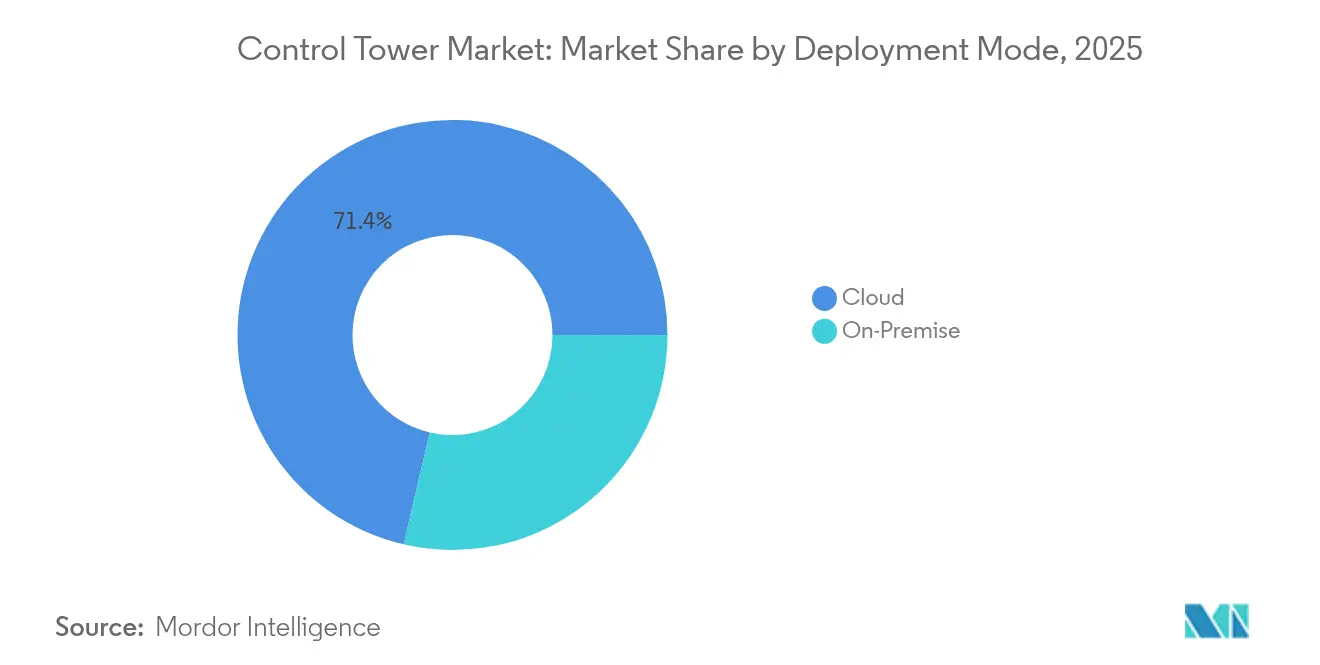
- By deployment mode, the cloud model captured 71.35% of the control tower market size in 2025 and is expanding at 14.86% CAGR through 2031.
- By end-user industry, retail and e-commerce held 27.12% of the control tower market size in 2025, while healthcare and life sciences will grow the fastest at 16.42% CAGR.
- By geography, North America commanded 38.45% revenue share in 2025, whereas Asia-Pacific is advancing at a 13.18% CAGR to 2031.
Note: Market size and forecast figures in this report are generated using Mordor Intelligence’s proprietary estimation framework, updated with the latest available data and insights as of 2026.
Global Control Tower Market Trends and Insights
Drivers Impact Analysis*
| Driver | (~) % Impact on CAGR Forecast | Geographic Relevance | Impact Timeline |
|---|---|---|---|
| Supply-chain visibility imperative | +3.2% | Global | Medium term (2-4 years) |
| Transition to cloud-based SCM suites | +2.8% | North America and EU; APAC adoption | Short term (≤ 2 years) |
| Rise of omni-channel retail logistics | +2.1% | Global; urban markets | Medium term (2-4 years) |
| GenAI copilots for multi-tier risk sensing | +1.9% | North America and EU | Long term (≥ 4 years) |
| Semiconductor-shortage lessons driving digital nerve-centres | +1.6% | Asia-Pacific automotive hubs | Short term (≤ 2 years) |
| Quantum-optimised route simulations piloted by automakers | +0.8% | Germany, Japan, US clusters | Long term (≥ 4 years) |
| Source: Mordor Intelligence | |||
Supply-Chain Visibility Imperative
Executives now view end-to-end transparency as the first line of defense after the semiconductor crisis triggered USD 210 billion in lost automotive revenue between 2021-2022. Modern control tower market platforms stitch IoT telemetry, blockchain traceability, and predictive analytics into one pane of glass, slashing expedited freight. Renault Group’s European control tower trimmed premium shipments by 50% across 6,000 daily loads[3]Supply Chain Brain, “Renault’s AI-Powered Control Tower Halves Expedited Deliveries,” supplychainbrain.com.
Transition to Cloud-Based SCM Suites
Shifting from on-premise to cloud saves 25-40% in IT overhead and unlocks real-time collaboration with partners that were previously siloed. API-first architectures in the control tower market route orders dynamically between stores, warehouses, and drop-ship vendors; yet EU data-sovereignty rules force many firms to deploy localized clouds, foreshadowing a multi-cloud future with 45% of supply chains running autonomously by 2035.
Rise of Omni-Channel Retail Logistics
Same-day delivery norms have turned inventory allocation into a moving target. Control tower market engines orchestrate stock across stores, dark warehouses, and 3PLs, preventing stockouts in hot zones while curbing dead stock elsewhere. Retail247’s Archean.OMS improved order-routing precision and cut fulfilment cost via its cloud-native backbone.
GenAI Copilots for Multi-Tier Risk Sensing
Generative AI strips complexity from scenario analysis through conversational interfaces. Blue Yonder’s 2025 AI agents interrogate news, weather, and social chatter to flag supply shocks before they crystallize, while simulating thousands of alternatives on the fly. Governance gaps around explainability linger, especially in regulated verticals, yet early adopters report drastic cycle-time reductions.
Restraint Impact Analysis*
| Restraint | (~) % Impact on CAGR Forecast | Geographic Relevance | Impact Timeline |
|---|---|---|---|
| High implementation and data-harmonisation costs | -2.4% | Global; SME pain‐points | Short term (≤ 2 years) |
| Cyber-security and data-sovereignty concerns | -1.8% | EU, China, regulated sectors | Medium term (2-4 years) |
| Explainability gaps in AI-driven recommendations | -1.1% | Regulated industries | Long term (≥ 4 years) |
| Scarcity of digital logisticians and change-fatigue | -0.9% | Global traditional firms | Medium term (2-4 years) |
| Source: Mordor Intelligence | |||
High Implementation and Data-Harmonization Costs
Enterprise roll-outs can cost USD 2-15 million, with up to 60% earmarked for cleansing ERP, WMS, and supplier-portal data that arrive in incompatible formats. Johnson Controls linked 14 sites and 800 suppliers, highlighting scale and spend required. SMEs struggle because outlays can equal 3-5% of annual revenue, widening the digital divide inside the control tower market.
Cyber-Security and Data-Sovereignty Concerns
Logistics saw 27 cyber incidents from July 2023-July 2024, and the security software segment is climbing from USD 8.4 billion in 2024 to USD 36.6 billion by 2037. China’s localization rules and the EU’s sovereignty push compel hybrid architectures that fracture visibility and inflate compliance costs. Competitive intelligence risks rise too, as consolidated supply data can reveal sourcing secrets.
*Our forecasts treat driver/restraint impacts as directional, not additive. The impact forecasts reflect baseline growth, mix effects, and variable interactions.
Segment Analysis
By Type: Operational Dominance Drives Market Foundation
Operational platforms anchored 53.45% of 2025 revenue, confirming that many firms still focus on real-time exception handling rather than autonomy. These dashboards pull live feeds from TMS, WMS, and supplier APIs to coordinate actions. Their lower complexity and faster ROI made them the on-ramp for the control tower market. End-to-end predictive suites, however, are scaling at a 17.40% CAGR as algorithms mature and quantum optimisation becomes commercially viable. Analytical towers that mine historical data serve as the midway step toward full autonomy.
A widening set of manufacturers now pilots predictive towers that pre-build contingency plans. Software bots recalculate production schedules when an upstream delay is detected, approving alternate suppliers without human interference. In automotive, this capability offsets lingering chip shortages. As more firms graduate to predictive modes, the control tower market size for these advanced suites is set to multiply, pulling integration partners into long-term contracts.


By Component: Software Leadership Faces Services Acceleration
Software still supplied 66.15% of 2025 spending, reflecting the capital intensity of platform development. Vendors such as IBM and SAP embed AI engines that guide planners toward optimal inventory and transport decisions. Subscription pricing and the ecosystem lock-in keep renewal rates high.
Services, however, are climbing at 15.21% CAGR as complexity proves that technology alone is insufficient. Consultants configure data models, run change-management workshops, and build custom workflows that mirror unique operating procedures. Unilever’s four-year “operations metaverse” underscores how process re-design and cultural shifts outweigh code in determining outcomes. As more companies chase autonomy, services revenue will command a rising share of the control tower market size.
By Deployment Mode: Cloud Supremacy Continues Despite Sovereignty Concerns
Cloud-hosted deployments captured 71.35% of 2025 spend by offering elastic compute, automatic upgrades, and lighter capital requirements. API-first architectures speed partner onboarding, a necessity when omnichannel demand swings unpredictably. Major hyperscale’s now bundle supply-chain modules, keeping total cost of ownership low.
Regulated industries still keep sensitive datasets on premise or at the edge, triggering hybrid designs that partition data yet preserve unified dashboards. Sovereignty regulations in Europe and China are steering multinationals toward regional clouds, but cost-benefit math continues to favor remote infrastructure. Consequently, cloud will remain the preferred foundation for the control tower market even as policy pressures grow.
By End-User Industry: Retail Leadership Challenged by Healthcare Acceleration
Retail and e-commerce controlled 27.12% of 2025 revenue, the direct result of next-day delivery promises that demand granular inventory orchestration. As consumer expectations normalize, retailers rely on AI engines to balance speed against cost, reducing markdowns from mis-allocated stock.
Healthcare and life sciences sit on the fastest-growing trajectory at 16.42% CAGR. Pfizer’s vaccine roll-out showcased 99% service‐level performance through GPS loggers and AI alerts across ultra-cold lanes. Regulatory pressure for chain-of-custody evidence keeps adoption strong. Automotive and industrial firms add momentum as they erect digital nerve-centers to weather chip shortages, while food and beverage brands implement traceability for allergen recalls. Each use-case broadens the control tower market.
Geography Analysis
North America’s 38.45% revenue share in 2025 underscores its early-mover status. Established software ecosystems and regulatory mandates, particularly in pharmaceuticals and food safety, cement pervasive use of control towers. The United States leads adoption thanks to its dense base of platform vendors, while Canada and Mexico seek granular oversight to navigate USMCA trade protocols. Growth moderates as firms refine rather than initiate deployments, yet AI and quantum pilots keep the region at the innovation frontier of the control tower market.
Asia-Pacific’s 13.18% CAGR through 2031 reflects manufacturers re-routing capacity across multiple nations to hedge geopolitical risk. Government initiatives in China incentivize digitized invoice financing, which in turn requires transparent shipment data that control towers provide. India attracts a wave of nearshoring, with 61% of U.S. executives ranking it a top alternative to China. Japan funds resilience upgrades, while Vietnam and Indonesia host greenfield plants that integrate tower dashboards from day one. The momentum signals that the region will account for a rising portion of global control tower market growth.
Europe progresses behind a strict sovereignty lens. Hybrid architecture that keep personal and strategic data inside national borders are now standard. Automakers, led by Germany’s shift to electric models, deploy towers to trace battery materials from mine to vehicle assembly. The United Kingdom tailors its customs workflows post-Brexit, and Nordic nations showcase low-carbon distribution dashboards that feed ESG audits. Beyond the core economies, expansion into the Middle East and sub-Saharan Africa is tied to logistics corridor investments that demand end-to-end oversight.

Competitive Landscape
The control tower market is moderately concentrated. Incumbent suites from SAP, Oracle, and IBM lock in clients via integrated ERP and analytics ecosystems, producing switching costs that shield share positions. Pure-plays—Blue Yonder, Kinaxis, o9 Solutions—counter by releasing tightly focused AI modules that plug into any ERP. Blue Yonder’s 2025 launch of Inventory, Shelf, and Logistics Ops agents exemplifies the push toward domain-specific AI copilots.
Differentiation revolves around the depth of machine learning, generative-AI explainability, and readiness for quantum optimisation. Q-CTRL’s collaboration with Airbus and BMW shows why quantum could rewrite route planning economics. Ecosystem strategies matter: visibility specialists like Shippeo and project44 supply granular transport telemetry, while 3PLs such as DHL and DB Schenker fold tower services into managed-logistics contracts, blurring vendor categories. Success increasingly hinges on fusing horizontal technology breadth with vertical process knowledge, leading to joint go-to-market plays between software providers and consulting integrators.
Strategic moves in 2024-2025 illustrate competitive posture. Unilever’s four-year program with multiple vendors produced a digital twin of its global supply network, showcasing how big brands prefer multi-partner stacks. Coca-Cola European Partners refined its control tower to lift service metrics, signaling beverage sector momentum. Project wins are expanding fastest in Asia-Pacific, where greenfield factories skip legacy steps and adopt full-stack towers from day one.
Control Tower Industry Leaders
SAP SE
Blue Yonder, Inc.
Oracle Corporation
Kinaxis Inc.
International Business Machines Corporation
- *Disclaimer: Major Players sorted in no particular order

Recent Industry Developments
- May 2025: Blue Yonder launched AI agents and Cognitive Solutions, creating Inventory Ops, Shelf Ops, Logistics Ops, Warehouse Ops, and Network Ops modules that run real-time analytics on Snowflake and RelationalAI knowledge graphs.
- February 2025: Unilever completed a four-year transformation to an “operations metaverse” that fuses demand and supply planning for autonomous execution.
- December 2024: Q-CTRL, Airbus, and BMW unveiled a hybrid quantum optimisation system that cuts manufacturing cost and emissions in aviation supply chains.
- November 2024: Renault Group’s control tower with Shippeo and Google AI halved expedited transport by tracking 6,000 European shipments daily.


Research Methodology Framework and Report Scope
Market Definitions and Key Coverage
Our study defines the control tower market as subscription-based or enterprise-licensed software platforms, plus related visibility services, that pull data from multiple supply-chain systems to create a real-time, exception-driven dashboard for end-to-end orchestration across procurement, production, logistics, and returns. The figure covers every commercial deployment that combines analytics, scenario simulation, and collaborative workflows, regardless of vertical.
Scope Exclusion: This assessment does not evaluate airport or remote air-traffic control towers, nor their hardware.
Segmentation Overview
- By Type
- Analytical
- Operational
- End-to-End / Predictive
- By Component
- Software
- Services
- By Deployment Mode
- Cloud
- On-Premise
- By End-User Industry
- Retail and E-commerce
- Automotive and Industrial Manufacturing
- Healthcare and Life Sciences
- Food and Beverages
- Electronics and High-Tech
- Pharmaceuticals
- Others (Aerospace, 3PL, etc.)
- By Geography
- North America
- United States
- Canada
- Mexico
- South America
- Brazil
- Argentina
- Rest of South America
- Europe
- United Kingdom
- Germany
- France
- Italy
- Spain
- Nordics
- Rest of Europe
- Middle East and Africa
- Middle East
- Saudi Arabia
- United Arab Emirates
- Turkey
- Rest of Middle East
- Africa
- South Africa
- Egypt
- Nigeria
- Rest of Africa
- Middle East
- Asia-Pacific
- China
- India
- Japan
- South Korea
- ASEAN
- Australia
- New Zealand
- Rest of Asia-Pacific
- North America
Detailed Research Methodology and Data Validation
Primary Research
Mordor analysts interviewed supply-chain heads, solution architects, and systems-integrator partners across North America, Europe, and Asia-Pacific. These conversations refined penetration rates by vertical, realistic cloud-conversion timelines, and regional pricing spreads, allowing us to reconcile secondary signals.
Desk Research
We began with public datasets from the World Trade Organization, UN Comtrade, and the International Transport Forum, then layered insights from trade bodies such as CSCMP and AIAG that publish shipment-level benchmarks. Annual reports and 10-Ks of leading platform vendors revealed adoption counts, while investor decks outlined typical deal sizes. Subscription trends were cross-checked through our D&B Hoovers and Dow Jones Factiva libraries, and macro indicators, container-throughput statistics, and manufacturing PMI helped frame addressable demand. The sources cited here are illustrative; many additional references informed data collection, validation, and clarification.
Market-Sizing & Forecasting
A top-down demand pool was first calculated by linking global freight movements, discrete production indices, and e-commerce parcel volumes to the share of flows actively monitored by digital control towers. We then pressure-tested totals with a bottom-up roll-up of sampled vendor revenues and channel checks. Key variables in our model include multi-tier EDI transaction counts, cloud subscription ASPs, API call frequency, container spot-rate trends, and the proportion of shipments shipped late. Multivariate regression, supported by scenario analysis for macro shocks, drives the 2025-2030 outlook. Where bottom-up disclosures were thin, interpolations stayed within one standard deviation of observed peer ratios.
Data Validation & Update Cycle
Outputs pass a two-step variance screen and peer review before release. We refresh the dataset annually, while material events, large acquisitions, regulatory mandates, or freight-rate shocks trigger interim updates, after which an analyst issues a fresh baseline.
Why Mordor's Control Tower Baseline Stands Firm
Published estimates often diverge because providers choose unequal scopes, inconsistent ASP assumptions, and uneven refresh cadences.
Key gap drivers surface when others fold in installation services, omit SaaS revenues, or apply aggressive AI-adoption multipliers that our primary interviews could not corroborate.
Benchmark comparison
| Market Size | Anonymized source | Primary gap driver |
|---|---|---|
| USD 9.86 B (2025) | Mordor Intelligence | - |
| USD 11.41 B (2025) | Global Consultancy A | Includes installation services and hybrid logistics platforms |
| USD 10.20 B (2024) | Industry Association B | Uses headline licenses with no regional discounting |
| USD 3.00 B (2024) | Research Group C | Limits scope to North America and excludes SaaS revenues |
Taken together, the comparison shows that Mordor's disciplined scope definition, balanced assumptions, and annual refresh cycle give decision-makers a dependable, right-sized baseline traceable to tangible variables and repeatable steps.


Key Questions Answered in the Report
What is driving the rapid growth of the control tower market?
Supply-chain digitization urgency, quantum-optimized simulations, and generative-AI copilots that automate risk sensing are propelling a 17.36% CAGR to 2031.
Which segment of the control tower market is expanding the fastest?
End-to-end predictive control towers are advancing at a 17.40% CAGR as firms shift from reactive dashboards to autonomous decision systems.
How dominant is cloud deployment in the control tower market?
Cloud captured 71.35% of 2025 revenue and will keep rising on a 14.86% CAGR despite data-sovereignty policy hurdles.
Why are healthcare and life sciences investing heavily in control towers?
Cold-chain compliance and real-time traceability needs are driving a 16.42% CAGR for the sector, highlighted by Pfizer’s 99% vaccine service-level performance.
Which region offers the strongest growth outlook?
Asia-Pacific is projected to grow at 13.18% CAGR through 2031 as manufacturers diversify production hubs and governments back trade-digitization programs.
What are the main barriers to control tower adoption?
High implementation costs, data harmonization challenges, and cyber-security or sovereignty constraints can shave up to 2.4% off the forecast CAGR.
Page last updated on:


