Aerosol Contract Filling Services Market Size and Share
Market Overview
| Study Period | 2019 - 2030 |
|---|---|
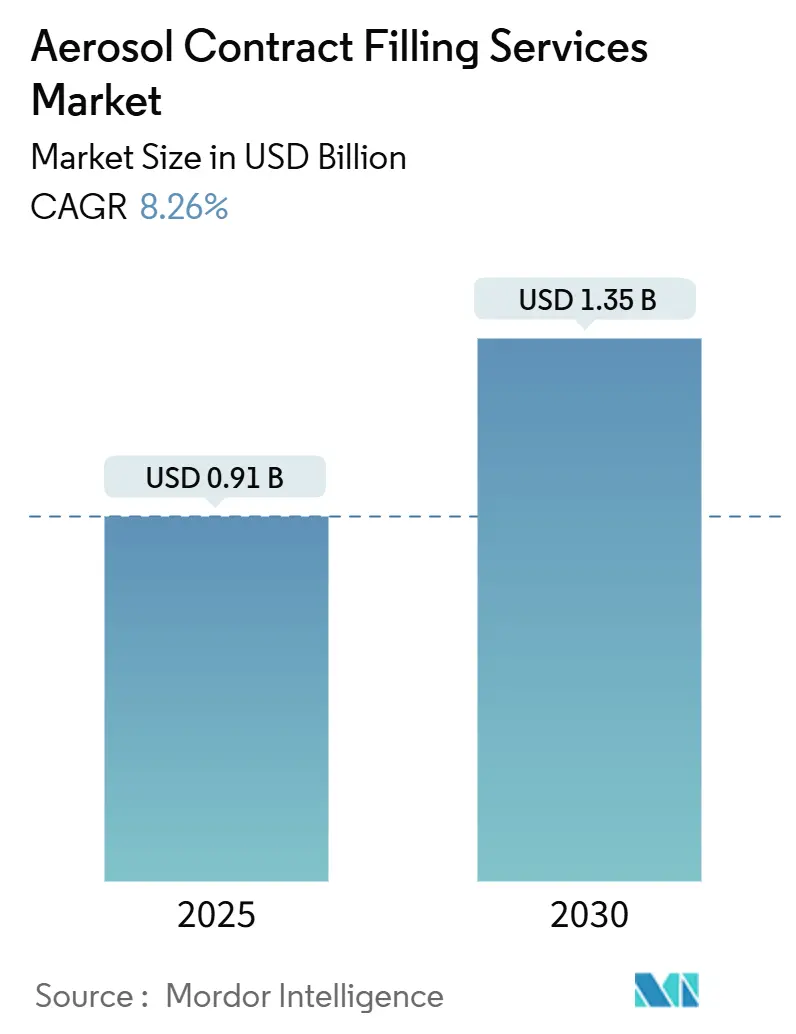
| Market Size (2025) | USD 0.91 Billion |
| Market Size (2030) | USD 1.35 Billion |
| Growth Rate (2025 - 2030) | 8.26% CAGR |
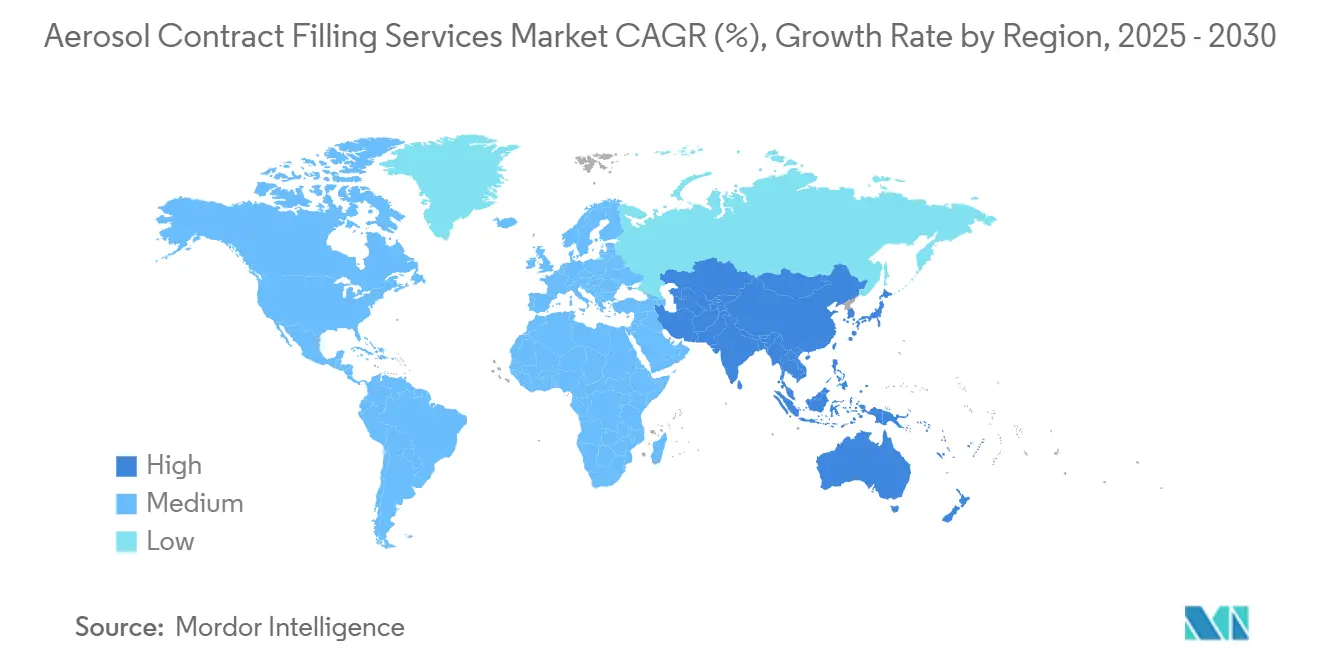
| Fastest Growing Market | Asia Pacific |
| Largest Market | Europe |
| Market Concentration | Medium |
Major Players *Disclaimer: Major Players sorted in no particular order Image © Mordor Intelligence. Reuse requires attribution under CC BY 4.0. | |
Aerosol Contract Filling Services Market Analysis by Mordor Intelligence
The aerosol contract filling services market size is USD 0.91 billion in 2025 and is forecast to reach USD 1.35 billion by 2030, advancing at an 8.26% CAGR. The robust trajectory of the Aerosol contract-filling services market reflects rising formulation complexity, tightening global regulatory frameworks, and brand demand for specialized filling technologies that allow rapid product roll-outs. Liquefied-gas systems retain dominance, yet investment in bag-on-valve (BOV) lines accelerates as pharmaceutical, personal care, and premium sustainability-focused brands transition to low-global-warming-potential solutions. Outsourcing momentum intensifies because brand owners concentrate capital on marketing, digital engagement, and omnichannel distribution, while entrusting aerosol production to partners with advanced regulatory expertise. Across regions, Europe leads on installed capacity and regulatory rigor, North America leverages its pharmaceutical base, and Asia-Pacific drives volume growth through expanding middle-class consumption and manufacturing investment.
Key Report Takeaways
- By aerosol type, liquefied-gas formats captured 53.37% of the Aerosol contract filling services market share in 2024.
- By filling technology, the Aerosol contract filling services market size for BOV filling is projected to grow at a 10.73% CAGR between 2025–2030.
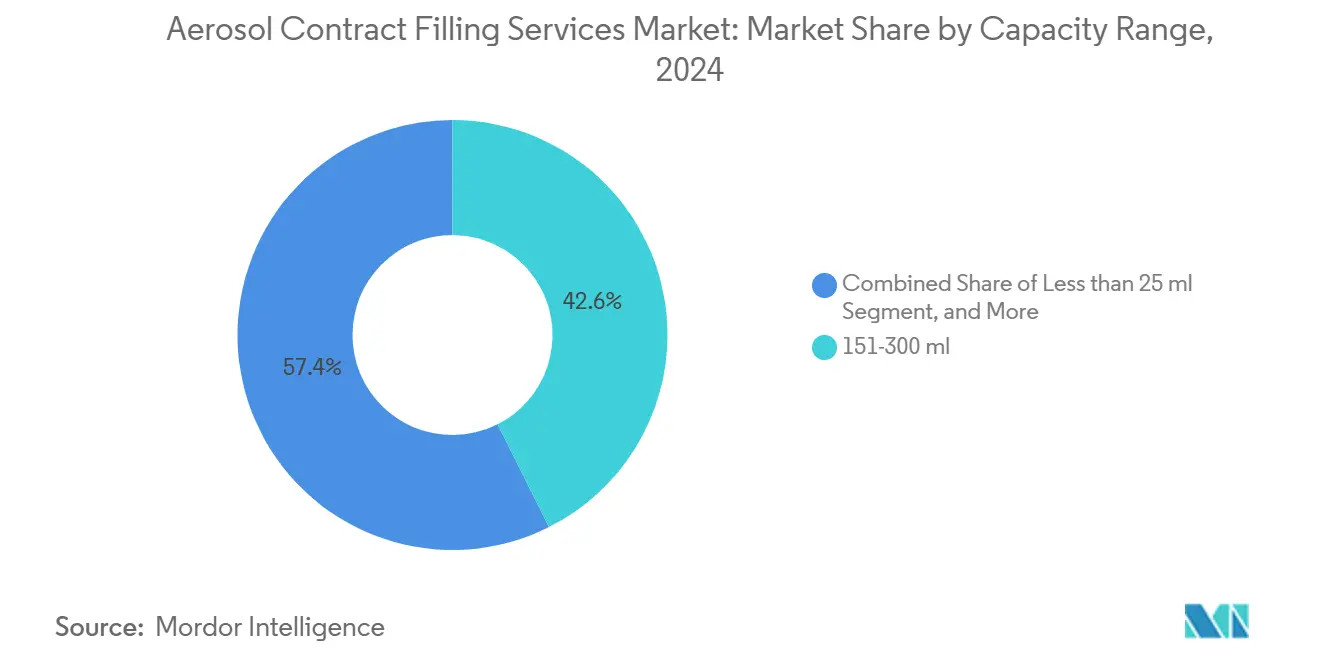
- By capacity range, the 151–300 ml format captured 42.59% of the Aerosol contract filling services market share in 2024.
- By end-use industry, the Aerosol contract filling services market size for pharmaceuticals is projected to grow at 11.43% CAGR between 2025–2030.
- By geography, Europe captured 31.57% of the Aerosol contract filling services market share in 2024.
Global Aerosol Contract Filling Services Market Trends and Insights
Drivers Impact Analysis*
| Driver | (~) % Impact on CAGR Forecast | Geographic Relevance | Impact Timeline |
|---|---|---|---|
| Boom in personal-care aerosols across emerging markets | +1.8 % | Asia-Pacific core, spill-over to Latin America and Middle East and Africa | Medium term (2-4 years) |
| Sustainability push toward eco-friendly propellants and BOV formats | +1.5 % | Global, with early adoption in Europe and North America | Long term (≥ 4 years) |
| Brand focus on core competencies, driving outsourcing | +1.2 % | Global, particularly North America and Europe | Short term (≤ 2 years) |
| Rise of agile, digital-native micro-brands needing small-batch runs | +0.9 % | North America and Europe, expanding to the Asia-Pacific | Medium term (2-4 years) |
| Expansion of topical Rx-to-OTC switches using aerosol delivery | +0.7 % | Global, led by U.S. FDA and EU EMA approvals | Long term (≥ 4 years) |
| VOC-regulation-driven conversion to water-based BOV lines | +0.6 % | North America (CARB states) and Europe | Medium term (2-4 years) |
| Source: Mordor Intelligence | |||
Boom in Personal-Care Aerosols Across Emerging Markets
Rising disposable incomes, urbanization, and beauty-conscious demographics are propelling personal-care aerosol consumption in India, China, Indonesia, and Brazil, leading multinational brands such as Unilever and Procter & Gamble to boost outsourced production in the region. Contract fillers expand high-speed lines and adapt fragrance, hair-care, and skin-spray formulations to local preferences, thereby capturing early-stage loyalty in convenience-oriented formats. A strategic location in duty-free export zones reduces logistics costs and expedites cross-border fulfillment, while regional sustainability regulations drive demand for low-VOC propellants. The Aerosol contract-filling services market benefits from localization initiatives endorsed by governments aiming to upgrade manufacturing value chains. As local tastes evolve toward premium products, fillers invest in nitrogen-blanketing and multi-chamber packaging technologies to accommodate an expanding SKU mix.
Sustainability Push Toward Eco-Friendly Propellants and BOV Formats
The European Union’s phasedown of hydrofluorocarbons mandates a 79% reduction by 2030, incentivizing fillers to adopt HFA-152a and HFO-1234ze propellants, which have a global warming potential below 150. Pharmaceutical and dermatological brands embrace BOV because it isolates products from propellants, enables water-based formulas, and extends shelf life without the need for preservatives, thereby bolstering credibility with environmentally conscious consumers. Equipment suppliers, such as Pamasol, integrate closed-loop recovery systems that capture fugitive emissions during filling, thereby lowering regulatory compliance costs and differential insurance premiums. Sustainable supply chain initiatives attract ESG-focused investors, resulting in increased capital access for contract fillers that certify low-carbon footprints. On a commercial front, brand owners market “greener aerosol” claims in digital campaigns, and rapid consumer adoption translates to higher order volumes on advanced lines.
Brand Focus on Core Competencies, Driving Outsourcing
Asset-light strategies are accelerating outsourcing as global consumer conglomerates divest non-core production assets to sharpen their focus on brand equity, social media engagement, and omni-channel retail growth. Contract fillers transition from tolling to end-to-end partnerships encompassing formulation, regulatory dossier preparation, quality assurance, and secondary packaging. Integrated service models improve speed-to-market through concurrent engineering, enabling brands to pilot SKUs within weeks rather than months. Outsourcing also reduces capital exposure to volatile raw material prices, as fillers negotiate bulk can, valve, and propellant contracts, thereby passing on cost efficiencies. The result is a structural uplift in recurring volumes that enlarges the Aerosol contract filling services market across developed and emerging regions alike.
Rise of Agile, Digital-Native Micro-Brands Needing Small-Batch Runs
Social media, influencer marketing, and direct-to-consumer business models enable niche brands to launch aerosol SKUs with order quantities ranging from 500 to 1,000 units. Contract fillers respond with modular, quick-change equipment that allows for rapid switching between fragrances, colors, or propellant types in under 30 minutes, thereby minimizing line downtime. Higher price realizations per unit offset reduced economies of scale, providing attractive margins for fillers that master agile scheduling. Data-enabled manufacturing execution systems track micro-batch traceability, supporting regulatory audits and consumer transparency initiatives. As micro-brands scale, they maintain loyalty to partners who facilitated their launch, anchoring a pipeline of future high-volume business that sustains the Aerosol contract filling services market.
Restraints Impact Analysis*
| Restraint | (~) % Impact on CAGR Forecast | Geographic Relevance | Impact Timeline |
|---|---|---|---|
| Stringent global propellant regulations increase compliance cost | -1.1 % | Global, strictest in Europe and North America | Long term (≥ 4 years) |
| Volatile aluminum and steel can supply chains | -0.8 % | Global, acute in Europe and North America | Short term (≤ 2 years) |
| Scarcity of GMP-certified sterile BOV capacity | -0.6 % | Global, constraining pharmaceutical growth | Medium term (2-4 years) |
| High capex barrier for new contract fillers | -0.4 % | Global, limiting competitive intensity | Long term (≥ 4 years) |
| Source: Mordor Intelligence | |||
Stringent Global Propellant Regulations Increase Compliance Cost
Fillers must retrofit refrigeration-grade storage, gas detection, and vent-recovery systems to meet EU F-Gas quotas and CARB volatile organic compound limits, incurring capital expenditure (capex) that can reach USD 3 million per line.[1]California Air Resources Board, “Consumer Products Regulation Updates,” arb.ca.gov Routine audits, safety training, and leak-testing protocols increase fixed operating costs, disproportionately pressuring smaller independent fillers. Certification under multiple jurisdictions demands dedicated regulatory staff fluent in U.S. and emerging Asia-Pacific frameworks, reducing management bandwidth for innovation initiatives. In response, some regional players pursue mergers to pool compliance resources, thereby consolidating the Aerosol contract-filling services market.
Volatile Aluminum and Steel Can Supply Chains
Global aluminum sheet indices rose 16 % in late 2024 amid smelter shutdowns, while steel shortages worsened after regional labor strikes, forcing fillers to accelerate safety stock policies. Lead times for printed cans extended from six to ten weeks, delaying product launches and disrupting promotional calendars. Contract fillers hedge by diversifying suppliers across continents, yet freight costs narrow the feasibility of long-distance sourcing. Brands facing out-of-stock risks often renegotiate service-level agreements, which include penalties for delayed fulfillment, thereby transferring supply chain stress downstream. Consequently, working capital requirements escalate, challenging cash-flow management among smaller fillers and impeding the entry of prospective competitors.
*Our forecasts treat driver/restraint impacts as directional, not additive. The impact forecasts reflect baseline growth, mix effects, and variable interactions.
Segment Analysis
By Aerosol Type: Liquefied-Gas Dominance Meets BOV Momentum
Liquefied-gas formats generated 53.37% of the Aerosol contract filling services market share in 2024, as they delivered predictable spray patterns for deodorants, air fresheners, and automotive maintenance products. The segment benefits from incremental propellant innovation that reduces global-warming potential while preserving cost competitiveness. However, the Aerosol contract filling services market size attributed to BOV is expanding at a 10.14 % CAGR because pharmaceutical, dermatology, and baby-care brands prioritize sterility, contamination avoidance, and preservative-free formulations. BOV can isolate active ingredients from propellant, thereby extending shelf life and enabling 360-degree dispensing.
Early-stage adoption of compressed-gas aerosols continues in applications such as whipping cream, food-grade glaze, and industrial coatings, where specific pressure characteristics are essential; however, growth trails the headline BOV trajectory. Contract fillers expand dedicated BOV rooms equipped with ISO-class laminar flow hoods and automated weight verification, capturing projects that require low-oxygen headspace conditions. Forward-looking fillers also collaborate with valve suppliers on dual-chamber designs capable of incremental dosing for cosmeceutical treatments. These developments collectively broaden application possibilities, intensifying competition inside the Aerosol contract filling services market.


By Filling Technology: Pressure Filling Scale Faces BOV Disruption
Pressure filling retained a 66.13% share of the Aerosol contract filling services market size in 2024, due to its entrenched infrastructure and favorable throughput metrics suited for high-volume SKUs. Continuous improvements, such as servo-driven indexing tables and in-line vision systems, raise yields above 98%, lowering rework rates. However, the 10.73 % CAGR forecast for BOV equipment reflects surging pharmaceutical demand and consumer sustainability preferences. Equipment manufacturers offer turnkey BOV lines that incorporate nitrogen blanketing, overpressure testing, and closed-loop propellant recovery to reduce greenhouse gas emissions.
Fillers weigh capex allocations against customer mix: high-volume personal care contracts justify pressure filling upgrades, whereas premium therapeutic sprays support BOV investments backed by higher line rates. Two-piece and three-piece can filling technologies remain vital in specialty automotive and industrial coatings that require unique metal substrates, thereby reinforcing supplier diversification across the Aerosol contract filling services market. The battle for capex budgets intensifies as fillers pursue digital twin simulations to model throughput, line balancing, and preventive maintenance, maximizing equipment utilization.
By Capacity Range: Mainstream Formats Steady, Travel-Size Surges
The dominant 151-300 ml range held 42.59% of the Aerosol contract filling services market share in 2024, as consumers perceive this format as combining value and ergonomics for daily grooming routines. Volume economies allow brand owners to meet price-point expectations in mass retail channels. However, sub-25 ml containers are projected to expand at an 11.09% CAGR, as airlines, urban commuters, and on-the-go consumers prioritize portability and compliance with carry-on regulations. Luxury labels are adopting aluminum mono-material miniature cans to distinguish premium SKUs, thereby boosting average selling prices and line margins for contract fillers.
Fillers retrofit high-precision micro-dosing valves and weight-controlled fill stations to ensure consistency within ±0.1 g for small formats. Simultaneously, mid-range 26-150 ml capacities appeal to topical pharmaceuticals requiring repeatable metered dosing, reinforcing cross-segment within the Aerosol contract filling services market. Larger cans above 300 ml serve cost-per-use-driven household cleaners and lubricant aerosols, but price sensitivity limits margin expansion. Consequently, fillers pursue mixed-model scheduling strategies that balance high-volume mainstream runs with high-margin small-format contracts.
By End-use Industry: Personal Care Scale Meets Pharmaceutical Upside
Personal care and cosmetics accounted for a 37.78% share of the Aerosol contract filling services market size in 2024, driven by deodorants, hair sprays, and body mists, which have established consumer habits. Sustainability upgrades, such as sugar-cane-derived ethanol and recycled aluminum, refresh mature categories and maintain volume stability. Meanwhile, pharmaceuticals are set to grow at an 11.43 % CAGR, catalyzed by Rx-to-OTC switches for dermatological corticosteroids, antifungal sprays, and respiratory therapies that leverage metered dosing accuracy.
Food and beverage aerosols remain a niche market that requires FDA-compliant food-grade lubricants and adheres to Sanitary 3-A standards, offering moderate but stable volumes. Automotive and household care requests steady contract manufacturing demand for lubricant sprays, brake cleaners, and anti-rust coatings, sustaining diversification benefits. Stringent Current Good Manufacturing Practice protocols segregate pharmaceutical lines from cosmetic production, prompting fillers to build dedicated cleanrooms and validate sterilization cycles, especially for BOV formats. Certifications increase switching costs, fostering long-term partnerships and reinforcing growth in the Aerosol contract-filling services market.
Geography Analysis
Europe’s leadership in the Aerosol contract filling services market is rooted in decades of investment in precision valve engineering, environmental stewardship, and integrated logistics networks linking fillers to brand innovation centers. Germany’s Rhineland hosts clusters where contract fillers co-locate with propellant suppliers, can makers, and firms specializing in dispensing technology, enabling rapid prototype-to-production cycles. France’s luxury cosmetics heritage supports premium aerosol perfumery, driving small-batch runs that command margins above the regional average. The United Kingdom, though navigating post-Brexit trade protocols, continues to attract pharmaceutical aerosol development due to its Medicines and Healthcare products Regulatory Agency's alignment with EMA quality standards.
The Asia-Pacific’s double-digit growth is driven by demographic momentum and state-backed industrial policies that incentivize local value addition. Chinese fillers adopt digital-thread production lines that automate leak detection and integrate enterprise resource planning, leapfrogging legacy setups common in Europe.[2]WuXi AppTec, “Shanghai Aseptic Filling Line Opening,” wuxiapptec.com India’s multinationals repurpose beverage can lines for aerosol applications, reducing capex and accelerating capacity deployment, while Japan’s personal-care incumbents ensure steady demand for advanced valve designs adapted to humid climates. South Korea pioneers eco-friendly lamination-free cans that simplify recycling, reinforcing sustainable credentials within the Aerosol contract filling services market.
North America maintains a balanced portfolio of pharmaceutical, personal-care, and specialty chemical volumes. U.S. fillers invest in aerosol digital twins to model propellant behavior under variable ambient temperatures, optimizing fill weights for nationwide distribution. Mexico’s maquiladora corridors supply U.S. mass retailers, benefiting from synchronized customs processes and robust road freight connectivity. Canada’s bilingual labeling requirements drive localized production of export SKUs intended for both domestic and U.S. shelves, securing steady demand for bilingual can printing contracts.

Competitive Landscape
The Aerosol contract-filling services market exhibits moderate fragmentation, with the top five players collectively accounting for 35-40% of global revenue, while hundreds of regional specialists cater to niche end-uses or specific capacity ranges. Mergers center on geographic diversification and technology acquisition, exemplified by European fillers acquiring sterile BOV lines in North America to penetrate pharmaceutical segments. Vertical integration is gaining traction as fillers bundle formulation labs, regulatory dossier support, and proprietary dispensing-closure technology, thereby raising switching costs and embedding long-term contracts.
Innovation differentiates leaders: advanced fillers deploy Industry 4.0 sensors for real-time weight verification and predictive maintenance, achieving on-time-in-full metrics above 97%. Partnerships with equipment firms, such as Pamasol, accelerate the adoption of automated changeover and remote line diagnostics, thereby slashing downtime during multi-SKU campaigns.[3]Pamasol Willi Mäder AG, “Advanced BOV Filling Systems with Digital Integration,” pamasol.com ESG commitments further influence procurement decisions; fillers scoring high in life-cycle assessments secure multi-year preferred-supplier status from multinational consumer goods corporations.
Regional competitive intensity varies. Europe’s stringent regulations erect barriers that discourage undercapitalized entrants, whereas Asia-Pacific’s lower entry costs attract new players offering flexible contract terms. North America’s pharmaceutical orientation concentrates business among a limited set of GMP-certified facilities, driving premium pricing and high capacity utilization. Supply-chain resilience emerges as a competitive criterion, with fillers developing multisourcing strategies for cans, valves, and propellant to shield customers from raw-material volatility.
Aerosol Contract Filling Services Industry Leaders
Aeropac Pty Ltd
Linden Chemie Hellenthal GmbH & Co.
KG Karmelle Ltd
Cortec Corporation
Chem-Pak Inc.
- *Disclaimer: Major Players sorted in no particular order

Recent Industry Developments
- May 2025: Aerofil Technology, Inc. upgraded its quality control systems with AI-driven defect detection for improved consistency.
- April 2025: Chem-Pak launched a smart aerosol packaging solution integrating QR codes for batch traceability and consumer engagement.
- March 2025: Tri Pac expanded its Indiana facility with automated filling lines to support high-volume pharmaceutical aerosol production.
- January 2025: PLZ Corp introduced a new eco-friendly propellant system for personal care aerosols, aligning with sustainability goals.


Global Aerosol Contract Filling Services Market Report Scope
| Liquefied-gas Aerosols |
| Compressed-gas Aerosols |
| Bag-on-Valve (BOV) Aerosols |
| Conventional Pressure Filling |
| Bag-on-Valve (BOV) Filling |
| 2-Piece and 3-Piece Can Filling |
| Less than 25 ml |
| 26-150 ml |
| 151-300 ml |
| More than 300 ml |
| Food and Beverage |
| Pharmaceuticals |
| Automotive |
| Household and Institutional Care |
| Personal Care and Cosmetics |
| Other End-user Industry |
| North America | United States | |
| Canada | ||
| Mexico | ||
| South America | Brazil | |
| Argentina | ||
| Chile | ||
| Rest of South America | ||
| Europe | United Kingdom | |
| Germany | ||
| France | ||
| Italy | ||
| Spain | ||
| Russia | ||
| Rest of Europe | ||
| Asia-Pacific | China | |
| India | ||
| Japan | ||
| South Korea | ||
| Australia | ||
| Rest of Asia-Pacific | ||
| Middle East and Africa | Middle East | Saudi Arabia |
| United Arab Emirates | ||
| Turkey | ||
| Rest of Middle East | ||
| Africa | South Africa | |
| Nigeria | ||
| Rest of Africa | ||
| By Aerosol Type | Liquefied-gas Aerosols | ||
| Compressed-gas Aerosols | |||
| Bag-on-Valve (BOV) Aerosols | |||
| By Filling Technology | Conventional Pressure Filling | ||
| Bag-on-Valve (BOV) Filling | |||
| 2-Piece and 3-Piece Can Filling | |||
| By Capacity Range | Less than 25 ml | ||
| 26-150 ml | |||
| 151-300 ml | |||
| More than 300 ml | |||
| By End-use Industry | Food and Beverage | ||
| Pharmaceuticals | |||
| Automotive | |||
| Household and Institutional Care | |||
| Personal Care and Cosmetics | |||
| Other End-user Industry | |||
| By Geography | North America | United States | |
| Canada | |||
| Mexico | |||
| South America | Brazil | ||
| Argentina | |||
| Chile | |||
| Rest of South America | |||
| Europe | United Kingdom | ||
| Germany | |||
| France | |||
| Italy | |||
| Spain | |||
| Russia | |||
| Rest of Europe | |||
| Asia-Pacific | China | ||
| India | |||
| Japan | |||
| South Korea | |||
| Australia | |||
| Rest of Asia-Pacific | |||
| Middle East and Africa | Middle East | Saudi Arabia | |
| United Arab Emirates | |||
| Turkey | |||
| Rest of Middle East | |||
| Africa | South Africa | ||
| Nigeria | |||
| Rest of Africa | |||


Key Questions Answered in the Report
How large is the Aerosol contract filling services market in 2025?
The market is expected to reach USD 0.91 billion in 2025 and is projected to grow to USD 1.35 billion by 2030.
Which region grows fastest in aerosol contract filling?
Asia-Pacific is forecast to record a 10.34 % CAGR through 2030, driven by personal-care consumption and manufacturing investment.
What segment holds the highest Aerosol contract filling services market share?
Liquefied-gas aerosols lead with 53.37 % share in 2024, while BOV systems are the fastest growing.
Why are brands outsourcing aerosol production?
Outsourcing enables brands to focus on marketing and innovation while leveraging specialized fillers for regulatory compliance, advanced technology, and cost efficiency.
How do sustainability rules influence aerosol filling?
EU and North American regulations phase down high-GWP propellants, prompting investment in low-GWP and BOV technologies that reduce environmental impact and meet consumer expectations.
Page last updated on:


