
Aerosol Valve Market Size and Share
Market Overview
| Study Period | 2020 - 2031 |
|---|---|
| Market Size (2026) | USD 2 Billion |
| Market Size (2031) | USD 2.36 Billion |
| Growth Rate (2026 - 2031) | 3.42 % |
| Fastest Growing Market | Asia Pacific |
| Largest Market | Europe |
| Market Concentration | Medium |
Major Players *Disclaimer: Major Players sorted in no particular order Image © Mordor Intelligence. Reuse requires attribution under CC BY 4.0. | |
Aerosol Valve Market Analysis by Mordor Intelligence
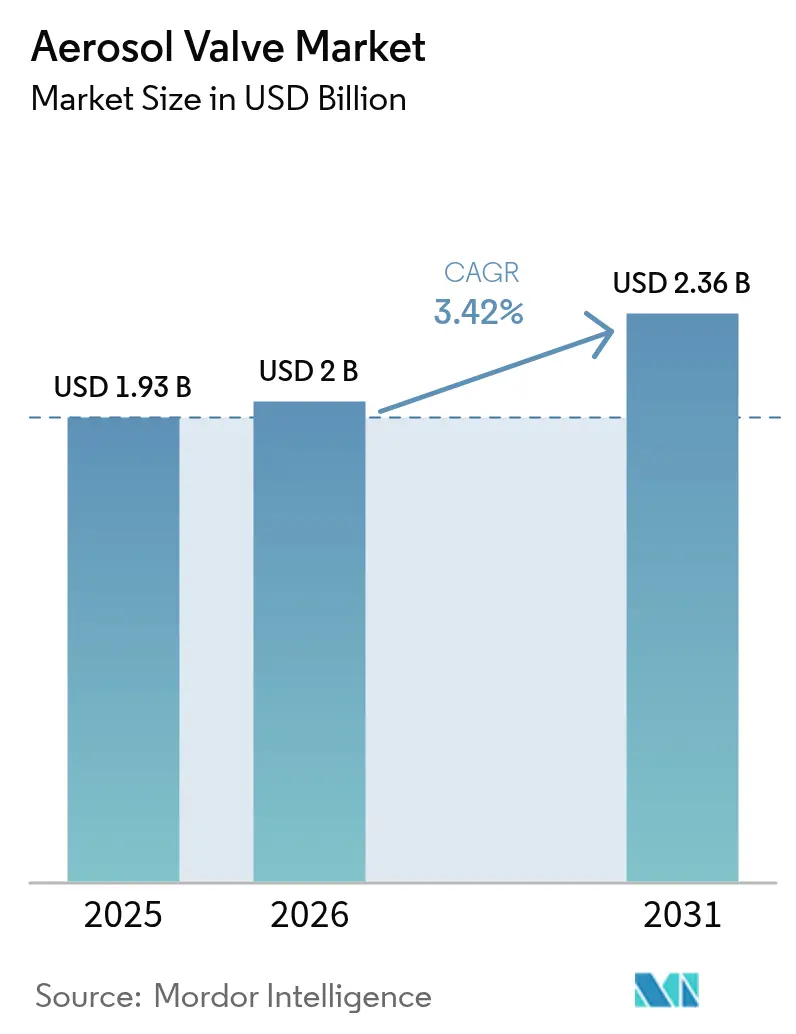
The aerosol valve market size is expected to grow from USD 1.93 billion in 2025 to USD 2 billion in 2026 and is forecast to reach USD 2.36 billion by 2031 at 3.42% CAGR over 2026-2031. Current growth flows from resilient demand in personal care, healthcare, home care, and automotive maintenance, even as regulators tighten limits on volatile organic compounds and high-global-warming propellants. Product differentiation through eco-friendly designs, notably bag-on-valve systems and lightweight plastic housings, keeps innovation active. Regional momentum is mixed: Europe remains the revenue leader because strict environmental rules push premium sustainable solutions, while Asia-Pacific records the fastest expansion thanks to rising disposable income and broad manufacturing capacity. Consolidation continues, illustrated by Sonoco’s USD 3.9 billion acquisition of Eviosys, which deepens integrated packaging capability.
Key Report Takeaways
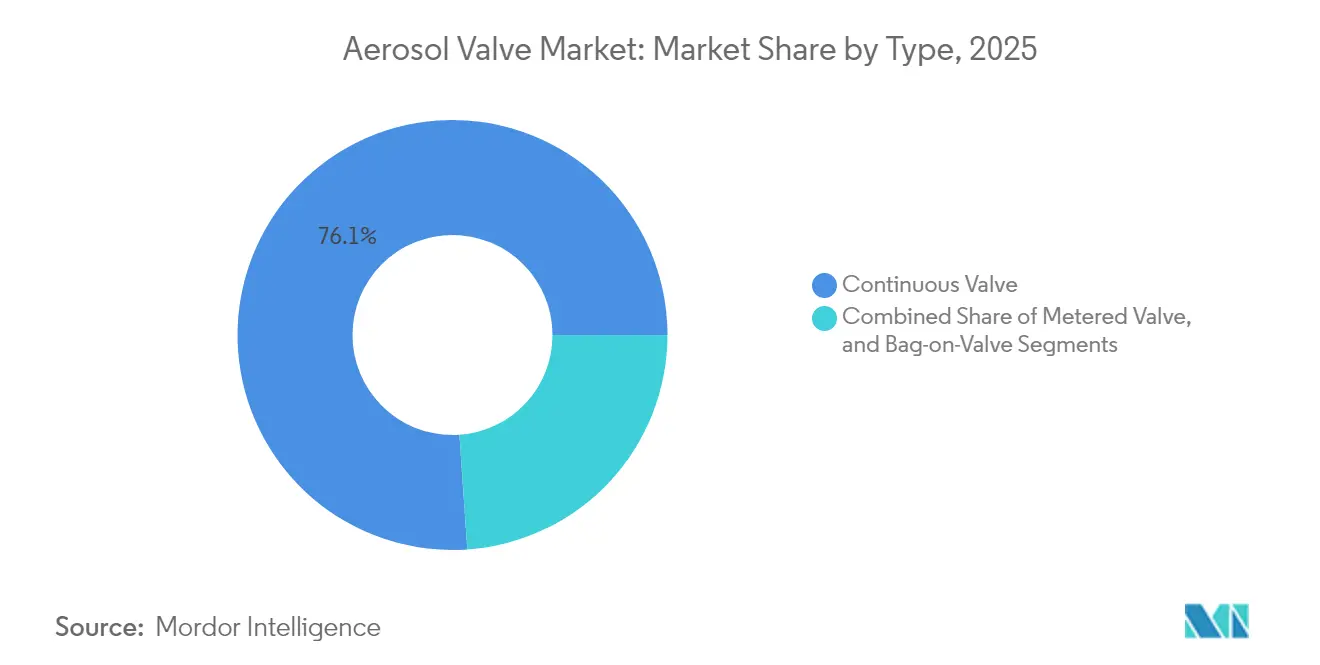
- By type, continuous valves led with 76.10% revenue share in 2025, whereas bag-on-valve systems are projected to expand at a 4.50% CAGR to 2031.
- By material, aluminum accounted for 45.20% of aerosol valve market share in 2025, while plastic variants are set to post a 4.56% CAGR through 2031.
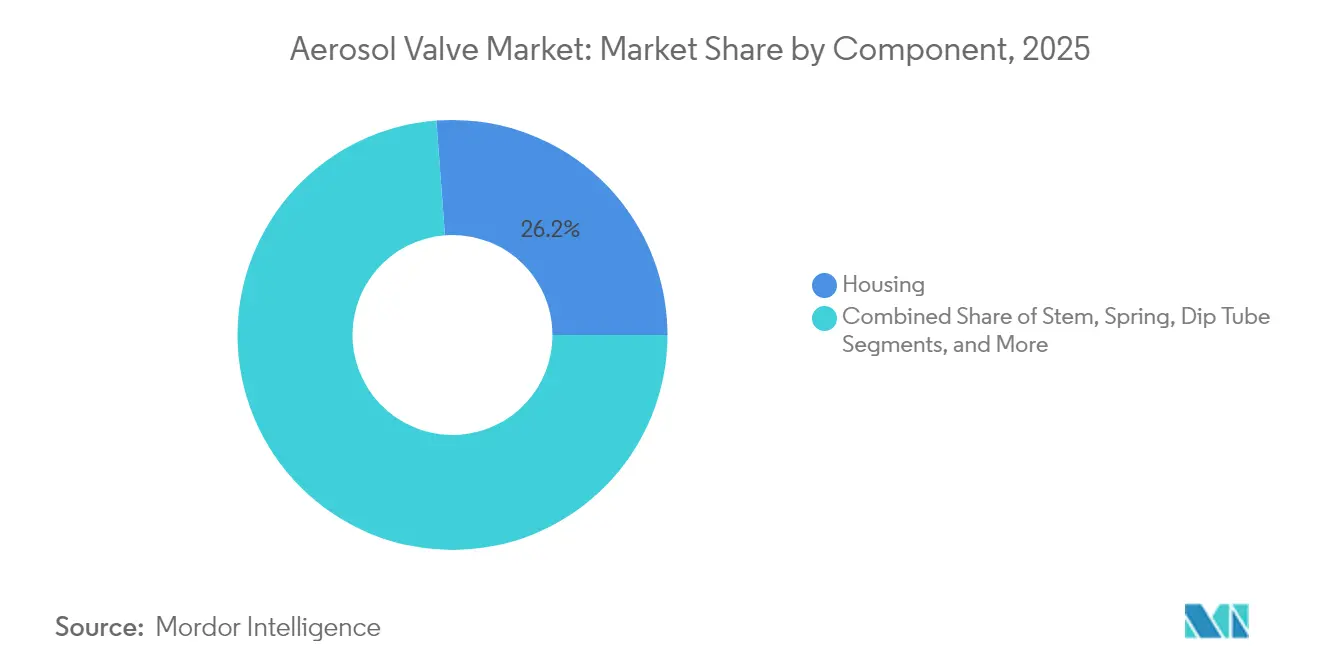
- By component, housing captured 26.20% of the aerosol valve market size in 2025, and springs are the quickest-growing component at a 4.38% CAGR.
- By end-user industry, personal care commanded 40.95% revenue in 2025, and healthcare is advancing at a 4.66% CAGR to 2031.
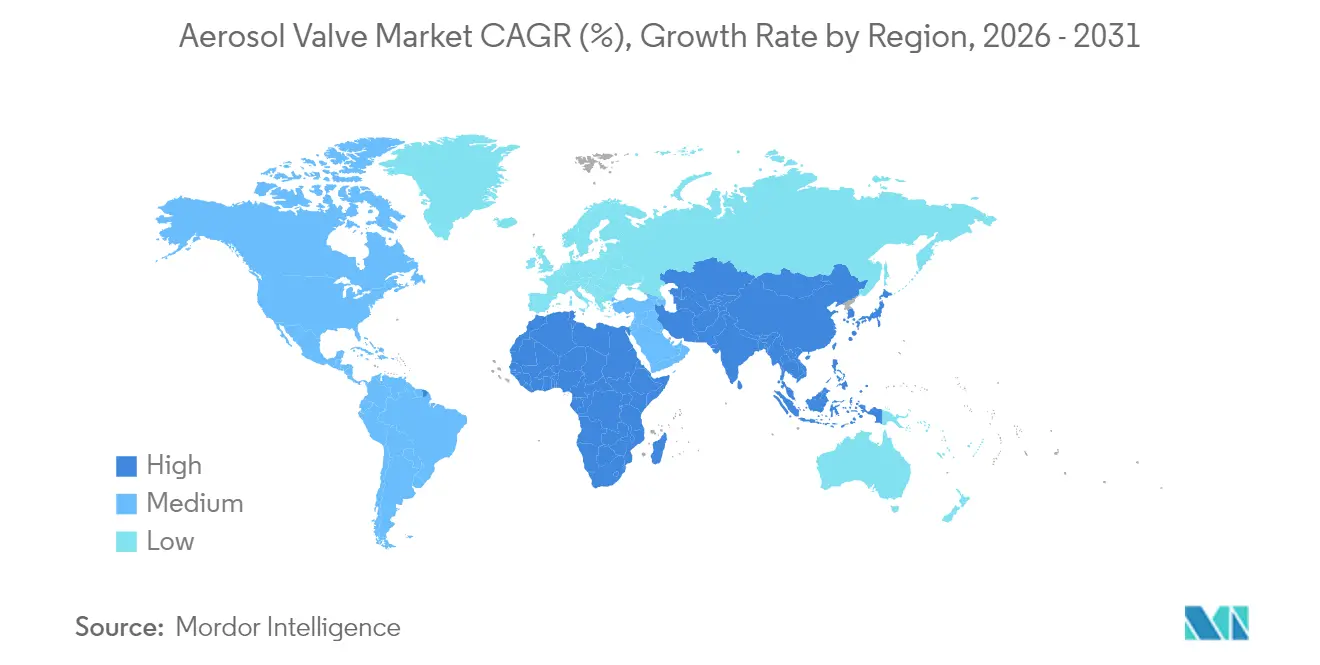
- By geography, Europe held 32.60% of 2025 revenue, but Asia-Pacific is on track for a 4.61% CAGR to 2031.
Note: Market size and forecast figures in this report are generated using Mordor Intelligence’s proprietary estimation framework, updated with the latest available data and insights as of 2026.
Market Trends and Insights
Drivers Impact Analysis of Aerosol Valve Market*
| Driver | (~) % Impact on CAGR Forecast | Geographic Relevance | Impact Timeline |
|---|---|---|---|
| Strong demand from cosmetics and personal care | +0.8% | North America; Europe | Medium term (2-4 years) |
| Shift toward easy-to-handle packaging | +0.6% | Asia-Pacific emerging markets | Long term (≥ 4 years) |
| Healthcare aerosol adoption (inhalers, disinfectants) | +0.9% | North America; EU | Short term (≤ 2 years) |
| Bag-on-valve eco-friendly adoption | +0.7% | Europe; North America | Medium term (2-4 years) |
| Automotive aftermarket aerosol surge | +0.4% | North America; Asia-Pacific | Medium term (2-4 years) |
| E-commerce private-label SKU proliferation | +0.5% | Developed markets | Long term (≥ 4 years) |
| Source: Mordor Intelligence | |||
Strong demand from cosmetics and personal care
Beauty brands are adding dry shampoos, setting sprays, and texturizing mists that need consistent particulate delivery and precise coverage. The social-media-influenced “digital beauty” customer values sleek, controlled dispensing, which aerosol valves provide. Valve suppliers are responding with custom actuator shapes and compatibility testing for natural formulations, helping personal care labels differentiate in crowded shelves.
Healthcare aerosol adoption acceleration
Global use of metered-dose inhalers is climbing alongside rising asthma and COPD incidence. The United States Environmental Protection Agency projects HFC-134a and HFC-227ea propellant use in inhalers reaching 1,595 metric tons by 2025[1]United States Environmental Protection Agency, “HFC Consumption in Metered-Dose Inhalers,” epa.gov. Parallel demand for disinfectant aerosols remains above pre-pandemic baselines in hospitals and public venues. These medical applications require dose accuracy and pharmaceutical-grade materials, allowing valve makers to capture premium margins.
Bag-on-valve technology momentum
By isolating product from propellant, bag-on-valve assemblies deliver 360-degree spraying, longer shelf life, and lower VOC emissions. Tri-Pac added a 5 million-unit production line in 2025 to meet growing OTC, medical device, and cosmetic orders. Adoption rises fastest in Europe, where eco-design directives favor lower environmental impact packaging.
E-commerce private-label proliferation
Online retailers deploy aerosol packaging to elevate private-label lines in personal care, home cleaning, and automotive upkeep. Longer shelf life supports subscription models, while controlled dispensing enhances perceived value. Smaller production runs and tailored valve colors satisfy niche direct-to-consumer brands seeking rapid differentiation.
Restraints Impact Analysis of Aerosol Valve Market*
| Restraint | (~) % Impact on CAGR Forecast | Geographic Relevance | Impact Timeline |
|---|---|---|---|
| Stringent VOC and propellant regulations | -0.7% | North America; EU | Short term (≤ 2 years) |
| Alternative dispensing (trigger sprayers, pumps) | -0.5% | Global | Medium term (2-4 years) |
| Supply-chain vulnerability in specialty metals | -0.4% | Global | Medium term (2-4 years) |
| High capital intensity and technical complexity | -0.3% | Global | Long term (≥ 4 years) |
| Source: Mordor Intelligence | |||
Stringent VOC and propellant regulations
The January 2025 update to U.S. aerosol-coating rules tightened product-weighted reactivity limits and broadened reporting, pushing brands to reformulate or exit the market epa.gov. California’s CARB enforces daily VOC reduction targets that elevate compliance costs. While propellant innovation is advancing, smaller firms face delayed launches and higher R&D outlays.
Alternative dispensing competition
Trigger sprayers and pump misters tout propellant-free operation and simpler recycling. Silgan Dispensing’s Mark VII Max Blossom delivers ultra-fine mist performance without compressed gas, attracting sustainability-minded buyers in skin-care and household cleaners. As mechanical systems match aerosol spray quality, they erode share in cost-sensitive segments.
*Our forecasts treat driver/restraint impacts as directional, not additive. The impact forecasts reflect baseline growth, mix effects, and variable interactions.
Aerosol Valve Market Segment Analysis
By Type:
Continuous Valves Retain Scale, Bag-on-Valve Gains Premium GroundContinuous valves accounted for 76.10% of the aerosol valve market in 2025 due to high-speed line compatibility and attractive unit economics. They dominate mass-market cleaners, lubricants, and paint enhancers that reward low cost and robust durability. The aerosol valve market still relies on continuous formats for the bulk of volume, but safety and environmental expectations are nudging design tweaks such as plastic over-caps molded from post-consumer resin.
Bag-on-valve technology, however, posts the fastest 4.50% CAGR. Brand owners accept higher component costs because propellant reductions lower lifecycle emissions and enable 360-degree usage, essential for medical sprays and premium sunscreens. This subsegment benefits Europe’s eco-design rules and U.S. retailers’ recyclable-content scorecards. As adoption widens, the aerosol valve market size for bag-on-valve assemblies is on course to accelerate notably between 2026 and 2031.



By Material:
Aluminum Still Leads, Plastics AscendAluminum held 45.20% of aerosol valve market share in 2025 thanks to excellent barrier performance and an established recycling loop. It remains indispensable for high-pressure inhalers and automotive cleaners. The aerosol valve market nonetheless witnesses plastics growing 4.56% per year as processors develop multi-layer and coated PET housings that tolerate higher pressure. Plastipak’s SprayPET Revolution, a metal-free polymer can, cuts weight and carbon footprint while staying fully recyclable.
First movers showcase transparent housings that reveal fill levels, aligning with consumer openness trends. Still, aluminum keeps an edge where oxygen transmission rates must stay extremely low. The aerosol valve market size for aluminum components will continue growing albeit slower, whereas plastic’s share rise will stem from cost-sensitive personal and home-care SKUs.
By Component:
Housing Dominates, Spring Engineering EvolvesHousing parts represented 26.20% of 2025 revenue because outer shells dictate structural integrity and aesthetic impact. Investment in anodized finishes, tactile lacquer coatings, and embossing enhances shelf appeal. Springs, the fastest advancing component at 4.38% CAGR, gain from metallurgy upgrades that lengthen compression cycles and resist corrosion from aggressive formulas.
Precision micro-springs also boost dosing accuracy in pharmaceutical metered valves. Meanwhile, modular stem geometries and chemically inert gaskets support broader propellant compatibility. Rising customization raises average selling prices, enhancing value capture for vertically integrated suppliers within the aerosol valve market.
By End-User Industry:
Personal Care Leads, Healthcare RisesPersonal care retained 40.95% of 2025 sales as consumers favor salon-quality sprays that deliver fine, even coverage. Dry shampoo, texture sprays, and SPF mists sustain baseline demand. Healthcare, though, records the quickest 4.66% CAGR because inhaler use tracks chronic respiratory conditions, and disinfectant aerosols remain standard in clinics. The aerosol valve market size for healthcare applications is set to widen as propellant reformulations and tight-dose actuators gain regulatory approval.
Industrial maintenance and automotive touch-ups post steady replacement cycles, and home care maintains recurrent demand for air fresheners and multi-surface cleaners. Collectively, these categories support diversified revenue streams that cushion cyclic downturns.
Geography Analysis
Europe Aerosol Valve Market
Europe generated 32.60% of 2025 revenue, underpinned by Green Deal directives that reward low-VOC and recyclable packaging. Producers leverage regional R&D to roll out bag-on-valve deodorants and aluminum-lightweight housings. Sonoco’s integration of Eviosys strengthens supply security for European brands seeking local sourcing . Sustained personal-care consumption plus advanced pharma production anchor the region.
APAC Aerosol Valve Market
Asia-Pacific is the fastest-growing area at a 4.61% CAGR. China supplies scale manufacturing, Japan and South Korea add engineering rigor, and Southeast Asia grows consumption. Local firms upgrade lines to meet export compliance, broadening regional participation in premium segments. Accelerating healthcare infrastructure also fuels inhaler valve demand, enlarging the aerosol valve market in the region.
The Americas and MEA Aerosol Valve Market
North America preserves a sizeable share through specialized pharmaceutical and premium beauty applications. Innovation centers on carbon-footprint reduction, exemplified by Ball’s re:gen aerosol can that claims a 50% emission cut versus traditional cans. Supply-chain localization and recycling mandates encourage investment in closed-loop aluminum sourcing. South America and the Middle East & Africa trail but show promise as urbanization and e-commerce lift per-capita consumption of convenient spray products.

Regulatory Landscape
Regulation is tightening around both emissions and packaging circularity, shaping valve and actuator design choices. In the United States, the EPA issued a final rule in January 2025 updating the National VOC Emission Standards for Aerosol Coatings under the Clean Air Act. The update revised reactivity-based limits and expanded compliance reporting, which pushes brands toward lower-VOC formulations and valve systems that support new propellant and solvent mixes. At the state level, programs such as California Air Resources Board (CARB) VOC requirements continue to raise the compliance bar for many consumer aerosol categories.
In Europe, aerosol packaging decisions are influenced by two policy tracks, climate and waste. The EU Fluorinated Greenhouse Gases Regulation (EU) 2024/573, adopted in February 2024, accelerates the phase-down of high-GWP fluorinated gases, adding pressure to shift away from propellant choices tied to higher climate impact. Separately, the EU Packaging and Packaging Waste Regulation (EU) 2025/40 entered into force on 11 February 2025 and applies from 12 August 2026, reinforcing packaging design-for-recycling and waste reduction obligations that cascade to valve components, including material selection, separability, and lightweighting. In the United Kingdom, amendments in 2024 to aerosol dispenser rules updated marking and technical equipment requirements, reinforcing the need for consistent safety and labeling compliance across product lines.
Value Chain Analysis
The aerosol valve value chain runs from upstream metals and polymers through precision component making and high-speed assembly, then to can makers, contract fillers, and brand owners in personal care, home care, healthcare, and automotive and industrial aerosols. Key inputs include aluminum and steel for mounting cups and springs, as well as polymers such as PP, PE, and nylon for stems, housings, and dip tubes. Suppliers move through tooling, stamping, molding, and plating or coating steps before automated assembly and functional testing. The installed base of high-speed assembly and validation equipment creates a capital-intensive manufacturing layer, particularly for metered and healthcare-grade applications that require tighter tolerances and traceability.
Downstream, integrated packaging groups and specialist valve makers coordinate qualification with fillers to match formulations, propellants, and spray performance. Trade bodies such as the British Aerosol Manufacturers Association (BAMA) and Germanys Industrie-Gemeinschaft Aerosole e.V. (IGA) support standard-setting and cross-industry alignment. Recent network changes highlight capacity and proximity to customers as strategic levers, including LINDAL Groups January 2026 acquisition of a manufacturing facility in Wismar, Germany, which strengthens European supply and shortens lead times for OEM and branded programs. Across the chain, regulatory-driven redesign, including recyclability, low-VOC systems, and lower-GWP propellant compatibility, increases the importance of materials engineering, mold availability, and qualification cycles as potential bottlenecks.
Competitive Landscape
The aerosol valve market shows moderate concentration. AptarGroup, Precision Valve, and Lindal Group defend share through patented micro-orifice designs and multinational manufacturing. Sonoco’s USD 3.9 billion Eviosys purchase broadens capability across cans, ends, and valves, creating a one-stop metal packaging platform. Such vertical integration secures metal inputs and optimizes freight.
Innovation is a core battleground. Ball Corporation’s lightweight re:gen can, combined with Meadow’s fully recyclable alloy, demonstrates that carbon reduction is monetizable[3]Ball Corporation, “re:gen Lightweight Aluminum Aerosol Can Launch,” ball.com. Plastipak’s polymer-only SprayPET container challenges metal incumbents in select low-pressure niches. Concurrently, Silgan Dispensing’s propellant-free fine-mist devices target market share in fragrance and skincare without regulatory propellant burden.
New entrants typically focus on contract manufacturing or specialty valves for medical devices. However, the capital intensity of high-speed stamping and assembly lines, plus stringent validation for pharmaceutical customers, sustains entry barriers. As sustainability metrics join cost and quality in buyer evaluations, leadership will depend on integrated capability, material science, and lifecycle stewardship.
Aerosol Valve Industry Leaders
AptarGroup Inc.
Precision Valve Corporation
Lindal Group Holding GmbH
Coster Tecnologie Speciali S.p.A.
Mitani Valve Co., Ltd.
- *Disclaimer: Major Players sorted in no particular order

Aerosol Valve Market Companies Covered in this Report
- AptarGroup Inc.
- Precision Valve Corporation
- Lindal Group Holding GmbH
- Coster Tecnologie Speciali S.p.A.
- Mitani Valve Co., Ltd.
- Summit Packaging Systems, Inc.
- Clayton Corporation
- Newman Green Inc.
- Koh-I-Noor Mlada Vozice a.s.
- Salvalco Ltd.
- Majesty Packaging Systems Limited
- Shanghai Sunhome Industrial Co., Ltd.
- EC Pack Industrial Limited
- C. Ehrensperger AG
- Aroma Industries FZCO
- Seung-il Corporation
- Yingbo Aerosol Valve (Zhongshan) Co., Ltd.
- Guangzhou Zhongpin Aerosol Valves Co., Ltd.
- Maruichi Co., Ltd.
- Weener Plastics Group GmbH

Market Opportunities and Future Outlook
Sustainability-led redesign and regulation-driven propellant shifts are creating whitespace for differentiated valves, actuators, and component sets that reduce material use and improve recyclability while maintaining spray performance. Buyer actions in 2026 also clarify where investment is going. Aptar Beauty introduced Twist-to-Lock aerosol actuators with Double Click Technology in May 2026, positioned around POM-free material choices, reduced resin use versus traditional actuator-overcap combinations, and Amazon ISTA-6 e-commerce testing alignment. This supports a specific opportunity for valve and actuator suppliers that can combine e-commerce robustness with lightweighting and simplified material stacks, particularly in fast-rotating personal care and home care SKUs.
Manufacturing localization and alternative propellant architectures are also expanding the opportunity beyond conventional hydrocarbon systems. In January 2026, Salvalco opened a manufacturing facility near Bangkok, Thailand to scale valves optimized for inert gases such as nitrogen, aligning with customer efforts to reduce exposure to VOC and F-gas constraints. In Europe, LINDALs January 2026 acquisition of a manufacturing facility in Wismar, Germany supports local-for-local supply strategies and faster qualification cycles for premium segments, including bag-on-valve and medical and cosmetic applications. These moves, alongside the EU Packaging and Packaging Waste Regulation applying from 12 August 2026 and the EU F-gas phase-down under Regulation (EU) 2024/573, keep demand focused on recyclable component architectures, low-propellant-loss designs, and systems compatible with inert gas and bag-on-valve formats.
Recent Industry Developments in Aerosol Valve Market
- June 2026: Aptar Beauty began local manufacturing of its AAT Vertical Slider Aerosol Valve for high-powder and shimmer formulations at its Cary, Illinois facility. The move shortens supply lead times for specialty powder aerosols and supports faster regional scale-up for beauty brands with high-particulate formulations. Local production also strengthens customer qualification and continuity for performance-sensitive valve programs.
- February 2025: European Union Packaging and Packaging Waste Regulation (EU 2025/40) entered into force on 11 February 2025 and applies from 12 August 2026, reinforcing design-for-recycling and waste-reduction obligations that cascade to valve components such as material selection, separability, and lightweighting. This policy shift influences formulations and component choices across the European aerosol supply chain.
- December 2024: Sonoco completed its USD 3.9 billion acquisition of Eviosys, expanding its integrated metal packaging footprint across cans, ends, and related aerosol packaging components. The combination strengthens scale, sourcing leverage, and end-to-end packaging offerings for multinational aerosol brand owners. Greater vertical integration can reshape supplier selection by bundling container and component programs under fewer large platforms.


Aerosol Valve Market Report Scope and Research Methodology
Market Definition and Coverage
For this study, the aerosol valve market covers valves and closely related valve components used to dispense pressurized products from aerosol containers across consumer and industrial uses, measured in value terms at the point of sale from suppliers.
Scope exclusions: We exclude aerosol cans themselves, propellants, actuators, caps, and contract filling services unless they are bundled and priced as part of the valve supply.
Segments Covered in This Report
- By Type
- Continuous Valve
- Metered Valve
- Bag-on-Valve
- By Material
- Aluminum
- Tinplate Steel
- Stainless Steel
- Plastic
- Others
- By Component
- Housing
- Stem
- Spring
- Dip Tube
- Cup and Gasket
- By End-User Industry
- Personal Care
- Home Care
- Healthcare
- Automotive and Industrial
- Others
- By Geography
- North America
- United States
- Canada
- Mexico
- South America
- Brazil
- Argentina
- Rest of South America
- Europe
- Germany
- United Kingdom
- France
- Italy
- Spain
- Russia
- Rest of Europe
- Asia-Pacific
- China
- Japan
- India
- South Korea
- Australia and New Zealand
- Rest of Asia-Pacific
- Middle East and Africa
- Middle East
- Saudi Arabia
- United Arab Emirates
- Turkey
- Rest of Middle East
- Africa
- South Africa
- Nigeria
- Egypt
- Rest of Africa
- Middle East
- North America
Data Sources, Market Sizing, and Validation
Desk Research
Desk work starts by mapping the valve demand pool to aerosol can production and end-use consumption patterns, so the model stays tied to packaging activity by geography. We refer to public sources such as UN Comtrade for trade flows of metal packaging inputs, the USITC DataWeb for tariff and import context, Eurostat for manufacturing and industrial indicators, and the US Census Bureau for related production and shipment series.
To refine assumptions, we also review sources like patent databases (to track valve and bag-on-valve innovation themes), company annual reports and investor presentations (to understand capacity additions and mix), and trade association and regulator publications that influence packaging choices and VOC rules. A paid subscription for company financials and an import export shipment-level database are used selectively to confirm large supplier revenue direction and cross-check material movement. The sources listed above are illustrative, and many other public and paid references were used to collect, validate, and clarify data points.
Primary Interviews and Surveys
Primary work is used to test the desk assumptions that usually drive variance, like valve content per can, pricing ranges by valve type, and the pace of bag-on-valve adoption in regulated end uses. We speak with a mix of packaging suppliers, component makers, distributors, and large aerosol fillers across APAC, EMEA, and the Americas, then we revisit the inputs when any change moves model outputs outside a reasonable band.
Distribution of primary research fieldwork respondents
| Company type | Respondent position | Region |
|---|---|---|
| Top tier: 34% | CXOs: 19% | APAC: 50% |
| Mid tier: 44% | Functional/Unit leaders: 39% | EMEA: 29% |
| Smaller Players: 22% | Managers: 42% | Americas: 21% |
Market-Sizing & Forecasting
Sizing is built using a top-down approach where aerosol packaging output and trade signals are translated into valve demand, and then value is derived using realistic price bands by valve type and materials. The totals are then checked through selective bottom-up approximations, such as sampled supplier revenue direction, channel checks with distributors, and simple volume times average selling price calculations for a few high-usage end markets.
Key inputs used in the model include aerosol can production direction in major regions, mix split between continuous, metered, and bag-on-valve formats, material preference shifts across aluminum and steel parts, end-use demand strength in personal care and home care, and regulatory pressure points that steer packaging design. When a data gap appears, we use conservative ranges from interviews and apply them only to the relevant sub-pool instead of spreading the assumption across the full market.
For forecasting, scenario analysis is used because the adoption rate of newer dispensing formats and metal input price pass-through can change differently by region. A short list of demand and pricing drivers is projected forward, with the final path agreed through primary feedback so the growth profile stays practical and not overly optimistic.
Data Validation & Update Cycle
Validation is done through multiple checks so the final number does not depend on a single assumption. We compare model outputs against independent signals like trade direction, packaging production indicators, and supplier performance commentary, and we review any sharp swings line by line before sign-off.
Anomalies trigger a re-check of the underlying mix and pricing inputs, followed by targeted re-contact with industry participants when the change cannot be explained by public indicators. The report is refreshed annually, and interim updates are made when material events occur, such as major capacity moves or policy shifts that can affect aerosol packaging demand. Before delivery, a fresh review pass is completed so clients receive the latest updated view.
Mordor Intelligence's Aerosol Valve Market Size Compared Against Other Published Estimates
Published market sizes for aerosol valves often differ because the underlying count of what qualifies as a valve sale is not consistent, and the pricing logic can be handled in multiple ways. We see the biggest gaps when adjacent packaging items are added into scope, when different base years are used, and when growth is supported by optimistic adoption assumptions.
Trade flows of valve-related metal components, aerosol packaging output direction, and supplier mix commentary are used to keep Mordor Intelligence's estimate tied to valve value only, which is why some broader packaging interpretations land above or below the same-year figure.
Benchmark comparison
| Source | Market Size | Gaps in Research Methodology |
|---|---|---|
| Mordor Intelligence | USD 1.93 B (2025) | |
| Global Consultancy A | USD 1.77 B (2025) | Uses a different valve-type boundary and application mapping, and its pricing bands appear more conservative for higher-spec metered and bag-on-valve formats, which can pull down the total in value terms. |
| Industry Publisher B | USD 1.83 B (2025) | Includes a broader application set and applies a smoother price progression over time, which can shift the 2025 value depending on currency timing and how material-linked price pass-through is treated. |
The table shows that the spread is mainly explained by scope edges and how average selling prices are constructed, not by a disagreement that valves are growing. By keeping the demand pool tied to aerosol activity signals and then validating price and mix assumptions through interviews, we arrive at a figure that is easier to trace back to clear, repeatable steps.


Key Questions Answered in the Report
What is the current size of the aerosol valve market?
The aerosol valve market is valued at USD 2 billion in 2026 and is projected to reach USD 2.36 billion by 2031.
Which valve type holds the largest share today?
Continuous valves lead with 76.10% of 2025 revenue because they fit high-speed, cost-sensitive filling lines.
Why is Asia-Pacific the fastest-growing region?
Rapid industrialization, rising middle-class consumption, and expanding healthcare needs support a 4.61% CAGR for the region through 2031.
How are regulations influencing product innovation?
Tight VOC and propellant limits in the United States and Europe push suppliers toward bag-on-valve formats, low-GWP propellants, and fully recyclable materials.
Page last updated on:


 Your data is secure and never sold or shared.


