Video As A Service (VaaS) Market Size and Share
Market Overview
| Study Period | 2020 - 2031 |
|---|---|
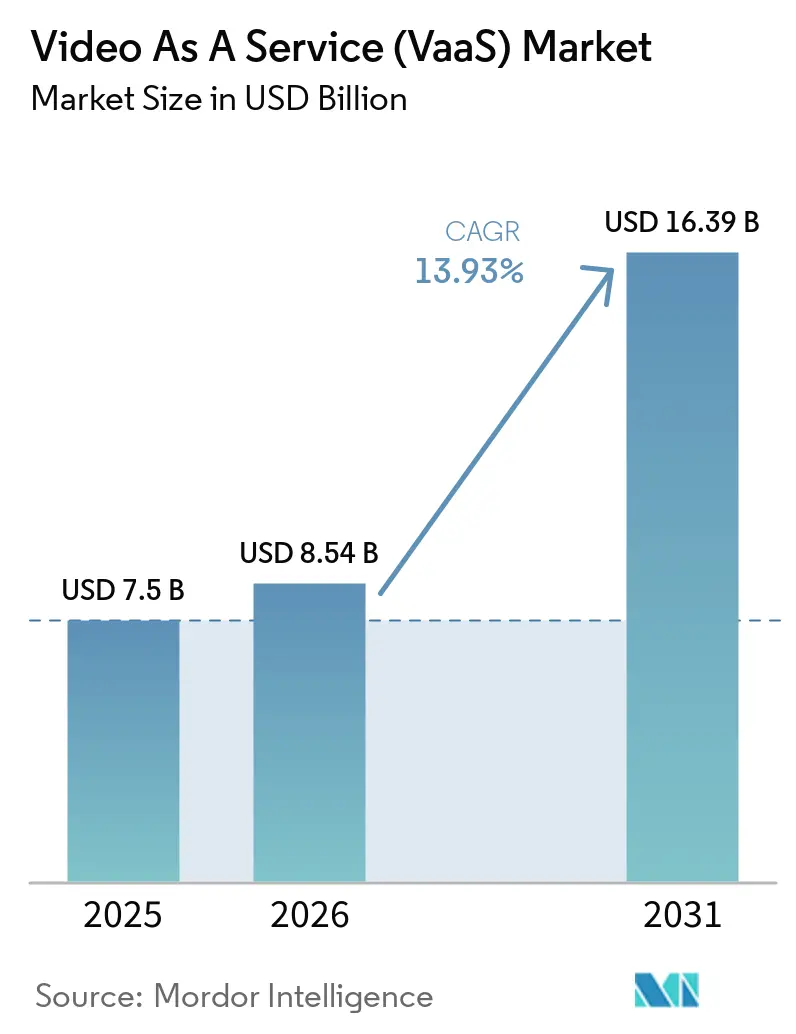
| Market Size (2026) | USD 8.54 Billion |
| Market Size (2031) | USD 16.39 Billion |
| Growth Rate (2026 - 2031) | 13.93% CAGR |
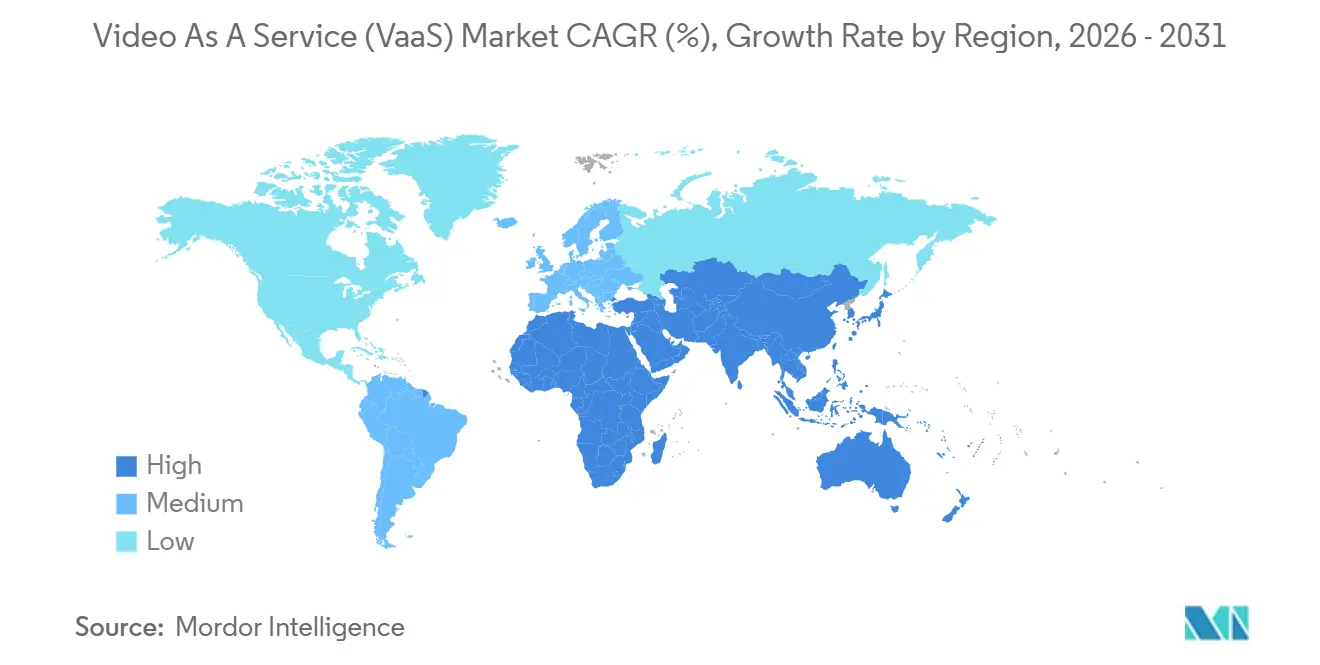
| Fastest Growing Market | Asia Pacific |
| Largest Market | North America |
| Market Concentration | Medium |
Major Players *Disclaimer: Major Players sorted in no particular order Image © Mordor Intelligence. Reuse requires attribution under CC BY 4.0. | |
Video As A Service (VaaS) Market Analysis by Mordor Intelligence
The Video As A Service Market size is projected to be USD 7.5 billion in 2025, USD 8.54 billion in 2026, and reach USD 16.39 billion by 2031, growing at a CAGR of 13.93% from 2026 to 2031.
Stable cloud bandwidth pricing, deeper 5G penetration, and buyers’ preference for subscription billing over capital investment continue to widen adoption. Finance chiefs increasingly tag cloud video spending as a predictable operating cost, which smooths cash flows even when IT budgets tighten. Asia-Pacific is accelerating on the back of new data-centre capacity and extensive 5G standalone roll-outs. Investors reward vendors that pair recurring revenue with compliance-ready features, prompting road maps that emphasise encryption, audit logging, and sovereign deployment templates. Heightened carbon-reduction mandates and hybrid-work retrofit programmes extend demand into facilities budgets, further reinforcing the video as a service market trajectory.
Key Report Takeaways
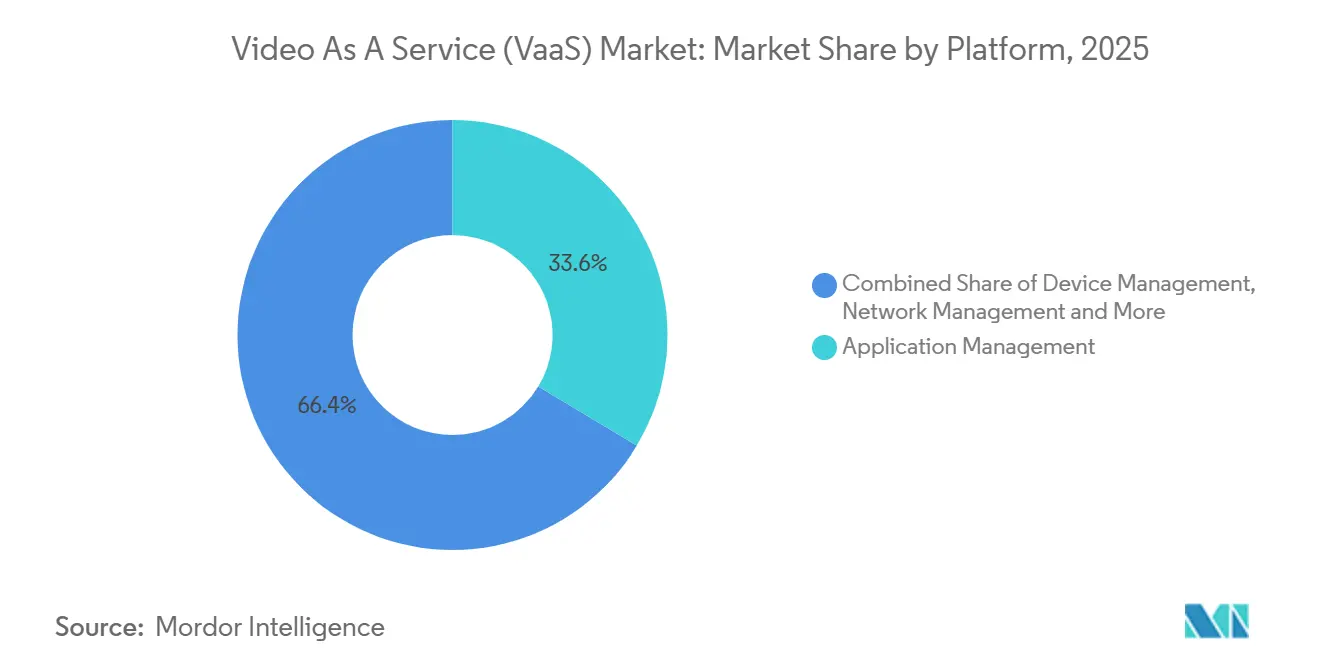
- By platform type, application-management suites led with 33.60% revenue share in 2025, while content-management platforms are forecast to grow at a 16.22% CAGR through 2031.
- By device category, enterprise computing endpoints held 54.20% of the video as a service market share in 2025, and mobile endpoints are set to expand at an 17.6% CAGR to 2031.
- By service type, managed services accounted for 63.10% of the video as a service market size in 2025; professional services are projected to record a 14.78% CAGR through 2031.
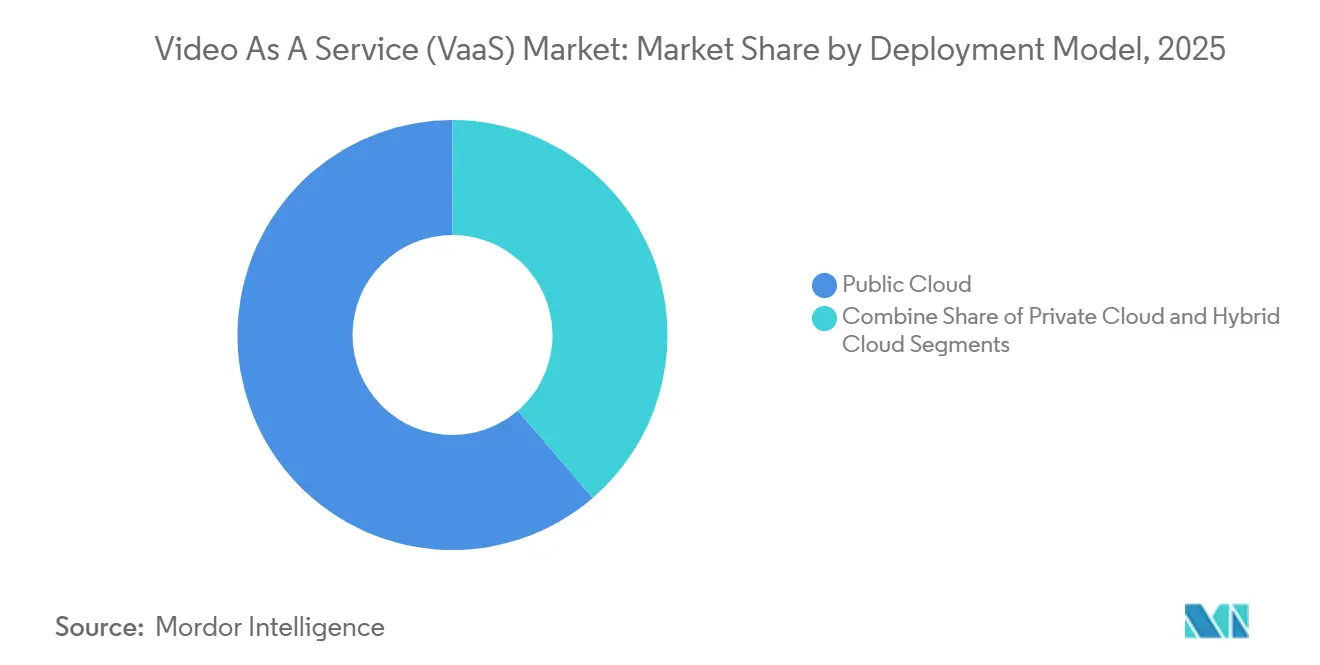
- By deployment model, public-cloud instances represented 61.30% of implementations in 2025, while hybrid-cloud deployments are advancing at a 18.62% CAGR to 2031.
- By end-user industry, information technology and telecommunications retained a 25.60% share in 2025; healthcare is poised for an 18.05% CAGR, the fastest among all verticals.
- By region, North America commanded 37.40% of 2025 revenue, whereas Asia-Pacific is forecast to post the strongest 16.55% CAGR through 2031.
Note: Market size and forecast figures in this report are generated using Mordor Intelligence’s proprietary estimation framework, updated with the latest available data and insights as of 2026.
Global Video As A Service (VaaS) Market Trends and Insights
Drivers Impact Analysis*
| Driver | (~) % Impact on CAGR Forecast | Geographic Relevance | Impact Timeline |
|---|---|---|---|
| CAPEX-to-OPEX transition | +3.2% | North America, Europe | Short term (≤ 2 years) |
| Embedded video APIs | +2.1% | Global BFSI, insurance | Medium term (2-4 years) |
| 5G and edge roll-outs | +2.8% | Asia-Pacific, North America | Medium term (2-4 years) |
| Hybrid-work mandates | +3.5% | Developed markets | Short term (≤ 2 years) |
| AI content governance | +1.9% | Regulated sectors | Long term (≥ 4 years) |
| Carbon-reduction policies | +1.6% | Europe | Long term (≥ 4 years) |
| Source: Mordor Intelligence | |||
Shift from Capital Expenditure to Operating Expenditure
Enterprises redirected budgets from proprietary bridges to pay-per-use cloud video throughout 2024. A tier-one US telco reported that moving one-quarter of its video portfolio to a service model cut annual depreciation by double digits and lifted operating free cash flow. Depreciation relief often funds bandwidth upgrades, forming a self-reinforcing flywheel that multiplies usage. Finance units appreciate monthly fee visibility, which cushions VaaS spending during macro headwinds. Vendors respond by simplifying per-user licensing tiers, reducing procurement complexity. Early adopters confirm that the switch trims lifecycle support overhead because cloud platforms absorb version management.
Embedded Video APIs in Customer Applications
A European insurer distributed 40,000 personalised renewal videos in 2025 using an API gateway that pulls real-time policy data into templated scenes. Marketing departments, now direct stakeholders, accelerate purchase cycles that were previously IT-led. Integration of customer relationship management data inside video accelerates retention campaigns and supports dynamic upsell prompts. As API maturity grows, insurers embed consent capture and click-through next to playback, tightening compliance loops. This approach also shrinks hosting costs because content length can be tailored to policy complexity, reducing storage minutes per customer while boosting engagement.
Low-Latency 5G and Edge Acceleration
Field trials by a South Asian operator in January 2025 achieved sub-40-millisecond round-trip times on 5G standalone, enabling lossless 4K meetings across branch offices in the same metro. Ultra-low latency shifts buyer focus from resolution to conversational fluidity, placing sustained frame rate ahead of pixel density in bid scoring. Vendors integrate edge transcoding to avoid backhaul congestion, elevating experience parity for remote staff. Combined with 800 G backbone links at new edge locations launched in August 2024, operators position themselves as performance guarantors rather than bandwidth suppliers. These milestones set new baselines for service-level agreements that include latency, jitter, and frame-rate stability clauses.
Hybrid-Work Mandates Driving Room Upgrades
A global life-sciences group retrofitted 650 conference rooms with multi-camera speaker-framing systems in 2024, cutting meeting set-up time by 60% and raising remote satisfaction ratings. Facilities managers increasingly own these budgets and favour appliance-style bundles that minimise integration work. Intelligent ceiling cameras paired with people-counting sensors feed occupancy analytics into real-estate dashboards, supporting footprint consolidation. Vendors embed auto-calibration routines so rooms self-tune audio zones overnight, shrinking technician visits. Low-impact installation lowers downtime, making phased upgrades feasible across global estates.
Restraints Impact Analysis*
| Restraint | (~) % Impact on CAGR Forecast | Geographic Relevance | Impact Timeline |
|---|---|---|---|
| Data-sovereignty mandates | −2.4% | EU, Australia | Medium term (2-4 years) |
| Bandwidth cost in emerging regions | −1.8% | Africa, Caribbean | Long term (≥ 5 years) |
| Legacy integration overhead | −1.2% | Telecom, manufacturing | Short term (≤ 2 years) |
| Content-licensing complexity | −0.9% | Global | Medium term (2-4 years) |
| Source: Mordor Intelligence | |||
Sovereign Data-Residency Requirements
An Australian banking group migrated all meeting recordings to a locally hosted instance in 2025 to align with updated prudential standards. Geo-fenced traffic routing fragments support operations and raise tooling needs for cross-region monitoring. Vendors must maintain compliance templates for multiple jurisdictions, increasing engineering overhead. Negotiating data-processing agreements lengthens sales cycles in regulated verticals. Some buyers adopt hybrid-cloud models to balance local control with global elasticity, complicating deployment architectures.
Bandwidth Constraints in Emerging Economies
A Caribbean health network capped outbound video at 540 p during satellite congestion in late 2024.[1]Caribbean Health Procurement, “Bandwidth Shaping Bulletin,” procurement.caribbeanhealth.gov High-throughput satellite or undersea fibre upgrades progress slowly, keeping link costs elevated. Adaptive-bit-rate algorithms are, therefore, mandatory proof-of-concept elements for vendors bidding in bandwidth-scarce regions. Feature trade-offs sometimes force healthcare providers to disable 4K feeds despite clinical imaging needs. Local caching and compressed codecs mitigate challenges yet introduce additional hardware points of failure.
*Our forecasts treat driver/restraint impacts as directional, not additive. The impact forecasts reflect baseline growth, mix effects, and variable interactions.
Segment Analysis
By Platform: Application-Management Suites Dominate but Content-Management Grows Faster
Application-management suites accounted for the largest video as a service market share in 2025, accounting for 33.60% of global revenue. Enterprises rank meeting orchestration, calendar integration, and real-time security controls as baseline requirements. Low-code connectors allow human resources teams to schedule onboarding sessions without IT tickets, widening user bases and lifting per-tenant minute volumes. Vendors differentiate in meeting-lifecycle visualisations that trace attendee engagement down to reaction-emoji frequency.
Content-management platforms, however, are forecast to outpace other categories with a 16.22% CAGR to 2031. Buyers increasingly view metadata, chaptering, and compliance tagging as core. Providers expose these functions through software development kits that insert playback widgets in employee portals. The video as a service market size for content-centric modules is anticipated to expand as retention policies converge with ESG archiving mandates. Device-management submodules now surface energy metrics, letting sustainability teams track per-endpoint power draw, a value add that ties platform renewal conversations to corporate climate goals.


By Device: Enterprise Endpoints Lead, Mobile Records Highest Growth
Enterprise computing endpoints still captured 54.20% of the video as a service market size in 2025. Desktop and laptop clients integrate single sign-on and policy enforcement, supporting regulated industries. Rich screen-share functions and keyboard accessibility features keep knowledge-worker engagement high. Vendors refine background-noise suppression tuned for open-plan offices, improving clarity without raising bitrate.
Mobile devices will add the most net new users at an 17.6% CAGR between 2026 and 2031. Flagship handsets now support cinematic mode with real-time depth mapping, encouraging marketing teams to produce internal updates entirely on mobile workflows. This shift compresses video production timelines from weeks to hours. The video as a service market share for mobile is expected to broaden once 5G coverage blankets suburban zones, removing reliability hesitation among field staff. At the room scale, demand coalesces around ceiling-mounted 360-degree cameras with intelligent audio zoning, equalising voice pickup for remote participants.
By Service: Managed Services Still Rule as Professional Services Accelerate
Managed offerings represented 63.10% of overall revenue in 2025, confirming enterprises’ preference for turnkey monitoring, incident response, and lifecycle updates. Vendors leverage AI observability to predict packet-loss spikes, automatically shifting sessions to optimal media paths. Executive teams value one-stop escalation that merges network troubleshooting and application-layer support. Customer success programs benchmark adoption metrics and push feature campaigns that increase stickiness.
Professional services, meanwhile, are scaling at a 14.78% CAGR, fuelled by rising integration complexity. A North American retailer fused point-of-sale metrics with live broadcast dashboards, displaying near-real-time revenue overlays during executive updates. As enterprises blend operational data streams into live or recorded video, boundaries blur between collaboration suites and business-intelligence tooling. The video as a service market size for consulting engagements is expanding because every new dataset demands schema mapping, role-based access controls, and compliance assessments.
By Deployment Model: Public Cloud Predominant, Hybrid Cloud Fastest Rising
Public-cloud deployments constituted 61.30% of implementations in 2025, reflecting buyers’ comfort with multitenant architectures and elastic scaling. Providers rolled out sovereign-cloud variants that deploy within customer-owned Kubernetes clusters in under two hours, addressing data-residency objections while preserving cloud economics. Pay-as-you-go billing and auto-scale functions make the public cloud attractive for global town-halls that spike to hundreds of thousands of viewers.
The hybrid cloud is forecast to grow at a 18.62% CAGR through 2031. Mid-sized firms experiment with burst-to-cloud models where recordings land on on-premises object storage after a 30-day retention window. This architecture lowers trans-region egress fees and adds a compliance buffer. The video as a service market size for hybrid models is likely to widen as regulation tightens and multicloud procurement policies gain traction. Private cloud remains a strategic niche for defence and healthcare, yet even these buyers pilot stateless services in public regions for non-surgical workloads.
By End-User Industry: IT-Telecom Leads, Healthcare Exhibits Rapid Upside
Information technology and telecommunications retained leadership with 25.60% of 2025 revenue. Software firms embed interactive demos within subscription renewals, driving upsell. Telecom operators bundle VaaS minutes with 5G enterprise lines, creating cross-sell motions that reduce churn. The segment values white-label overlays that maintain brand continuity across resold packages.
Healthcare is projected to advance at an 18.05% CAGR through 2031 . Guthrie Clinic’s virtual-nursing hub saved USD 7 million in labour costs in its first year, underscoring payback potential. Hospital CFOs position virtual observation rooms as staff-retention levers, thus embedding video capacity in workforce planning. The video as a service market share for regulated care settings is expected to rise once electronic health record connectors mature, allowing clinicians to launch HD consults from patient charts. Banking deployments across 115,000 wealth-management users illustrate that client-side encrypted recording satisfies audit rules, further validating compliance readiness.
Geography Analysis
North America preserved leadership with 37.40% of global revenue in 2025, underpinned by high cloud maturity, robust capital-market appetite for recurring-revenue software, and early AI content-governance deployments. US enterprises integrate speech analytics with executive briefing libraries, while Canadian bilingual regulations spur automatic translation demand. Government-funded broadband grants sustain rural bandwidth, extending video reach into smaller municipalities. The region is also early to trial edge-compute offload, reducing central-cloud hops for IoT video analytics.
Asia-Pacific is projected to post a 16.55% CAGR to 2031, the fastest among all territories. Singapore added 150 MW of new colocation capacity in 2024, and Seoul doubled 5G standalone coverage, enabling regional SaaS expansion. Many ASEAN enterprises skipped legacy PBX stages altogether, so first-time video roll-outs are natively cloud-based. Linguistic diversity drives in-app caption localisation, creating competitive differentiation for providers with broad language packs. Edge nodes launched in Indonesia and the Philippines trim first-mile jitter, improving experience parity for archipelagic users.
Europe remains defined by stringent data-protection statutes and aggressive decarbonisation goals. A German automotive group replaced 8 000 inter-city flights with video in 2024, lowering Scope 3 emissions intensity by 4%. Emissions auditors accept VaaS dashboards as proxy evidence for avoided travel, anchoring video budgets inside ESG frameworks. Sovereign-cloud preferences fragment vendor support demands across multiple sub-regions. The bloc’s Digital Markets Act pushes for open interoperability, nudging providers to adopt standards-based codecs and authentication plugins.

Competitive Landscape
The video as a service (VaaS) market is moderately concentrated. The top five vendors combine platform software with identity, display hardware, and analytics modules to deepen account penetration. In 2025, several suppliers introduced sovereign-cloud product editions deployable in customer Kubernetes clusters within hours [3]Bank Example, “Sovereign Cloud Compliance Announcement,” news.bankexample.au. This portability reduces exit friction, so feature velocity becomes the main retention lever. Partnerships with display manufacturers yield integrated touch-panel controls that auto-recognise room cameras, reducing set-up steps for end users.
Competition also hinges on AI capabilities. Providers that bundle transcription, speaker diarisation, and sentiment analysis report 45% attachment rates on new enterprise deals. Some vendors expose model-training sandboxes for customers to tune domain vocabularies, differentiating from fixed-algorithm rivals. Open-platform strategies include marketplace connectors for project management and incident response tools, creating developer ecosystems that embed video hooks in adjacent workflows.
Pricing innovation continues. Usage-based tiers supplement seat licences, letting seasonal businesses ramp capacity temporarily. Vendors experiment with carbon-offset integration, where customers can apply earned credits to offset platform fees. Market entrants focus on narrow use-cases such as telehealth or financial-advisory compliance, leveraging specialised encryption and workflow templates to carve niches. Incumbents respond with modular micro-services that customers can assemble à la carte, countering point-solution encroachment.
Video As A Service (VaaS) Industry Leaders
Cisco Systems Inc.
Zoom Video Communications Inc.
Microsoft Corporation
Google LLC
Huawei Technologies Co. Ltd.
- *Disclaimer: Major Players sorted in no particular order

Recent Industry Developments
- January 2025: A global life-sciences corporation completed a 32-country multi-camera room retrofit, embedding people-counting sensors that informed real-estate consolidation plans.
- December 2024: A Caribbean public-sector health network enabled bandwidth-shaping that prioritises voice over video during satellite congestion.
- November 2024: A US-listed VaaS provider posted FY2024 revenue of USD 4.54 billion, up 7% year on year, with 45% of new wins bundling AI transcription.
- October 2024: A European insurer expanded personalised video renewals to motor policies, claiming a 14% digital-turn-in uplift without raising call-centre load.


Research Methodology Framework and Report Scope
Market Definitions and Key Coverage
Our study defines the video-as-a-service market as fully managed, cloud-delivered platforms that enable enterprises to create, store, stream, and interact with live or recorded video across devices, supported by subscription pricing and elastic capacity.
Scope exclusion: Consumer OTT entertainment apps and standalone security camera hardware are outside this estimate.
Segmentation Overview
- By Platform
- Application Management
- Device Management
- Network Management
- Video Content Management
- By Device
- Mobility Devices
- Enterprise Computing
- Room-based Endpoints
- By Service
- Managed
- Professional
- By Deployment Model
- Public Cloud
- Private Cloud
- Hybrid Cloud
- By End-user Industry
- Government and Defense
- BFSI
- Healthcare and Life Sciences
- IT and Telecom
- Media and Entertainment
- Manufacturing
- Education
- Retail and E-Commerce
- Other End-user Industries
- By Geography
- North America
- United States
- Canada
- Mexico
- South America
- Brazil
- Argentina
- Rest of South America
- Europe
- Germany
- United Kingdom
- France
- Italy
- Spain
- Rest of Europe
- Asia-Pacific
- China
- Japan
- South Korea
- India
- Australia
- New Zealand
- Rest of Asia-Pacific
- Middle East and Africa
- United Arab Emirates
- Saudi Arabia
- South Africa
- Rest of Middle East and Africa
- North America
Detailed Research Methodology and Data Validation
Primary Research
Our analysts interviewed cloud-ops architects, corporate AV managers, and CIOs in North America, Europe, and fast-growing Asian economies to confirm active user counts, prevailing service bundles, and expected migration timelines. Surveys with healthcare and higher-education administrators filled data gaps on tele-consult volumes and virtual classroom minutes.
Desk Research
We began with trade datasets from bodies such as the International Telecommunication Union, the US FCC, Eurostat, and India's MeitY, which reveal broadband density, 5G roll-outs, and enterprise cloud adoption. Company 10-Ks, investor days, and tariffs filed with the SEC supplied average per-seat video pricing. Industry associations like the Interactive Multimedia and Collaborative Communications Alliance, plus academic papers cataloged on IEEE Xplore, illustrated usage benchmarks across sectors. Select figures were cross-checked on D&B Hoovers and Dow Jones Factiva for vendor revenues. This list is illustrative; many other public and paid sources were consulted during validation.
Market-Sizing and Forecasting
A top-down model began with paid seat counts derived from workforce and student populations, applied regional penetration rates, and multiplied by median monthly ASPs before being further filtered through churn and utilization curves. Results were corroborated through selective bottom-up checks, vendor revenue roll-ups, and sampled contract values for sanity. Variables that shape the model include public-cloud video minutes, hybrid-meeting room density, smartphone share of enterprise viewing, average compression bit rates, regulatory retention mandates, and GDP-weighted IT spend. Multivariate regression plus scenario analysis projects 2025-2030 growth, while gap handling uses weighted averages where vendor splits were unavailable.
Data Validation and Update Cycle
Each draft model passes variance checks against independent metrics, then a senior analyst reviews anomalies. Reports refresh annually, with interim updates triggered by major mergers, regulatory shifts, or technology inflections. A final pre-publication sweep ensures clients receive the latest view.
Why Mordor's Video As A Service Baseline Commands Trust
Published market numbers often diverge because publishers fold in different service families, convert currencies on varied dates, or extrapolate from limited regional panels. Our disciplined scoping, mixed top-down and bottom-up logic, and annual refresh cadence reduce such drift.
Key gap drivers include: some studies track only surveillance-centric VSaaS or, conversely, all video streaming software; others apply static price points or overlook hybrid-cloud adoption that our model captures.
Benchmark comparison
| Market Size | Anonymized source | Primary gap driver |
|---|---|---|
| USD 7.5 B (2024) | Mordor Intelligence | - |
| USD 6.2 B (2024) | Regional Consultancy A | Omits professional services and private-cloud deployments |
| USD 5.09 B (2024) | Global Consultancy B | Focuses on surveillance use cases only |
| USD 13.3 B (2024) | Industry Journal C | Combines consumer streaming software with enterprise seats |
Taken together, the comparison shows that Mordor's carefully bounded scope, transparent variable set, and routine updates provide a balanced, repeatable baseline that decision-makers can rely on with confidence.


Key Questions Answered in the Report
What is the video as a service (VaaS) market size forecast for 2031?
The video as a service market size is expected to reach USD 16.39 billion by 2031.
Which region is growing fastest in the video as a service (VaaS) market?
Asia-Pacific is projected to register a 16.55% CAGR from 2026 to 2031, the highest among all regions.
Why are hybrid-cloud deployments gaining traction?
Organisations want public-cloud elasticity for live events while moving recordings on premises for compliance, propelling a 18.62% CAGR in hybrid models.
Which industry vertical shows the strongest growth outlook?
Healthcare is accelerating at an 18.05% CAGR as hospitals expand virtual wards and remote patient monitoring.
How do carbon-reduction goals influence adoption?
Enterprises substitute business travel with video, generating validated CO₂e savings that feed directly into ESG reports and carbon-credit strategies.
What role does AI play in the video as a service industry?
AI enhances searchability, compliance auditing, translation, and sentiment analysis of video assets, extending value beyond live meetings into structured knowledge bases.
Page last updated on:


