
Market Overview
| Study Period | 2021 - 2031 |
|---|---|
| Market Volume (2026) | 6.03 Terawatt |
| Market Volume (2031) | 11.49 Terawatt |
| Growth Rate (2026 - 2031) | 13.78 % |
| Fastest Growing Market | Asia Pacific |
| Largest Market | Asia Pacific |
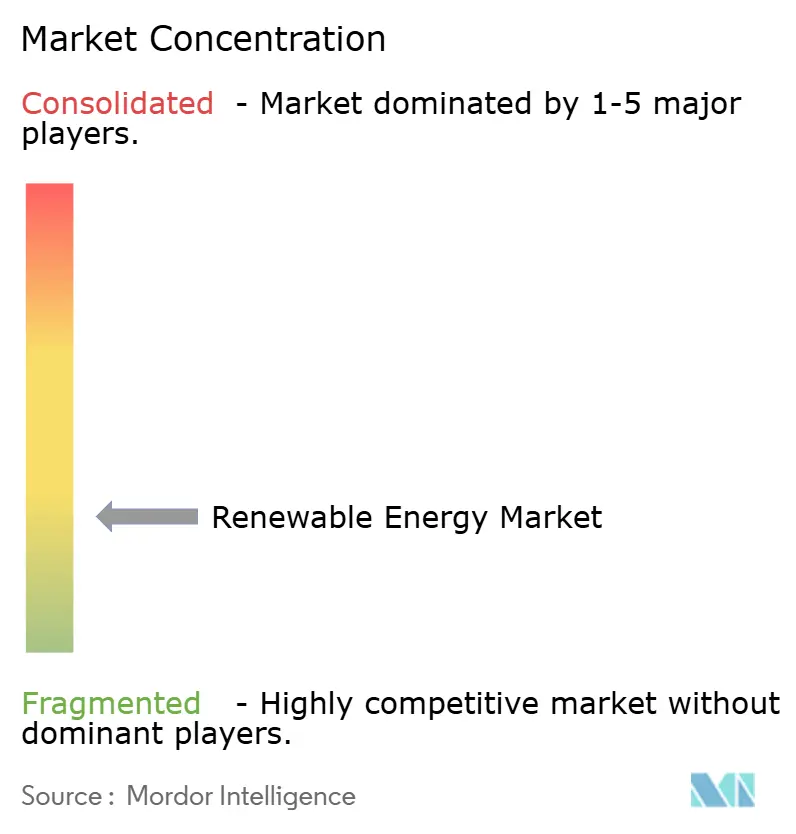
| Market Concentration | Low |
Major Players *Disclaimer: Major Players sorted in no particular order Image © Mordor Intelligence. Reuse requires attribution under CC BY 4.0. | |
Renewable Energy Market Analysis by Mordor Intelligence
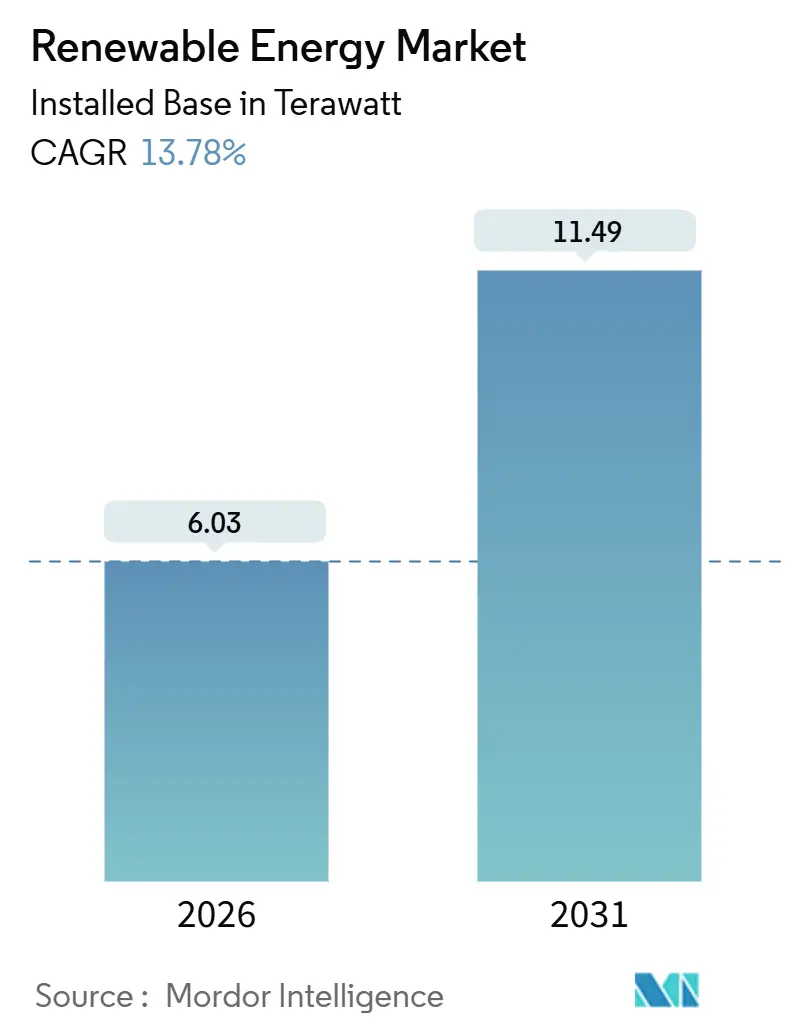
The Renewable Energy Market size in terms of installed base is expected to grow from 6.03 Terawatt in 2026 to 11.49 Terawatt by 2031, at a CAGR of 13.78% during the forecast period (2026-2031).
This expansion is anchored by multi-gigawatt corporate power-purchase agreements that pull projects forward, alongside green-hydrogen ventures that create demand unlinked to traditional grids. Module cost compression, faster permitting, and electrolyzer-driven offtake are converging to make incremental capacity economically attractive even in saturated markets. Competitive dynamics are shifting as independent power producers combine low cost of capital with turnkey EPC offerings, steadily eroding the position of vertically integrated utilities. Meanwhile, hybrid solar-wind-storage systems are emerging as a hedge against curtailment, offering dispatchable renewable electricity that accelerates long-duration storage adoption. In this context, the renewable energy market will see rising margin pressure on legacy developers but expanded opportunity for OEMs that integrate downstream.
Key Report Takeaways
- By technology, Solar Energy accounted for 44.61% of renewable energy market share in 2025, while Ocean Energy is forecast to advance at a 36.95% CAGR to 2031.
- By end-user, Utilities held 66.85% share of the renewable energy market size in 2025, whereas the Commercial and Industrial segment is growing at 16.73% CAGR through 2031.
- By geography, Asia-Pacific commanded 57.23% of installed capacity in 2025, and is accelerating at a 16.19% CAGR between 2026 and 2031.
Note: Market size and forecast figures in this report are generated using Mordor Intelligence’s proprietary estimation framework, updated with the latest available data and insights as of January 2026.
Market Trends and Insights
Drivers Impact Analysis of Renewable Energy Market*
| Driver | (~) % Impact on CAGR Forecast | Geographic Relevance | Impact Timeline |
|---|---|---|---|
| Corporate PPAs accelerating utility-scale builds | +2.8% | North America, Europe, APAC spillover | Medium term (2-4 years) |
| Hyperscale data-center demand boosting solar-wind procurement | +1.9% | Nordics, Ireland, U.S. Pacific Northwest | Short term (≤ 2 years) |
| Green-hydrogen gigawatt pipelines driving capacity additions | +2.4% | MENA, Australia, Chile | Long term (≥ 4 years) |
| EU REPowerEU fast-track permitting cutting onshore-wind lead times | +1.6% | Southern Europe (Spain, Italy, Greece) | Short term (≤ 2 years) |
| Source: Mordor Intelligence | |||
Corporate Power-Purchase Agreements Accelerating Utility-Scale Builds in North America & Europe
Corporate PPAs have matured into 15-20-year balance-sheet hedges that replace merchant risk with investment-grade credit, allowing developers to reach financial close more quickly than under traditional utility tenders. Meta’s 1.5 GW portfolio with RWE in 2024 exemplifies how data-center offtakers underwrite multi-country pipelines, compressing solar build cycles to under 24 months and onshore wind to roughly 30 months. Developers prioritize contracted projects over speculative assets, so the renewable energy market is now paced by large buyers rather than regulators. As more corporates set science-based targets, aggregate demand is expected to exceed 40 GW of new capacity annually through 2030, reinforcing the long-term trajectory of the renewable energy market. The resulting visibility lowers the weighted average cost of capital and lifts the deployment ceiling in high-penetration grids.
Hyperscale Data-Centre Demand Boosting Solar-Wind Procurement in the Nordics & Ireland
AI workloads are driving electricity growth at cloud campuses, pushing operators to lock in renewable generation in regions with surplus hydro and wind. Google’s 500 MW Norwegian wind deal illustrates how firms exploit the Nordics’ clean-power mix, whereas grid congestion around Dublin has shifted investment toward Sweden and Finland. The renewable energy market responds by developing on-site solar and storage that reduce dependence on transmission-constrained nodes. This dynamic channels capital into distributed assets, encouraging grid-forming inverters and microgrid architectures. Near-term demand elasticity remains high, and developers that can bundle generation with batteries gain preferred-supplier status with hyperscalers.
Green-Hydrogen Gigawatt Pipelines Driving Capacity Additions in MENA & Australia
Projects such as Saudi Arabia’s NEOM (4 GW wind-solar hybrid) and Fortescue’s 5 GW Pilbara complex are contracting renewable output directly for electrolyzers, circumventing grid offtake and spawning a vertically integrated value chain. Because hydrogen buyers sign 20-year supply agreements, developers secure revenue certainty comparable to PPAs, but with commodity upside if ammonia and e-methanol markets tighten. The renewable energy market, therefore, gains a second, parallel demand channel likely to represent 10-15% of global additions by 2030. Electrolyzer-linked renewables also favor high-capacity-factor sites, accelerating wind and solar build-outs in sparsely populated deserts and coastal zones.
EU REPowerEU Fast-Track Permitting Cutting Onshore-Wind Lead-Times in Southern Europe
Spain’s approval of 3.2 GW of projects in 2024 under the fast-track regime demonstrates the value of one-year environmental reviews.[1] Developers in Italy and Greece report similar acceleration, shaving two to three years off pre-construction schedules. For the renewable energy market, this frees scarce EPC resources and heavy-lift cranes for additional projects, indirectly lowering balance-of-plant costs. Coupled with supportive auction floors, Southern Europe is emerging as a cost-competitive wind corridor, offsetting Northern Europe’s vessel bottlenecks. Over the next two years, an incremental 5 GW annually could come online sooner than prior baseline outlooks suggested, nudging the overall renewable energy market size higher than consensus.
Restraints Impact Analysis of Renewable Energy Market*
| Restraint | (~) % Impact on CAGR Forecast | Geographic Relevance | Impact Timeline |
|---|---|---|---|
| Grid Congestion & Curtailment Risks in ERCOT and Inner Mongolia | -1.40% | US (Texas), China (Inner Mongolia, Gansu) | Short term (≤ 2 years) |
| End-of-Life Blade Waste Regulations Raising Costs in Germany & France | -0.80% | Germany, France, EU-wide spillover | Medium term (2-4 years) |
| Lack of Long-Duration Storage Slowing High VRE Penetration in SE-Asia | -1.10% | Southeast Asia (Vietnam, Thailand, Indonesia, Philippines) | Medium term (2-4 years) |
| Local-Content Mandates Inflating Offshore-Wind CAPEX in India & Brazil | -0.90% | India, Brazil, emerging offshore markets | Long term (≥ 4 years) |
| Source: Mordor Intelligence | |||
Grid Congestion & Curtailment Risks in ERCOT (US) and Inner Mongolia (CN)
ERCOT curtailed 3.2 TWh of renewable electricity in 2024 as West Texas output overwhelmed transmission to Houston. Interconnection queues now exceed five years, delaying projects such as Enel’s 300 MW Azure Sky wind farm until 2026. In China, Inner Mongolia’s curtailment still hovers near 4%, prompting price discounts of 15-20% to place power with eastern buyers. These factors trim internal rates of return and temporarily defer roughly 10 GW of high-resource wind and solar additions. While new HVDC lines will eventually alleviate constraints, short-term drag on the renewable energy market CAGR is inevitable.
End-of-Life Blade Waste Regulations Raising Costs in Germany & France
Germany’s Circular Economy Act and France’s parallel mandate now require 85% blade-mass recycling, lifting decommissioning costs to USD 16,000-27,000 per blade.[2] For older 3 MW turbines nearing 20-year lifespans, this adds 2-3% to the levelized cost of energy, encouraging operators to retrofit rotors rather than repower wholesale. The ripple effect slows replacement demand for new turbines, marginally capping upside for the renewable energy market until recycling supply chains scale and unit costs fall.
*Our forecasts treat driver/restraint impacts as directional, not additive. The impact forecasts reflect baseline growth, mix effects, and variable interactions.
Renewable Energy Market Segment Analysis
By Technology:
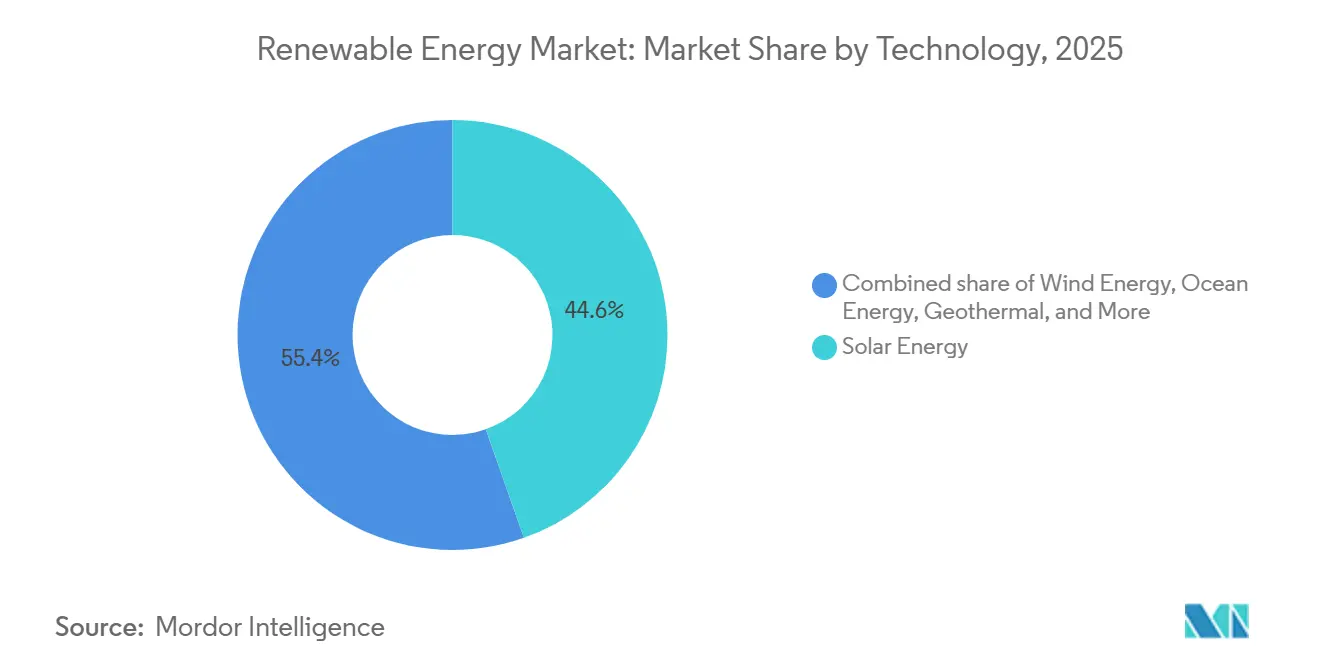
Ocean Energy Surges from Niche BaseOcean Energy’s 36.95% CAGR from 2026 to 2031 makes it the fastest-growing slice of the renewable energy market. Orbital Marine Power’s 2 MW O2 tidal turbine in Orkney achieved a 74% capacity factor in its debut year, well above offshore wind norms, illustrating tidal predictability.[3] Minesto’s Dragon 12 kites convert low-velocity currents into useful electricity, expanding the resource base beyond high-flow straits. Solar Energy, at 44.61% renewable energy market share in 2025, maintains leadership thanks to crystalline-silicon panel prices that fell to USD 0.12 per watt in 2024 as polysilicon costs dropped below USD 8 per kilogram. Efficiency gains above 25% for TOPCon and heterojunction cells further compress balance-of-system expenses, sustaining competitive parity even in temperate zones.
Wind Energy contributes about 35% of 2025 capacity, benefiting from streamlined EU permitting and upgraded grid links in China. Offshore wind, however, faces escalating CAPEX for floating foundations that run USD 4-5 million per MW, compared with USD 3-4 million for fixed platforms. Hydropower expands modestly as site availability wanes, though China’s 2.4 GW Baihetan pumped-storage plant demonstrates the value of eight-hour storage in a variable-renewable grid.[4] Bioenergy and Geothermal remain niche at under 8%, constrained by feedstock price volatility and limited high-enthalpy reservoirs, yet Iceland’s 90 MW Theistareykir expansion shows geothermal’s baseload appeal. Collectively, technology diversification shields the renewable energy market from single-segment risk while offering investors multiple entry points.

By End-User:
Commercial and Industrial Segment Outpaces UtilitiesCommercial and Industrial buyers are expanding their share of the renewable energy market at a 16.73% CAGR, propelled by scope-2 emissions targets and inflation hedging. Amazon Web Services’ 250 MW Irish wind deal and Microsoft’s 10.5 GW Brookfield PPA illustrate hyperscalers’ pivot toward direct procurement. Virtual PPAs allow these buyers to detach from transmission constraints, aggregating generation from geographically dispersed assets to smooth intermittency. This structural shift reduces merchant risk and shortens payback periods for developers, catalyzing incremental gigawatts of capacity that expand the overall renewable energy market size.
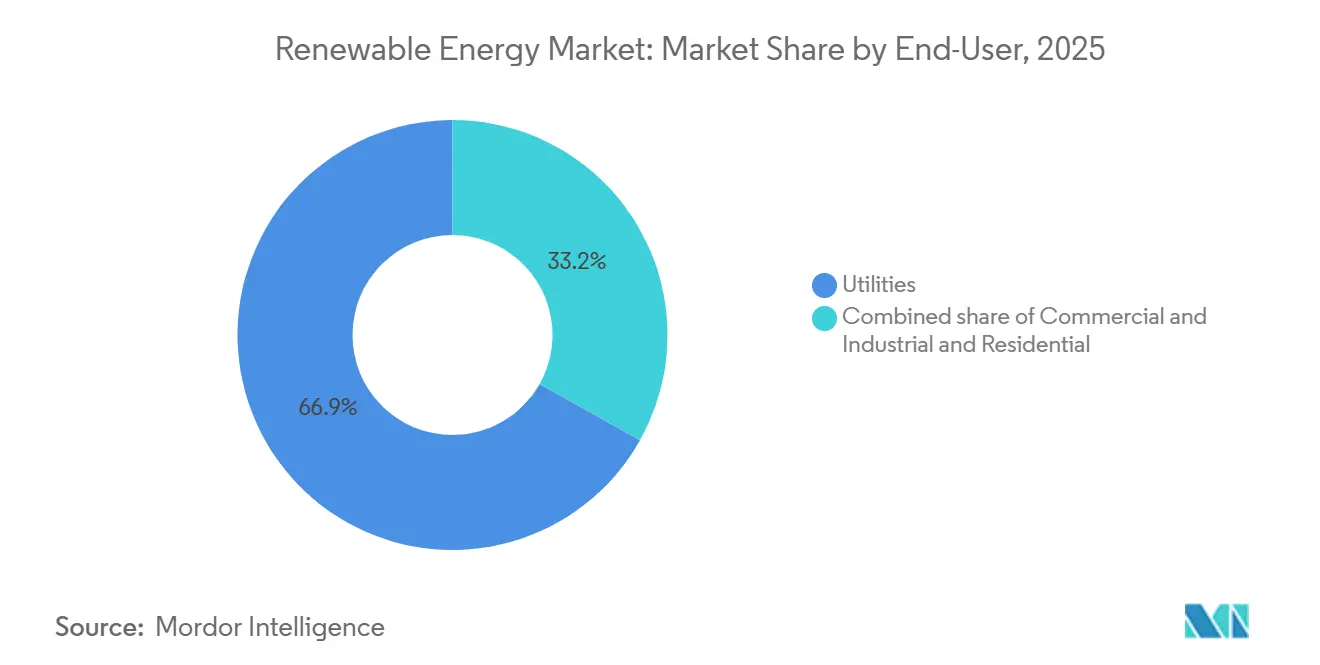
Utilities still account for 66.85% of installed capacity in 2025, largely to meet renewable portfolio standards and replace aging fossil fleets. Yet growth is slowing in grids where variable renewables already exceed 30%; ERCOT, for instance, now channels capital toward storage and transmission upgrades rather than pure generation. NextEra Energy’s 2024 pivot toward co-located batteries exemplifies the changing investment mix. Residential adoption lags due to upfront costs ranging from USD 15,000-25,000 per rooftop system after incentives, combined with uncertain net-metering regimes. Community solar offers a partial remedy in U.S. states with supportive policy, but regulatory fragmentation tempers scale, leaving households a peripheral slice of the renewable energy market.
Geography Analysis
APAC, LATAM and Africa Renewable Energy Market
Asia-Pacific dominated with 57.23% of capacity in 2025 and is forecast to advance at a 16.19% CAGR, led by China’s 216 GW of 2024 installations and India’s 500 GW 2030 target. Chinese state-owned developers are also exporting capital and equipment into Southeast Asia, Latin America, and Africa through concessional loans that bundle modules, turbines, and EPC services. India’s offshore-wind tenders and production-linked incentives aim to localize manufacturing, curbing Chinese import reliance.
North America and Europe Renewable Energy Market
North America’s build-out accelerates under the Inflation Reduction Act, which extends tax credits to 2032 and has already catalyzed USD 150 billion in domestic manufacturing commitments. The United States deployed 32 GW of solar and 8 GW of wind in 2024, although ERCOT’s curtailments reveal transmission lag. Canada targets 90% renewable electricity by 2030 using hydropower and offshore wind, whereas Mexico’s regulatory changes have chilled private investment despite strong irradiance. Europe leverages REPowerEU to compress permitting, with Spain and Greece benefiting most; Germany still battles interconnection delays exceeding 24 months.
MEA and South America Renewable Energy Market
The Middle East and Africa emerge as hydrogen exporters, evidenced by Saudi Arabia’s NEOM (4 GW electrolyzer) and Egypt’s 10 GW Gulf of Suez wind plan. South America’s growth revolves around Brazil’s 4 GW wind auction and Chile’s USD 25/MWh solar corridor. Argentina co-locates solar with lithium mines to decarbonize processing. These regional dynamics collectively broaden the renewable energy market footprint and diversify supply chains.

Regulatory Landscape
Policy support for renewables increasingly blends procurement reform with supply-chain and trade controls. Procurement is centered on competitive mechanisms, with auctions becoming a dominant route for new capacity awards in many markets. In that setting, auction design (risk allocation, indexation, and delivery guarantees) is emerging as a key lever used by authorities to improve project bankability and delivery discipline, as reflected in IRENA discussions and guidance released in 2026.
At the same time, the global policy environment is more complex and multi-layered. The IEA Global Energy Policies Hub tracks over 6,500 measures across 84 countries, which increases compliance burden for developers and OEMs operating across multiple jurisdictions. Regulation is also moving deeper into system integration and resilience. Several markets are shifting away from legacy fixed tariffs toward competitive procurement, with a reported transition toward auctions in China during 2025, while a more defensive trade posture is shaping equipment and materials flows through duties and export controls on critical inputs. This combination is pushing developers and manufacturers toward local-content strategies and more rigorous supply-chain provenance processes, alongside permitting and grid-connection compliance, particularly where grid congestion and curtailment are already affecting project economics.
Competitive Landscape
The renewable energy market remains moderately fragmented, with the top 10 developers controlling about 35-40% of global capacity. Independent power producers such as Brookfield Renewable and Invenergy are gaining ground because institutional capital and lean organizations permit rapid execution outside regulated frameworks. Microsoft’s 10.5 GW multi-year PPA with Brookfield is a watershed, underscoring the pivot toward de-risked mega-pipelines. OEMs like Vestas are integrating downstream, purchasing 500 MW of Spanish projects in 2024 to guarantee turbine offtake and margin retention.
Hybrid solar-wind-storage packages are proliferating. Fluence and Powin partner with developers to embed battery systems that capture frequency and reserve revenue historically reserved for gas peakers. Floating offshore wind developers Equinor and Ørsted accumulate seabed leases before rivals master mooring technologies, raising entry barriers. Patent filings for grid-forming inverters rose 28% in 2024, signaling that control software and power electronics confer a competitive advantage. The net effect is escalating technology differentiation even as asset ownership fragments, shaping a renewable energy market where intellectual property and project pipeline depth both confer leverage.
Renewable Energy Industry Leaders
-
NextEra Energy, Inc.
-
Ørsted A/S
-
Iberdrola, S.A.
-
Vestas Wind Systems A/S
-
JinkoSolar Holding Co. Ltd.
- *Disclaimer: Major Players sorted in no particular order
Renewable Energy Market Companies Covered in this Report
- EPC Developers/Operators/Owners
- Equipment Suppliers
Market Opportunities and Future Outlook
Record deployment and shifting demand channels are creating whitespace in grid and flexibility infrastructure that sits alongside generation build-outs. IRENA reported 692 GW of renewable capacity additions in 2025, with solar PV contributing roughly three-quarters and wind about one-fifth. That lifted global renewable power capacity to 5,149 GW by end-2025, around 49% of total installed power capacity. In the same year, battery storage additions increased by about 40% to nearly 110 GW, which supports commercial momentum for hybrid solar-wind-storage configurations, grid-forming power electronics, and utility-scale balancing services in markets where renewable shares are already high.
Network modernization and offshore construction pipelines also remain investable focal points tied to near-term execution programs rather than abstract targets. In Europe, the EU reached 30% solar PV and wind share in 2025, putting grid reinforcement, interconnection capacity, and curtailment management ahead of generation alone. At the company level, Iberdrola renewed key Brazilian electricity distribution concessions via Neoenergia entities and opened a 50 billion reais investment cycle through 2030 to expand and modernize networks. Orsted and PGE also moved Baltica 2 into full-scale offshore installation in 2026. Taken together with the continued scaling of corporate PPAs cited across major markets, these developments point to near-term opportunity in contracted renewables pipelines bundled with storage, transmission access solutions, and regulated network capex that supports higher variable renewable penetration.
Recent Industry Developments in Renewable Energy Market
- July 2026: NextEra Energy and Dominion Energy filed documentation to combine, advancing a proposed all-stock transaction that targets a scaled regulated-utility platform with a large generation footprint. The filing step moves the deal into formal review pathways, and its outcome has direct implications for capital allocation, grid investment pacing, and procurement scale in several fast-growing US states.
- May 2026: Orsted and PGE kicked off full-scale offshore installation for the 1.5 GW Baltica 2 offshore wind farm in the Baltic Sea. With monopile installation activities scheduled to run through Q4 2026, the project adds near-term visibility to vessel demand, foundation supply chains, and balance-of-plant execution across the European offshore wind ecosystem.
- May 2024: The Hunter Hydrogen Infrastructure Masterplan launched in Australia, outlining steps to develop a major hydrogen hub and the enabling infrastructure around it. The program strengthens the linkage between new renewable generation and electrolyzer-driven offtake, supporting additional build-out in high-resource zones beyond traditional grid demand centers.
Renewable Energy Market Report Scope and Research Methodology
Market Definition and Coverage
For this study, the renewable energy market is defined as the global installed base of power generation capacity that uses renewable resources, and it is tracked in gigawatts across new additions and retirements.
Scope exclusions: Nuclear power, fossil-based cogeneration, and conventional pumped-storage plants that are classified as storage are excluded from the market totals.
Segments Covered in This Report
- By Technology
- Solar Energy (PV and CSP)
- Wind Energy (Onshore and Offshore)
- Hydropower (Small, Large, PSH)
- Bioenergy
- Geothermal
- Ocean Energy (Tidal and Wave)
- By End-User
- Utilities
- Commercial and Industrial
- Residential
- By Geography
- North America
- United States
- Canada
- Mexico
- Europe
- United Kingdom
- Germany
- France
- Spain
- Nordic Countries
- Russia
- Rest of Europe
- Asia-Pacific
- China
- India
- Japan
- South Korea
- Malaysia
- Thailand
- Indonesia
- Vietnam
- Australia
- Rest of Asia-Pacific
- South America
- Brazil
- Argentina
- Colombia
- Rest of South America
- Middle East and Africa
- Saudi Arabia
- United Arab Emirates
- South Africa
- Egypt
- Rest of Middle East and Africa
- North America
Data Sources, Market Sizing, and Validation
Desk Research
Desk research helped us set the factual boundary of what counts as renewable generation and how capacity is reported across countries. We mainly relied on public sources such as IEA statistics, IRENA renewable capacity databases, World Bank and UN datasets, and government energy regulators and grid operators that publish installed capacity and commissioning records.
We also reviewed company annual reports, investor presentations, project press releases, and reputable energy and policy publications to understand timing lags, repowering practices, and how retirements are treated. Where needed, subscription databases were used for company financials and intelligence, patent tracking, and shipment-level import and export checks for selected equipment categories. The sources mentioned here are illustrative, and many other public references were used for data collection, cross-checks, and clarification.
Primary Interviews and Surveys
Primary work focused on validating what the secondary data does not always show clearly, especially the split between utility and distributed additions and the typical time gap between project award, commissioning, and grid connection. We spoke with developers, utilities, EPC and engineering stakeholders, investors, and policy experts across APAC, EMEA, and the Americas so that assumptions on additions, retirements, and reporting conventions could be checked and adjusted where required.
Distribution of primary research fieldwork respondents
| Company type | Respondent position | Region |
|---|---|---|
| Top tier: 27% | CXOs: 16% | APAC: 40% |
| Mid tier: 57% | Functional/Unit leaders: 26% | EMEA: 34% |
| Smaller Players: 16% | Managers: 58% | Americas: 26% |
Market-Sizing & Forecasting
Sizing starts from a top-down reconstruction of the global installed base using official capacity series, commissioning pipelines, and retirements, which are then aligned to a consistent renewable definition across technologies and regions. To keep the totals grounded, selective bottom-up approximations are used as a check, such as sampling annual additions for key markets and reconciling them to public project lists and grid-connection announcements.
Key model inputs include annual capacity additions by technology, retirement and repowering rates, grid-connection timelines, policy and tender volumes, and regional build-out constraints such as interconnection and curtailment signals. Since the market is tracked in gigawatts, our model also watches reporting differences, for example nameplate vs AC rating conventions and whether distributed systems are captured in national registers.
For forecasting, scenario analysis is used because policy targets, permitting speed, and project execution can shift the run rate quickly across regions. Assumptions for the base case are refined through expert feedback, and when data gaps appear in smaller markets, proxy indicators like national renewable targets and historical additions are used before being stress-tested against regional totals.
Data Validation & Update Cycle
Outputs are checked against independent signals such as published national capacity balances, regional renewable scorecards, and the implied pace of annual additions. When variances are large, the underlying drivers are reviewed, and follow-up calls are triggered to confirm whether the difference is definition-based, timing-related, or a true market change.
Before sign-off, the model is reviewed in multiple steps so that unit consistency, aggregation logic, and year-on-year movements are sensible at the country, regional, and global levels. Reports are refreshed annually, and interim updates are done when material events occur, such as major policy changes or large revisions to official capacity statistics. Right before delivery, a final pass is completed so clients receive the most recent view available.
Mordor Intelligence's Global Renewable Energy Market Market Size Compared Against Other Published Estimates
It is common to see renewable energy market estimates that do not match each other, even when the topic name looks the same. Differences usually come from what is being measured (capacity versus revenue), what is included in scope, and how timing and updates are handled.
By tracking installed capacity additions and retirements in gigawatts, and then reconciling national registry totals across regions, Mordor Intelligence reports the market at USD 6030.39 B (2026), while some publications report a revenue-based number that can also bundle adjacent energy activities. Currency conversion year, whether distributed systems are fully captured, and whether repowering is treated as new capacity are also common gap drivers.
Benchmark comparison
| Source | Market Size | Gaps in Research Methodology |
|---|---|---|
| Mordor Intelligence | USD 6030.39 B (2026) | |
| Global Consultancy A | USD 1078.70 B (2025) | Uses a revenue value metric with different pricing and tariff assumptions, so the total moves with electricity prices and subsidy structures rather than installed base tracking. |
| Industry Publisher B | USD 1250.00 B (2023) | Reported as value for renewable technologies and uses an earlier base year, which can shift totals if policy cycles and build-out pace changed after the base period. |
The benchmark spread is mainly explained by the metric choice and the way scope is translated into a single number. A capacity-led model stays tied to what is commissioned and operating, and it can be repeated using public capacity series and clear adjustment rules, which helps keep assumptions transparent for decision-making.
Key Questions Answered in the Report
How Big is the Renewable energy market?
Installed capacity reaches 6,030.39 GW in 2026, rising toward 11,498.32 GW by 2031 at a 13.78% CAGR.
Which technology holds the largest share?
Solar Energy accounts for 44.61% of renewable energy market share in 2025, far ahead of other segments.
What region leads capacity additions?
Asia-Pacific commands 57.23% of 2025 capacity and grows at a 16.19% CAGR, driven by China and India.
Why are corporate PPAs important?
PPAs provide long-term revenue certainty that lowers financing costs and accelerates multi-gigawatt build-outs.
What is the fastest-growing end-user segment?
Commercial and Industrial buyers expand at 16.73% CAGR through 2031, propelled by behind-the-meter solar and virtual PPAs.