Renewable Methanol Market Size and Share
Market Overview
| Study Period | 2020 - 2031 |
|---|---|
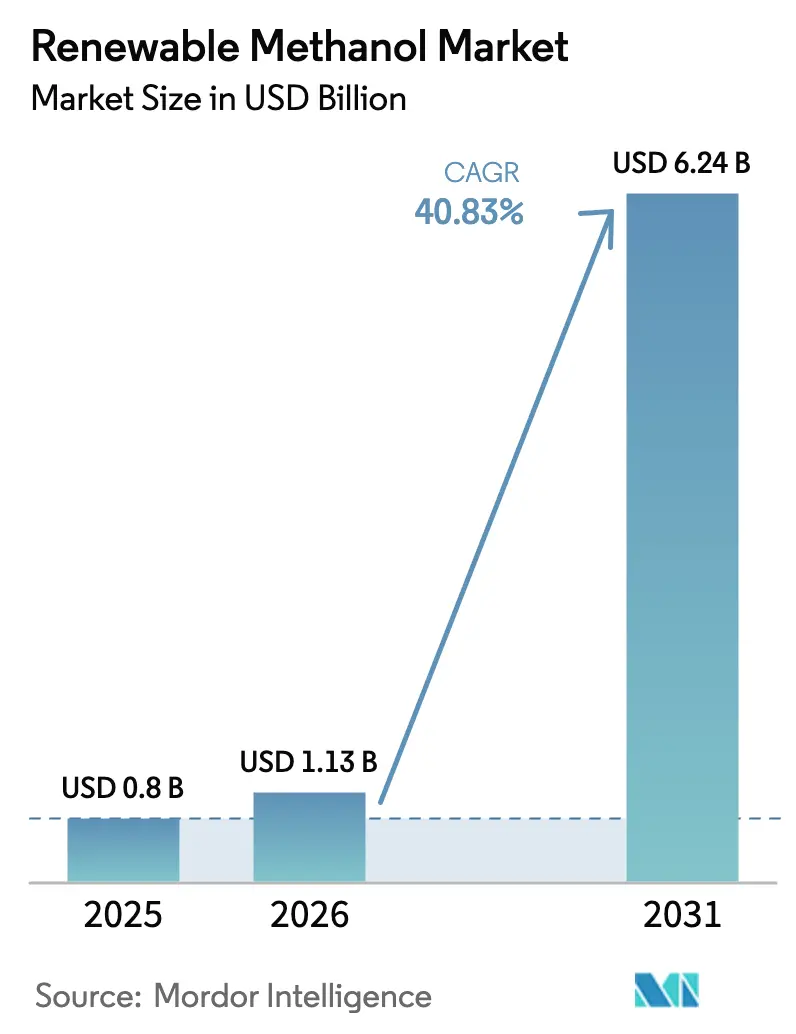
| Market Size (2026) | USD 1.13 Billion |
| Market Size (2031) | USD 6.24 Billion |
| Growth Rate (2026 - 2031) | 40.83% CAGR |
| Fastest Growing Market | Asia Pacific |
| Largest Market | Asia Pacific |
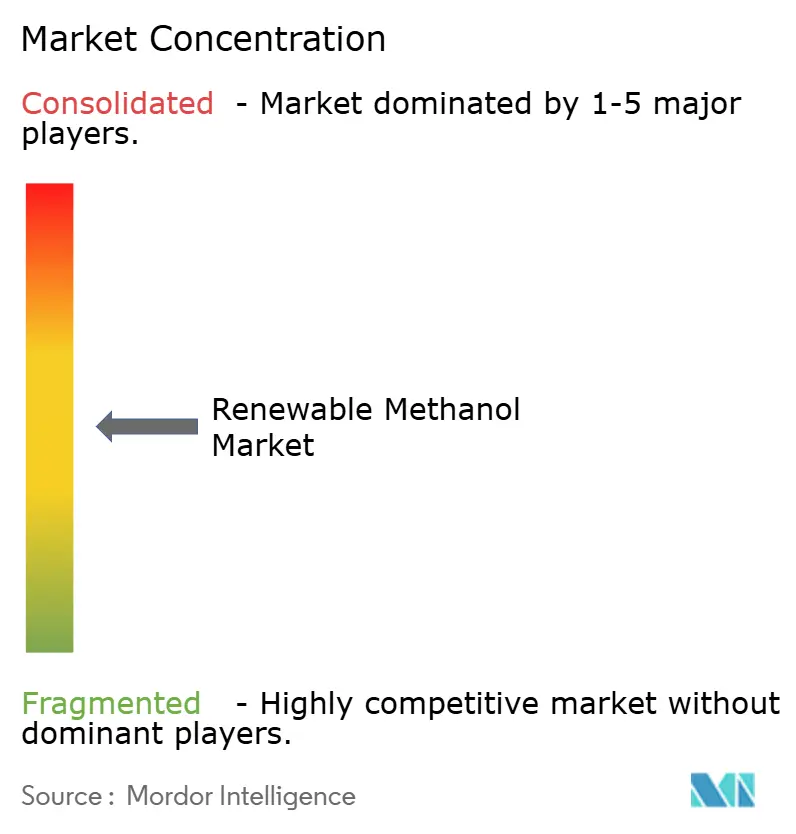
| Market Concentration | Medium |
Major Players *Disclaimer: Major Players sorted in no particular order Image © Mordor Intelligence. Reuse requires attribution under CC BY 4.0. | |
Renewable Methanol Market Analysis by Mordor Intelligence
The Renewable Methanol Market size was valued at USD 0.8 billion in 2025 and estimated to grow from USD 1.13 billion in 2026 to reach USD 6.24 billion by 2031, at a CAGR of 40.83% during the forecast period (2026-2031). Robust policy mandates, shipping-sector decarbonization targets and integrated power-to-methanol hubs are propelling the renewable methanol market toward mainstream adoption. Asia-Pacific’s large-scale projects, Europe’s binding maritime rules and North America’s tax-credit support are widening the addressable base for carbon-neutral fuels. Technology providers are commercializing high-efficiency catalyst loops that push carbon conversion rates close to 98%, while utilities and independent power producers are tapping curtailed renewable electricity as a low-marginal-cost feedstock. Cost parity with fossil methanol remains elusive in most free-market applications, yet the regulatory premium in marine bunkering, chemicals and sustainable aviation fuel is narrowing the economics gap and accelerating project final-investment decisions in multiple regions.
Key Report Takeaways
- By production process, Biomass-based production led with 38.21% share of the renewable methanol market in 2025, while green hydrogen plus CO₂ power-to-X routes are advancing at a 42.47% CAGR through 2031.
- By feedstock source, Agricultural residues supplied 30.12% of feedstock, and renewable electricity-based pathways are expanding at a 41.92% CAGR.
- By application, Chemicals and derivatives accounted for 31.66% of the renewable methanol market share in 2025; marine fuel applications are tracking a 42.11% CAGR.
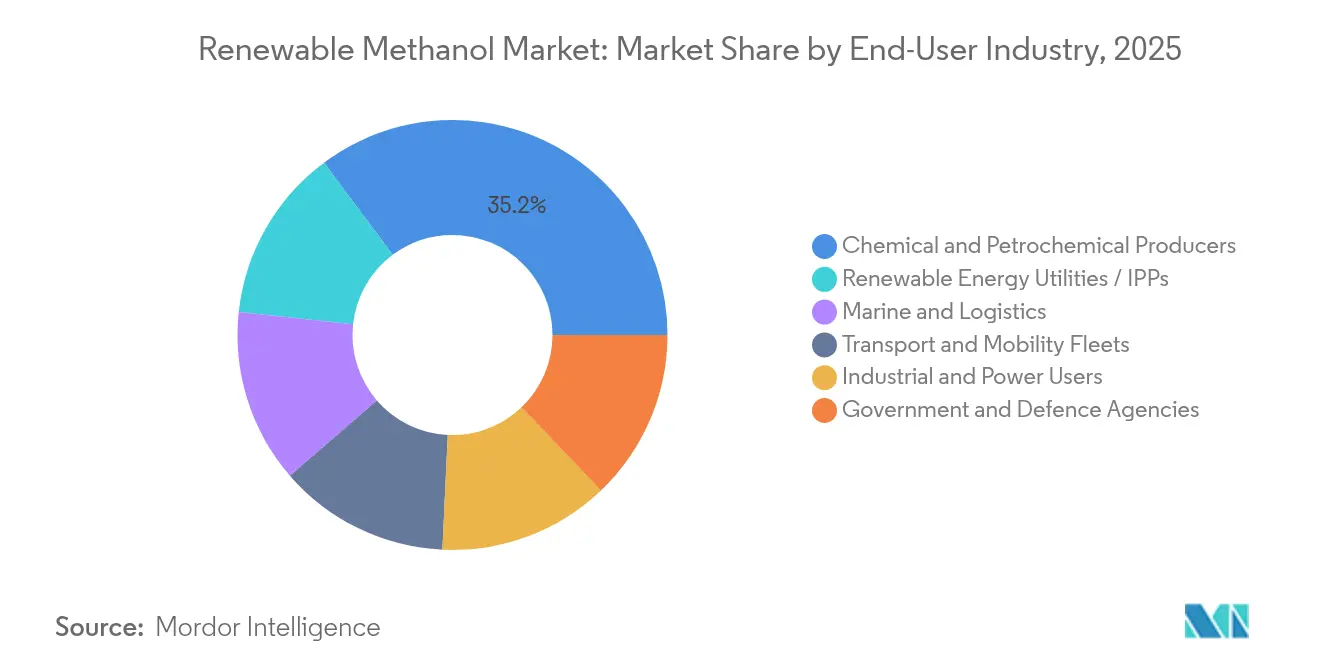
- By end-user industry, Chemical and petrochemical producers controlled 35.20% of end-user demand, while utilities and independent power producers post a 42.86% CAGR.
- By geography, Asia-Pacific held 44.85% of revenue, whereas Europe records the fastest regional growth at 41.65% CAGR.
Note: Market size and forecast figures in this report are generated using Mordor Intelligence’s proprietary estimation framework, updated with the latest available data and insights as of 2026.
Global Renewable Methanol Market Trends and Insights
Drivers Impact Analysis*
| Driver | (~) % Impact on CAGR Forecast | Geographic Relevance | Impact Timeline |
|---|---|---|---|
| Growing demand for decarbonised synthetic fuels & marine bunkering | +12.5% | Global, with concentration in Europe & Asia-Pacific | Medium term (2-4 years) |
| Policy mandates & incentives for bio- and e-methanol adoption | +10.8% | Europe, North America, China | Short term (≤ 2 years) |
| Technological advances in biomass/CO₂/H₂-based production | +8.2% | Global | Long term (≥ 4 years) |
| Scale-up of green-H₂ and CCUS infrastructure | +6.7% | APAC core, spill-over to MENA | Medium term (2-4 years) |
| Corporate net-zero offtake contracts for low-CI chemicals | +4.9% | North America & EU | Short term (≤ 2 years) |
| Regional renewables curtailment driving P-to-MeOH hubs | +3.4% | China, MENA, Australia | Long term (≥ 4 years) |
| Source: Mordor Intelligence | |||
Growing demand for decarbonised synthetic fuels & marine bunkering
Newbuild orders for dual-fuel methanol containerships overtook LNG vessel orders in 2024, underscoring strong market confidence in fuel availability and regulatory compliance benefits. The International Maritime Organization’s net-zero ambition for 2050 is directing shipowners toward solutions that minimize retrofit complexity and leverage existing bunkering infrastructure. Maersk’s expanding fleet demonstrates the commercial pull, with each vessel cutting up to 280 tons of CO₂ per operational day on green methanol. Singapore, Rotterdam and Houston have introduced dedicated methanol bunkering lines, and sales in Singapore rose from 300 tons in 2023 to 1,600 tons in 2024.
Policy mandates & incentives for bio- and e-methanol adoption
The EU FuelEU Maritime regulation, in force since January 2025, sets a 2% greenhouse-gas intensity cut this year and an 80% cut by 2050, complemented by a 2% sub-target for renewable fuels of non-biological origin by 2034[1]European Commission, “Regulation (EU) 2023/1805 establishing FuelEU Maritime,” europa.eu. A multiplier of two for e-fuels until 2035 doubles their compliance value, improving internal rates of return for early investors. In the United States, the Inflation Reduction Act grants up to USD 3.0 kg-1 production credit for clean hydrogen, directly lowering e-methanol cash costs. China’s 2024 encouraged technologies catalogue lists green methanol synthesis, unlocking preferential land, grid connection and tax treatment. Although certification regimes vary—ISCC EU, ISCC PLUS and CORSIA—the guaranteed demand pool created by overlapping mandates offers unprecedented bankability for large-scale projects.
Technological advances in biomass/CO₂/H₂-based production
Next-generation catalyst platforms have pushed carbon and hydrogen conversion efficiencies to 98%, trimming energy penalties and boosting plant throughputs. Johnson Matthey’s eMERALD loop and Topsoe’s dynamic eMethanol circuit accommodate variable electrolyser output, enabling flexible operations synced to fluctuating renewable power. Carbon Recycling International’s Anyang plant transforms 160,000 t y-1 of lime-kiln CO₂ into 110,000 t y-1 of methanol and validates industrial-scale carbon utilization. Waste-gasification pathways convert municipal refuse into syngas that yields methanol with an 87% cut in global-warming potential versus landfilling. Gigawatt-class alkaline electrolysers deployed in Inner Mongolia produce 90,000 t y-1 green hydrogen, showcasing supply-chain progress, though platinum-group-metal intensity in proton-exchange stacks could strain future build-out.
Scale-up of green-H₂ and CCUS infrastructure
Sinopec’s 20 billion-yuan hydrogen pipeline linking Inner Mongolia to Beijing exemplifies the backbone needed for cross-regional feedstock flow. In the Middle East and North Africa, governments outline USD 130 billion in projected annual clean-hydrogen export earnings by 2050, much of which will ship as methanol to leverage liquid-fuel logistics. Power-to-X hubs paired with biogas or ethanol plants gain an immediate CO₂ stream and drop levelized production costs below EUR 650 t-1. Nordic hydrogen valleys list 167 projects with 8 million t y-1 hydrogen capacity, and CCUS additions such as Lake Charles Methanol’s 1 million t y-1 CO₂ sequestration plan reinforce low-carbon credentials. Long-haul pipelines plus geological storage are therefore accelerating the route to cost-competitive, large-volume supply.
Restraints Impact Analysis*
| Restraint | (~) % Impact on CAGR Forecast | Geographic Relevance | Impact Timeline |
|---|---|---|---|
| High production cost versus fossil methanol | -8.9% | Global | Medium term (2-4 years) |
| Limited sustainable feedstock availability | -6.2% | Europe, North America | Long term (≥ 4 years) |
| Electrolyser supply-chain bottlenecks | -4.7% | Global | Short term (≤ 2 years) |
| Fragmented sustainability certification regimes | -3.1% | Global | Short term (≤ 2 years) |
| Source: Mordor Intelligence | |||
High production cost versus fossil methanol
Renewable methanol production currently ranges between USD 350 t-1 and USD 700 t-1, compared with USD 100 t-1 to USD 250 t-1 for conventional supply, chiefly because renewable hydrogen contributes around 65% of total costs. Forward-curve modelling suggests e-methanol could reach EUR 315-350 t-1 by 2050 at prime resource locations, yet present levelized costs still sit above EUR 1,200 t-1. Bio-methanol narrows the gap with carbon abatement below EUR 100 t-1 CO₂-eq, though feedstock caps restrict scale. Carbon pricing within FuelEU Maritime already lifts penalties to the point where renewable methanol at USD 1,300-1,800 t-1 is compliance-neutral, but outside regulated niches, subsidies or green-premium contracts remain essential.
Limited sustainable feedstock availability
Agricultural residues, responsible for 30.45% of input volumes, face competing uses in bioenergy and soil-health programs, reducing predictable supply for year-round operation. Geographic clustering of biogenic CO₂—often near ethanol or biogas plants—means long-distance transport unless synthesis co-locates. Forestry residues in Nordic regions and municipal solid-waste streams worldwide offer incremental volumes, yet each pathway requires specialized pre-treatment or gasification infrastructure. Direct-air-capture CO₂, while technically feasible, carries elevated energy loads that inflate marginal costs. Mobilizing only 20-30% of Germany’s identified biogenic resources would satisfy domestic demand but demands coordinated logistics, new storage yards and multimodal hauling networks[2]German Federal Ministry for Economic Affairs, “Biogenic Feedstock Potential for Advanced Biofuels,” bmwi.de .
*Our forecasts treat driver/restraint impacts as directional, not additive. The impact forecasts reflect baseline growth, mix effects, and variable interactions.
Segment Analysis
By Production Process: Power-to-X Pathways Accelerate Despite Biomass Leadership
Biomass-gasification retained 38.21% share of the renewable methanol market in 2025, anchored by commercial references that simplify financing and qualification under ISCC EU. Demonstrations from Enerkem and other waste-to-methanol pioneers confirmed technical reliability and attracted institutional capital seeking proven assets. Power-to-X routes pairing green hydrogen with captured CO₂ are, however, scaling fastest at 42.47% CAGR through 2031. Capital inflows favor projects above 100,000 t y-1 that exploit steep renewable-power cost declines. The renewable methanol market size for power-to-X projects is forecast to expand sharply as electrolyser lead-times fall below 18 months. Near-complete 98% carbon-conversion cycles deliver higher output per unit feedstock, enhancing revenues and easing storage requirements.
A rising class of hybrid configurations mixes waste-derived syngas with surplus hydrogen, balancing feedstock volatility and raising overall plant utilization. Johnson Matthey, thyssenkrupp and Topsoe have booked multi-continent orders for integrated loops adapted to intermittent wind-solar profiles. Electrolyser OEMs report firm backlog exceeding 15 GW equivalent for e-methanol projects commencing 2026-2028, but palladium and iridium availability could limit scale if recycling rates stagnate. Government grant rounds in Europe and tax credits in the United States are therefore prioritizing supply-chain localization for stack components. Long-term, analysts expect cost-learning curves to push unsubsidized renewable methanol toward fossil parity in resource-advantaged regions by the early 2030s, reinforcing the strategic pivot toward power-to-X dominance.


By Feedstock Source: Agricultural Residues Lead While Power-to-X Gains Momentum
Agricultural residues comprised 30.12% of feedstock inputs in 2025, aided by mature collection networks for corn stover, wheat straw and sugarcane bagasse. Commercial plants in Brazil and Australia illustrate how integrated agro-industrial clusters can backfill seasonal gaps through multi-crop sourcing. Captured industrial CO₂ and renewable-electricity based pathways are recording a 41.92% CAGR as electrolyser capital costs drop below USD 500 kW-1. The renewable methanol market share of renewable-electricity feedstock is projected to cross 21% by 2031 as grid-curtailment subsidies incentivize offtake agreements between generators and methanol developers. Forestry residues and municipal solid waste together provide an untapped emissions-reduction lever that aligns with circular-economy objectives.
Power-to-X flexibility allows projects to locate in solar-rich deserts or offshore-wind corridors where biomass is scarce. China’s Inner Mongolia complex integrates 1 GW of alkaline electrolysis with co-located wind and solar, delivering 90,000 t y-1 of green hydrogen to a methanol loop. Nordic forestry residues offer consistent year-round volumes and benefit from existing pellet-logistics capacity. Municipal-solid-waste gasification, though more capital intensive, solves waste-disposal issues for dense urban centers and secures tipping-fee revenue streams that lower overall cost of methanol. Successful feedstock diversification thus cushions developers against price swings and availability shocks, strengthening long-run supply security.
By Application: Marine Fuel Drives Growth Beyond Chemical Dominance
Chemicals and derivatives retained the largest application share at 31.66% in 2025, capitalizing on existing methanol-to-olefins, formaldehyde and acetic-acid assets able to run on renewable feed without design overhauls. Producers such as BASF pursue green-premium contracts with brand-owner customers targeting scope-3 cuts, locking in multiyear supply floors. Parallel to this traditional base, marine fuel adoption is soaring at a 42.11% CAGR, propelled by FuelEU Maritime penalties that make low-carbon fuels economically prudent for ocean carriers. Dual-fuel vessels require minimal additional storage safety measures compared with ammonia, shortening lead-time for fleet decarbonization.
Energy-carrier and stationary-power options are progressing in remote grids where diesel is costly and volatile. Technology licensors are extending methanol reformers for micro-grids and backup power, aligning with load-balancing strategies for high-renewables grids. Methanol-to-jet fuel, awaiting ASTM certification, promises an additional demand wedge by repurposing methanol-to-olefins infrastructure for aviation-grade output. China’s pilot programs for methanol-assisted fuel-cell trucks demonstrate pathways to decarbonize heavy-duty mobility at lower battery-mass penalties, particularly in cold climates. These diversified use cases reinforce a broadening demand canvas that underpins manufacturing scale-up.
By End-user Sector: Utilities Emerge as Growth Leaders Despite Chemical Sector Dominance
Chemical and petrochemical companies commanded 35.20% of end-user demand in 2025, leveraging vertically integrated supply chains and securing renewable methanol via long-term contracts to de-risk capital plans. Strategic offtakes by multinationals ensure bankability for flagship projects such as European Energy’s 42,000 t y-1 Danish plant. Marine-transport leaders like A.P. Moller-Maersk cultivate proprietary production through C2X, aligning upstream security with fleet fuel requirements.
Utilities and independent power producers are the fastest-growing cohort, with a 42.86% CAGR, as they monetize surplus renewables by integrating electrolysers and methanol synthesis loops directly at generation sites. This business model stabilizes cash flows by converting variable spot-price electricity into storable liquid fuel, hedging against curtailment penalties. Transport fleet operators evaluate methanol’s volumetric energy density to extend range over battery-only options, keen on quick refuel cycles. Defense agencies test methanol logistics in remote theaters where liquid-fuel compatibility simplifies supply-chain planning. Collectively, the expansion of non-traditional end-users diversifies revenue streams and mitigates demand risk concentrated in chemicals.
Geography Analysis
Asia-Pacific maintained a 44.85% revenue share in 2025 and is projected to post a 41.02% CAGR through 2031. China’s policy toolbox—encouraged-technology listings, preferential grid access and massive hydrogen-pipeline spend—anchors gigawatt-scale developments such as Shanghai Electric’s 680 MW Jilin complex. Carbon Recycling International’s Anyang plant and Australia’s Solar Methanol 1 facility illustrate the region’s capability to pair abundant renewables with significant carbon-utilization know-how. Japan and South Korea, facing limited domestic renewable land, are deploying import terminals and bunker infrastructure to secure future supply.
Europe is challenging Asia-Pacific supremacy through first-mover regulation. FuelEU Maritime sets binding greenhouse-gas trajectory reductions, and Spain’s Repsol and HIF Global projects spotlight Iberia as a continental production hub. Nordic hydrogen valleys aggregate electrolyser, capture and synthesis assets in cluster configurations that share logistics corridors and workforce pools. The renewable methanol market size for Europe is on track to exceed USD 1.92 billion by 2031 under active construction schedules. Certification complexity remains a hurdle; however, standardized proof-of-sustainability chains under ISCC EU are maturing, smoothing cross-border trade.
North America leverages federal tax incentives and existing industrial gas infrastructure to green-light multibillion-dollar complexes, exemplified by Lake Charles Methanol’s USD 3.24 billion CCUS-enabled plant. Texas hosts ETFuels’ 120,000 t y-1 project, benefiting from low-cost wind and solar capacity factors that exceed 60% combined. The Middle East and North Africa aspire to export leadership by converting stranded sun and wind resources into transportable methanol that sidesteps the cryogenic handling needed for ammonia or liquid hydrogen. Early memoranda of understanding between Gulf developers and European utilities outline 2030 delivery windows, signaling global-scale trade lanes in the making.


Competitive Landscape
The renewable methanol market remains moderately fragmented, with a dozen players each controlling below 10% share, though M&A activity is consolidating production assets. Methanex’s USD 2.05 billion purchase of OCI Global’s methanol arm formed the world’s largest supplier with a globally distributed tank-storage and logistics network. Technology licensors such as Topsoe, Johnson Matthey and thyssenkrupp defend competitive moats through proprietary catalysts, dynamic process control and digital-twin monitoring. Their turnkey packages lower execution risk, encouraging bank lenders to underwrite bigger projects.
Vertically integrated models are emerging as utilities capture greater value by adding methanol synthesis to renewable farms, while shipping lines invest upstream to lock in price visibility. Waste-management firms are entering the arena through refuse-derived-fuel gasification, monetizing tipping fees and reducing landfill liabilities. Digitalization is a differentiator: Johnson Matthey’s JM-LEVO platform provides real-time plant analytics, allowing operators to squeeze incremental efficiency and meet variable-power constraints.
White-space opportunities persist in hybrid feedstock plants combining agricultural residues, captured industrial CO₂ and green hydrogen to balance cost and availability. Australia’s solar-rich corridors and MENA wind-solar corridors are drawing interest from developers aiming at export markets. Collaboration along the value chain—shipowner offtakes, chemical-buyer premiums and utility partnerships—creates self-reinforcing ecosystems that accelerate project development timelines and compress levelized cost trajectories.
Renewable Methanol Industry Leaders
Carbon Recycling International (CRI)
HIF GLOBAL
Methanex Corporation
OCI
Proman AG
- *Disclaimer: Major Players sorted in no particular order

Recent Industry Developments
- January 2025: Repsol announced an investment of more than EUR 800 million in the Tarragona Ecoplanta, a pioneering project in Europe to produce renewable methanol. The facility, that will use gasification, the most advanced waste recovery technology, has received funding from the Innovation Fund of the European Union due to its high potential for reducing emissions and the innovative nature of the project.
- May 2024: Sumitomo SHI FW (SFW) has signed an agreement with Capwatt to provide Front-End Engineering Design (FEED) services for a state-of-the-art syngas production plant, integral to the Mangualde Renewable Methanol project in Portugal. This initiative aims to build a cutting-edge biorefinery capable of producing 80,000 tons of renewable methanol annually.


Global Renewable Methanol Market Report Scope
| Biomass-based Methanol |
| Green H₂ + CO₂ (Power-to-X) |
| Municipal Waste-to-Methanol |
| Captured-CO₂ + Grid Renewables |
| Other Renewable Pathways |
| Biogenic CO₂ |
| Industrial captured CO₂ |
| Agricultural residue biomass |
| Forestry residue biomass |
| Municipal solid waste |
| Renewable electricity (Power-to-X) |
| Marine and Shipping Fuel |
| Chemicals and Derivatives |
| Energy Carrier – Power and Heat |
| Transportation Fuel |
| Energy Storage / H₂ Carrier |
| Other Applications |
| Marine and Logistics |
| Chemical and Petrochemical Producers |
| Renewable Energy Utilities / IPPs |
| Transport and Mobility Fleets |
| Industrial and Power Users |
| Government and Defence Agencies |
| Asia-pacific | China |
| India | |
| Japan | |
| South Korea | |
| Australia and New Zealand | |
| ASEAN Countries | |
| Rest of Asia-Pacific | |
| North America | United States |
| Canada | |
| Mexico | |
| Europe | Germany |
| United Kingdom | |
| France | |
| Italy | |
| Spain | |
| Russia | |
| NORDIC Countries | |
| Rest of Europe | |
| South America | Brazil |
| Argentina | |
| Rest of South America | |
| Middle East and Africa | United Arab Emirates |
| Saudi Arabia | |
| South Africa | |
| Rest of Middle East and Africa |
| By Production Process | Biomass-based Methanol | |
| Green H₂ + CO₂ (Power-to-X) | ||
| Municipal Waste-to-Methanol | ||
| Captured-CO₂ + Grid Renewables | ||
| Other Renewable Pathways | ||
| By Feedstock Source | Biogenic CO₂ | |
| Industrial captured CO₂ | ||
| Agricultural residue biomass | ||
| Forestry residue biomass | ||
| Municipal solid waste | ||
| Renewable electricity (Power-to-X) | ||
| By Application | Marine and Shipping Fuel | |
| Chemicals and Derivatives | ||
| Energy Carrier – Power and Heat | ||
| Transportation Fuel | ||
| Energy Storage / H₂ Carrier | ||
| Other Applications | ||
| By End-User Industry | Marine and Logistics | |
| Chemical and Petrochemical Producers | ||
| Renewable Energy Utilities / IPPs | ||
| Transport and Mobility Fleets | ||
| Industrial and Power Users | ||
| Government and Defence Agencies | ||
| By Geography | Asia-pacific | China |
| India | ||
| Japan | ||
| South Korea | ||
| Australia and New Zealand | ||
| ASEAN Countries | ||
| Rest of Asia-Pacific | ||
| North America | United States | |
| Canada | ||
| Mexico | ||
| Europe | Germany | |
| United Kingdom | ||
| France | ||
| Italy | ||
| Spain | ||
| Russia | ||
| NORDIC Countries | ||
| Rest of Europe | ||
| South America | Brazil | |
| Argentina | ||
| Rest of South America | ||
| Middle East and Africa | United Arab Emirates | |
| Saudi Arabia | ||
| South Africa | ||
| Rest of Middle East and Africa | ||


Key Questions Answered in the Report
What is the forecast value of renewable methanol in 2031?
The renewable methanol market is projected to reach USD 6.24 billion by 2031, reflecting robust growth momentum.
Which region leads renewable methanol capacity today?
Asia-Pacific holds the largest share at 44.85%, driven by China’s industrial policy support and large-scale integrated projects.
Which application is growing fastest?
Marine fuel use is expanding at a 42.11% CAGR as shipping companies comply with stricter decarbonization mandates.
Why is renewable methanol still more expensive than fossil methanol?
Renewable hydrogen costs dominate production economics, keeping current prices two to three times higher than conventional methanol.
Page last updated on:


