West Europe Renewable Energy Market Size and Share
Market Overview
| Study Period | 2021 - 2031 |
|---|---|
| Forecast Data Period | 2026 - 2031 |
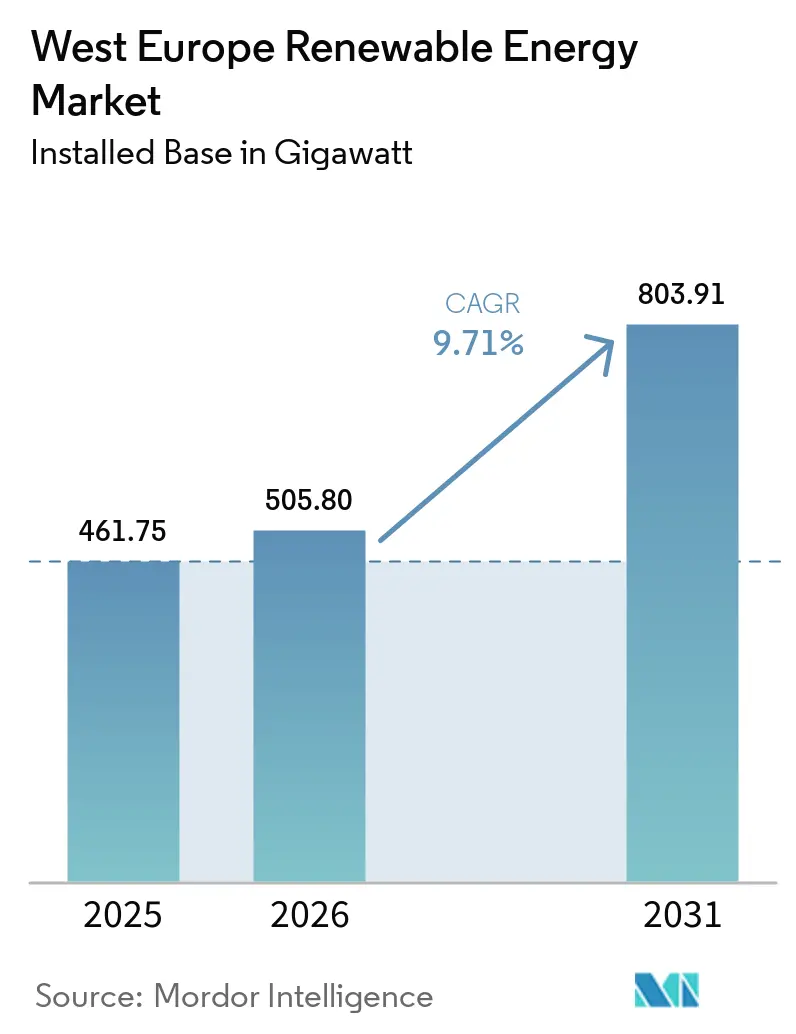
| Base Year Market Size (2025) | 461.75 gigawatt |
| Market Volume (2026) | 505.80 gigawatt |
| Market Volume (2031) | 803.91 gigawatt |
| Growth Rate (2026 - 2031) | 9.71% CAGR |
| Market Concentration | Low |
Major Players *Disclaimer: Major Players sorted in no particular order Image © Mordor Intelligence. Reuse requires attribution under CC BY 4.0. | |
West Europe Renewable Energy Market Analysis by Mordor Intelligence
The West Europe Renewable Energy Market size in terms of installed base is expected to increase from 461.75 gigawatt in 2025 to 505.80 gigawatt in 2026 and reach 803.91 gigawatt by 2031, growing at a CAGR of 9.71% over 2026-2031. Momentum stems from subsidy-free corporate procurement, battery-ready grid-code reforms, and hydrogen-linked offtake contracts that monetize curtailed wind output. Falling levelized costs for solar and wind continue to narrow the gap with gas-fired generation, even as rare-earth price swings compress turbine-OEM margins. Yet the deployment trajectory still trails the European Commission’s binding 42.5% renewable-electricity share for 2030, highlighting the importance of accelerated permitting in “renewables-go-to” zones. Parallel growth in behind-the-meter solar and 24/7 carbon-free corporate PPAs signals a structural pivot away from purely utility-scale build-outs toward distributed assets that sidestep transmission bottlenecks.
Key Report Takeaways
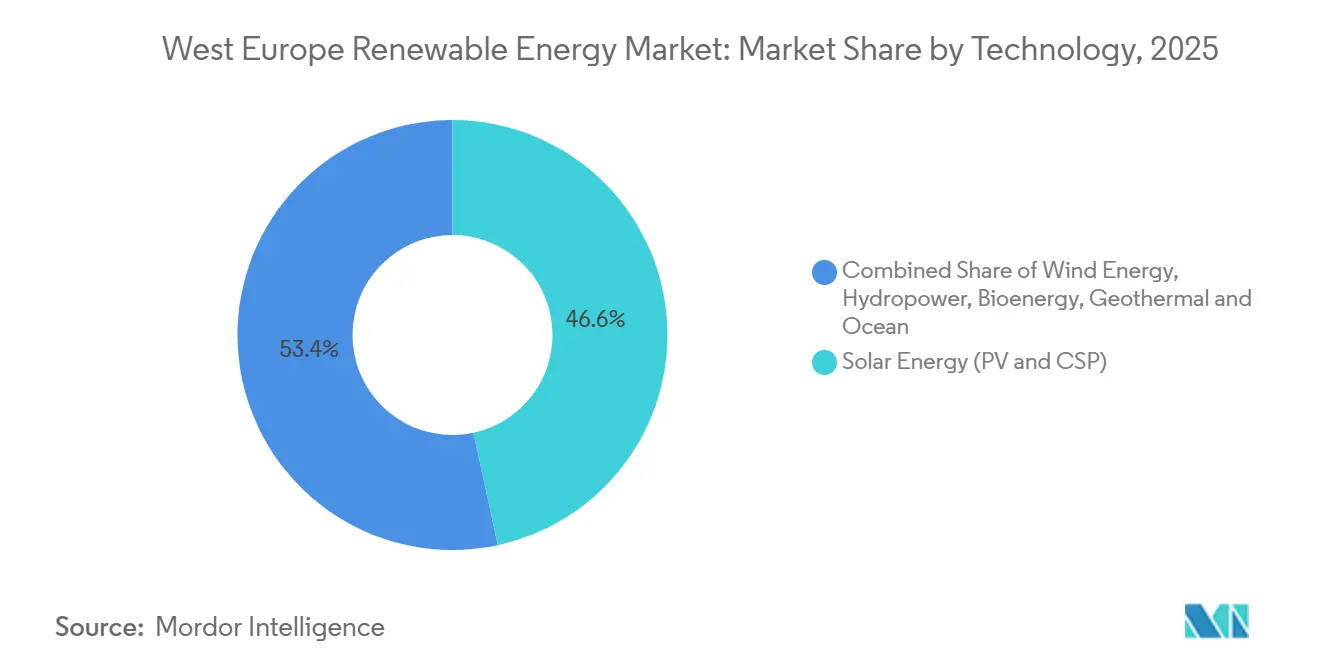
- By technology, solar energy led with 46.63% of the West Europe renewable energy market share in 2025, while ocean energy is projected to advance at a 17.45% CAGR through 2031.
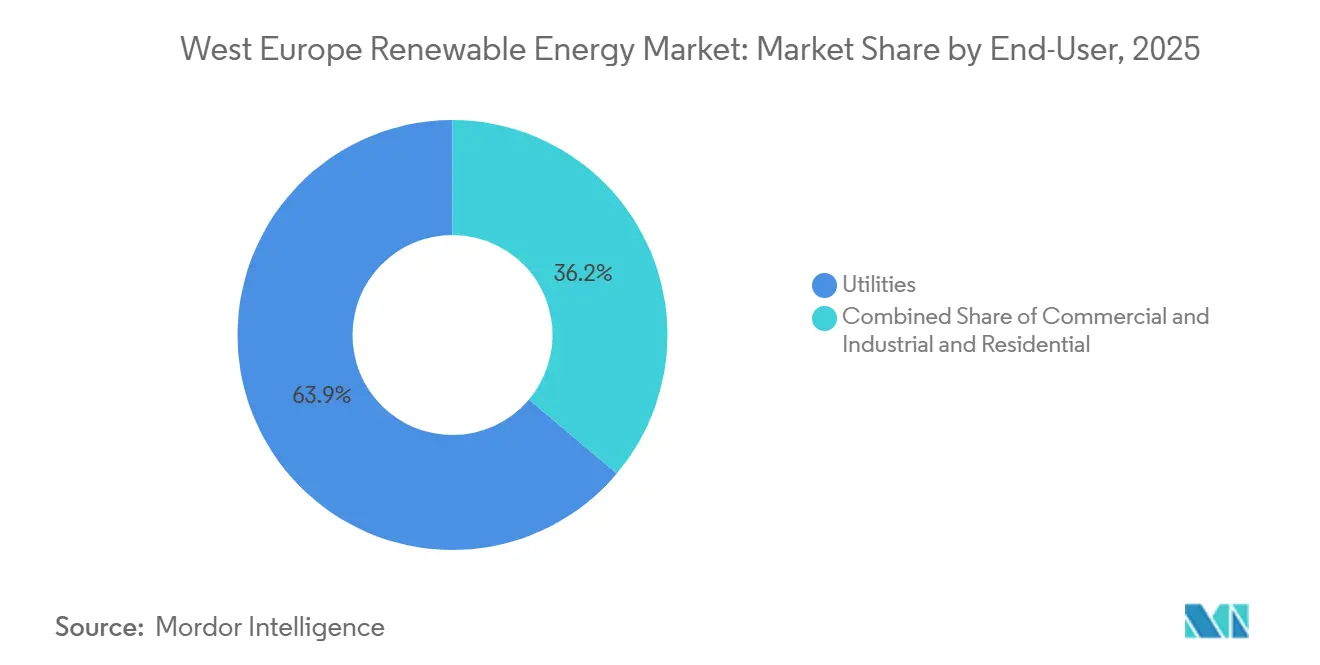
- By end-user, utilities accounted for 63.85% of the West Europe renewable energy market size in 2025, yet commercial-and-industrial installations are set to climb at a 15.13% CAGR to 2031.
- By geography, Germany held 47.34% of installed capacity in 2025, whereas Ireland is forecast to expand at a 15.50% CAGR to 2031.
Note: Market size and forecast figures in this report are generated using Mordor Intelligence’s proprietary estimation framework, updated with the latest available data and insights as of January 2026.
West Europe Renewable Energy Market Trends and Insights
Drivers Impact Analysis*
| Driver | (~) % Impact on CAGR Forecast | Geographic Relevance | Impact Timeline |
|---|---|---|---|
| EU Green Deal & 2030 Targets | + 2.1% | EU-wide, strongest in Germany, Netherlands, Ireland | Long term (≥ 4 years) |
| Rapid LCOE Decline for Wind & Solar | + 1.8% | Global, pronounced in UK, Germany, Spain | Medium term (2-4 years) |
| Corporate PPAs Surge | + 1.5% | Germany, Spain, UK, France | Medium term (2-4 years) |
| Battery-ready Co-location Mandates (2025 reform) | + 1.3% | EU-wide, early adoption in Germany, Netherlands | Short term (≤ 2 years) |
| Hydrogen-linked Renewable Projects | + 1.2% | Spain, Netherlands, Germany, France | Long term (≥ 4 years) |
| Indexed CfD-style Auctions | + 0.9% | UK, Ireland, France | Medium term (2-4 years) |
| Source: Mordor Intelligence | |||
EU Green Deal & 2030 Targets
The European Commission requires every member state to meet a 42.5% renewable-electricity share by 2030, with an aspirational 45% ceiling under REPowerEU. Germany’s updated climate act mandates 80% renewable power by 2030, demanding a further 115 GW of solar and 30 GW of offshore wind beyond 2025 baselines. Ireland’s 900 MW ORESS Tonn Nua award in December 2025 set a benchmark price of EUR 98.719/MWh, underpinning a 15.50% geographic CAGR. Sectoral sub-targets for renewable heat and transport intensify indirect electricity demand, while “renewables-go-to” areas promise to cut permitting lead-times from nine years to fewer than two. Developers that have already secured land in these zones gain a first-mover cost advantage.
Rapid LCOE Decline for Wind & Solar
Europe’s average renewable LCOE fell 7% in 2025, with offshore wind in the North Sea dipping to EUR 50-60/MWh for 2026-bound projects [1]WindEurope, “North Sea Cost Trends,” windeurope.org. At EUR 80/tonne, emission-allowance costs add EUR 40-50/MWh to gas-plant dispatch, pivoting competitiveness toward renewables. However, U.K. Allocation Round 7 strike prices near GBP 73/MWh still left 75 of 82 pipeline projects without final investment decisions as of early 2026 [2]Energy & Climate Intelligence Unit, “Offshore Wind Pipeline Tracker,” eciu.net. Corporate buyers increasingly prize revenue stability over absolute cost, as demonstrated by German on-site solar PPAs averaging 19-year terms seven years longer than off-site deals. The pattern reveals margin compression despite falling hardware costs, meaning grid access and price hedging now trump pure LCOE benchmarks.
Corporate PPAs Surge
Europe signed 12.6 GW of corporate renewable PPAs in 2024, led by Spain at 3.1 GW and the U.K. at 1.4 GW, as firms scrambled to hedge wholesale-price volatility. On-site agreements averaged 20.3 MW and 19-year tenors in 2025, seven years longer than typical off-site contracts, reflecting buyer demand for physical additionality and fixed energy costs. Germany logged 159 MW of such deals, including Mercedes-Benz’s 140 MW wind PPA, while France’s Bpifrance guarantee program covered 80% of counterparty risk and lifted annual contracted volume by 50%. Data-center operators consumed 7.6 TWh in 2024 and now insist on 24/7 carbon-free matching, expanding PPA structures beyond annual certificates. Because behind-the-meter solar avoids network charges of EUR 30-50/MWh in Germany and France, corporate demand expands faster than utility procurement. This trend is expected to add 1.5 percentage points to the regional CAGR.
Battery-ready Co-location Mandates (2025 reform)
Article 15e of the revised Renewable Energy Directive took effect in May 2025, requiring projects in designated congestion zones to integrate storage or demand-response assets to qualify for priority dispatch. Germany’s regulator now mandates that solar parks above 10 MW install batteries equal to at least 10% of daily generation capacity, adding EUR 50-70/kW to CAPEX but slashing curtailment risk. The Netherlands complements the rule with smart-charging mandates that turn EVs into a distributed storage fleet. TotalEnergies’ April 2025 commitment of EUR 160 million for 221 MW of German batteries illustrates how developers pre-empt regulatory deadlines to secure scarce grid slots. Merchant generators can now capture intraday spreads of EUR 20-40/MWh between midday and evening peaks, boosting project financeability. The mandate therefore lifts overall market growth by about 1.3 percentage points.
Restraints Impact Analysis*
| Restraint | (~) % Impact on CAGR Forecast | Geographic Relevance | Impact Timeline |
|---|---|---|---|
| Grid Congestion & Interconnection Bottlenecks | -1.4% | Germany, UK, Netherlands, Belgium | Short term (≤ 2 years) |
| Lengthy Permitting Procedures | -1.1% | Germany, France, Italy | Medium term (2-4 years) |
| Rare-earth & Installation Vessel Shortages | -0.9% | Global, acute in offshore wind (UK, Germany) | Medium term (2-4 years) |
| Farmland-use Opposition to Utility Solar | -0.7% | Ireland, Italy, Spain, Germany | Long term (≥ 4 years) |
| Source: Mordor Intelligence | |||
Grid Congestion & Interconnection Bottlenecks
Europe’s transmission redispatch costs reached EUR 4.3 billion in 2024 after 60 TWh of renewable output was curtailed or rerouted, while cross-border interconnector utilization stalled at 54 % against the 70 % target set by regulators. Germany’s north–south corridor already curtails up to 8 TWh a year because offshore wind in Schleswig-Holstein overwhelms grid capacity to Bavarian demand centers [3]Bundesnetzagentur, “Grid Curtailment Statistics 2025,” bundesnetzagentur.de. In the U.K., only 7 of 82 offshore-wind projects reached final investment decision by early 2026, exposing a 12.4 GW gap to the 55 GW 2030 goal because port and grid upgrades require 6–10 years longer than most financing windows. The Netherlands’ TenneT delayed new North Sea connections until 2029 owing to onshore substation constraints, effectively capping annual additions at 1.5 GW versus the 3 GW pace needed to hit national targets. These bottlenecks elevate the strategic value of behind-the-meter solar and distributed batteries that bypass transmission queues altogether. Unless large-scale grid modernization accelerates, interconnection caps will continue to shave roughly 1.4 percentage points from forecast CAGR.
Lengthy Permitting Procedures
Utility-scale renewables still face approval lead-times of 3–9 years in Germany and France despite a 2024 European Commission recommendation to compress them to 2 years in “go-to” zones. Sequential environmental reviews, local consultations, and grid-impact studies stretch project timelines and inflate holding costs. France processed only 24 % of solar applications within statutory deadlines in 2025, while Italy’s average wind-farm timeline exceeded 6 years, deterring smaller developers that lack extensive balance sheets. Germany’s federal-state split further complicates approvals as Länder impose divergent wildlife-protection rules that can add an extra 18 months to onshore-wind dossiers. Financing costs climb while developers await permits, eroding internal rates of return and steering capital toward faster-moving U.S. and Asia-Pacific markets. The aggregate drag trims an estimated 1.1 percentage points from regional CAGR.
*Our forecasts treat driver/restraint impacts as directional, not additive. The impact forecasts reflect baseline growth, mix effects, and variable interactions.
Segment Analysis
By Technology: Ocean Energy Pilots Accelerate Commercial Transition
Ocean energy held a modest baseline yet is forecast to grow at 17.45% CAGR, the fastest rate among technologies in the West Europe renewable energy market [4]Orbital Marine Power, “Morlais HydroWing Project,” orbitalmarine.com. The segment benefits from the 30 MW HydroWing tidal array at Morlais and France’s 250 MW pipeline moving from prototype toward multi-turbine arrays. Solar retained 46.63% of installed capacity in 2025 as sub-EUR 30/MWh LCOE kept project pipelines full, although land limits and curtailment headwinds slow incremental utility-scale builds. Wind power, bolstered by 15 MW turbines and floating foundations, remains the foundational bulk-capacity provider. Hydropower and bioenergy supply dispatchable stability, while CSP’s share stays negligible owing to Europe’s moderate direct normal irradiance.
Ocean assets also enable predictable diurnal output that eases evening ramps, helping transmission operators cut system costs by GBP 1.46 billion annually at 10 GW deployment. Vendor financing has shifted toward project-backed bonds once grid-support benefits are monetized under updated capacity-market rules. The confluence of tidal predictability, wave resource scale, and updated remuneration frameworks explains the accelerating contribution of ocean technologies to the West Europe renewable energy market size. Parallel pumped-storage hybrids, such as Iberdrola’s 274 MW wind-plus-Tâmega scheme, showcase how dispatchable renewables are expanding without adding new gas peakers.


By End-User: Corporate Procurement Reshapes Demand Patterns
Utilities retained 63.85% of installed capacity in 2025, leveraging deep balance sheets and in-house EPC capability. Yet commercial-and-industrial facilities are projected to outpace the wider West Europe renewable energy market at 15.13% CAGR as rooftop solar and behind-the-meter batteries hedge retail-tariff volatility. Corporate PPAs totaling 12.6 GW were signed in 2024, with Spain contributing 3.1 GW and the U.K. 1.4 GW. On-site deals averaged 20.3 MW per contract and locked in 19-year tenors, reflecting buyer appetite for physical additionality and tariff avoidance. Data centers, which consumed 7.6 TWh in 2024 and could require up to 41 TWh by 2035, emerged as anchor off-takers demanding 24/7 carbon-free matching.
Third-party “energy-as-a-service” models now finance rooftop systems, shifting CAPEX off corporate ledgers and accelerating distributed deployment. Germany’s competitive network-charge exemptions (EUR 30-50/MWh) make behind-the-meter solar economically irresistible for manufacturers seeking Scope 2 emissions abatement. Together, these forces underpin the fastest-growing share within the West Europe renewable energy market size, affirming that localized generation now rivals utility-scale procurement in strategic importance.
Geography Analysis
Germany dominated with 47.34% of installed capacity in 2025, but its growth will trail regional averages as land-use caps limit new solar acreage. The country’s north-south transmission corridor curtails up to 8 TWh of offshore wind annually, underscoring why co-located batteries are becoming obligatory under 2025 grid-code reforms. Developers such as TotalEnergies have already earmarked EUR 160 million for 221 MW of German storage to pre-qualify new permits. Commercial rooftop solar is therefore expanding faster than ground-mount projects, aligning with municipal food-security rules that restrict utility-scale sites to 0.1% of arable land.
Ireland will lead regional expansion at a 15.50% CAGR, propelled by 5 GW of offshore wind due by 2030 and 20 GW by 2040. The December 2025 ORESS Tonn Nua cleared 900 MW at EUR 98.719/MWh, signaling bankable pricing despite supply-chain inflation. Cross-border interconnector plans with France and the U.K. further elevate export potential, even as domestic grid codes encourage hybrid onshore-plus-storage schemes to protect rural viewsheds.
The United Kingdom’s 96.4 GW offshore-wind pipeline now faces a 12.4 GW execution gap to its 55 GW 2030 milestone because only seven projects reached FID by early 2026. France balances nuclear baseload with a reduced 4.5 GW electrolyzer goal for 2030, distributing curtailed solar into hydrogen valleys. The Netherlands and Belgium continue to expand North Sea arrays, but TenneT has capped new connections at 1.5 GW per year until new onshore substations arrive in 2029. Southern markets Spain, Italy, and Portugal drive hydrogen pilots and agrivoltaics, though farmland litigation slows grid-scale solar in the Po Valley. Together these dynamics shape heterogenous but converging growth arcs within the West Europe renewable energy market.
Competitive Landscape
West Europe Renewable Energy Market is fragmented. Turbine OEMs struggle with rare-earth volatility neodymium settled near USD 96/kg in 2025 after peaking at USD 222/kg. Only five European installation vessels can handle 15-MW turbines, a bottleneck that inflates offshore wind CAPEX. Developer consolidation accelerated: TotalEnergies bought VSB’s 15 GW pipeline for EUR 1.57 billion, Iberdrola committed GBP 12 billion to U.K. renewables, and RWE partnered with KKR and Masdar on 6.9 GW of Allocation Round 7 projects. These joint ventures pool capital while mitigating grid-connection delays.
White-space innovation centers on agrivoltaics and pumped-storage hybrids. Iberdrola’s EUR 175 million Tâmega integration illustrates how wind-plus-storage offsets curtailment while qualifying for EU resilience finance. Ocean-energy specialist Orbital Marine Power advanced the 30 MW HydroWing, marking a shift toward bankable tidal arrays. Energy-as-a-service financiers, often backed by infrastructure funds, are bundling rooftop solar, batteries, and EV charging into 20-year service agreements, eroding utilities’ traditional customer lock-in.
RWE’s 2025 filing showed offshore-wind EBITDA margins falling from 42% to 38% due to vessel-charter and steel-price inflation, prompting a pivot toward faster-cycling onshore projects. The top five developers now control roughly 62% of commissioned or FID-level capacity, pointing to moderate concentration in the West Europe renewable energy market.
West Europe Renewable Energy Industry Leaders
Iberdrola SA
Ørsted A/S
EDF Renewables
Engie SA
RWE Renewables
- *Disclaimer: Major Players sorted in no particular order

Recent Industry Developments
- April 2026: Orrön Energy sold a 91 MW agri-solar project in Germany for up to EUR 5.6 million.
- March 2026: bp–Iberdrola Castellón project began testing, featuring a 25 MW electrolyzer integrated with 200 GWh/year of renewable power.
- January 2026: Danish Energy Agency granted a 30-year electricity production license to RWE's 1100 MW Thor offshore wind farm. The project is anticipated to supply renewable electricity to approximately one million Danish households when fully operational in 2027, according to the developer.
- November 2025: Ireland awarded 900 MW of offshore wind capacity at EUR 98.719/MWh under the ORESS Tonn Nua program.


West Europe Renewable Energy Market Report Scope
Renewable energy refers to energy produced from natural sources that are replenished continuously on a human timescale, ensuring they do not deplete like fossil fuels. These sources include sunlight, wind, water, geothermal heat, and organic materials. Common types of renewable energy include solar power, wind power, hydropower, geothermal energy, and biomass energy. Unlike coal, oil, or natural gas, renewable energy generates minimal to no greenhouse gas emissions, making it a critical solution for mitigating climate change and supporting sustainable development. In essence, renewable energy is a clean and sustainable power source derived from nature, capable of being utilized repeatedly without exhausting the resource.
The West Europe renewable energy market is segmented by technology, end-user, and geography. By technology, the market is segmented into solar energy, wind energy, hydropower, bioenergy, geothermal, and ocean energy. By end-user, the market is segmented into utilities, commercial and industrial, and residential sectors. By geography, the market is segmented into Germany, the United Kingdom, France, Ireland, the Netherlands, Belgium, Luxembourg, and the rest of Western Europe. The report also covers the market size and forecasts for the West Europe renewable energy market across these key countries. For each segment, market sizing and forecasts have been provided on the basis of installed capacity (GW).
| Solar Energy (PV and CSP) |
| Wind Energy (Onshore and Offshore) |
| Hydropower (Small, Large, PSH) |
| Bioenergy |
| Geothermal |
| Ocean Energy (Tidal and Wave) |
| Utilities |
| Commercial and Industrial |
| Residential |
| Germany |
| United Kingdom |
| France |
| Ireland |
| Netherlands |
| Belgium |
| Luxembourg |
| Rest of West Europe |
| By Technology | Solar Energy (PV and CSP) |
| Wind Energy (Onshore and Offshore) | |
| Hydropower (Small, Large, PSH) | |
| Bioenergy | |
| Geothermal | |
| Ocean Energy (Tidal and Wave) | |
| By End-User | Utilities |
| Commercial and Industrial | |
| Residential | |
| By Geography | Germany |
| United Kingdom | |
| France | |
| Ireland | |
| Netherlands | |
| Belgium | |
| Luxembourg | |
| Rest of West Europe |


Key Questions Answered in the Report
How large is the West Europe renewable energy market in capacity terms?
The West Europe Renewable Energy Market size in terms of installed base is expected to increase from 461.75 gigawatt in 2025 to 505.80 gigawatt in 2026 and reach 803.91 gigawatt by 2031, growing at a CAGR of 9.71% over 2026-2031.
Which country adds capacity fastest toward 2031?
Ireland leads with a projected 15.50% CAGR, driven by its 5 GW offshore-wind target for 2030 and supportive auction pricing.
Which technology expands quickest to 2031?
Ocean energy tidal and wave grows at 17.45% CAGR as projects shift from pilot to commercial scale.
Why are corporate PPAs pivotal in Western Europe?
They lock in long-term price certainty, bypass grid fees, and enable firms to meet Scope 2 targets, fueling a 15.13% CAGR in C&I installations.
What is the main bottleneck facing new utility-scale projects?
Grid-connection congestion and multi-year permitting queues remain the largest drag, trimming forecast CAGR by an estimated 1.4%.
Page last updated on:


