
United States Smart Homes Market Size and Share
Market Overview
| Study Period | 2020 - 2031 |
|---|---|
| Forecast Data Period | 2026 - 2031 |
| Base Year Market Size (2025) | USD 50.30 Billion |
| Market Size (2026) | USD 54.53 Billion |
| Market Size (2031) | USD 81.61 Billion |
| Growth Rate (2026 - 2031) | 8.40% CAGR |
| Market Concentration | Medium |
Major Players *Disclaimer: Major Players sorted in no particular order Image © Mordor Intelligence. Reuse requires attribution under CC BY 4.0. | |
United States Smart Homes Market Analysis by Mordor Intelligence
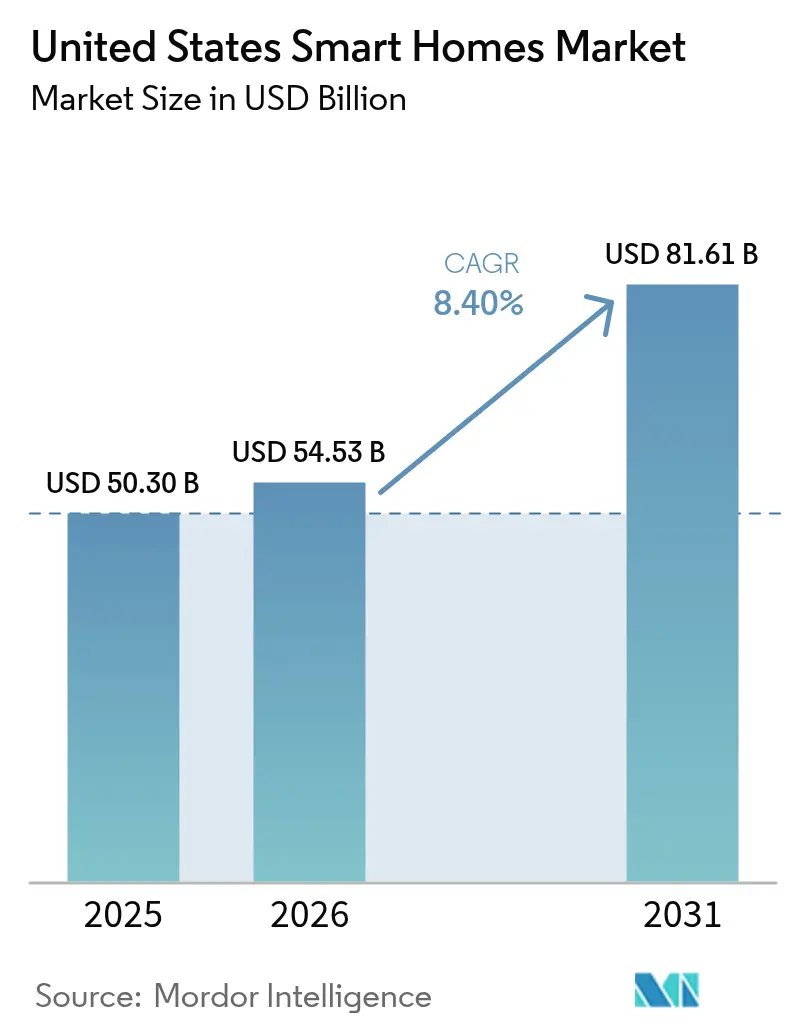
The United States Smart Homes Market size in 2026 is estimated at USD 54.53 billion, growing from 2025 value of USD 50.30 billion with 2031 projections showing USD 81.61 billion, growing at 8.4% CAGR over 2026-2031.
Growth is fueled by a confluence of federally funded energy-efficiency rebates, the rapid institutionalization of the Matter interoperability protocol, and demographic momentum toward aging-in-place solutions. Federal support—most visibly the FCC’s new Cyber Trust Mark and the Department of Energy’s Home Energy Rebates—has elevated consumer confidence in device security while directly lowering acquisition costs. Connectivity breakthroughs, such as Thread 1.4’s unified mesh networking, are dissolving long-standing adoption barriers by allowing border routers from multiple brands to join existing networks seamlessly. At the same time, insurance carriers are pairing premium reductions with verified security installations, creating a clear economic incentive for first-time adopters. Platform vendors are responding with aggressive portfolio realignments; Amazon’s subscription-based Alexa+ model and Apple’s delayed but expanded HomeOS roadmap show that ecosystem control now matters more than single-device margins.
Key Report Takeaways
- By product type, security captured 29.30% of the United States smart homes market share in 2025; smart appliances are projected to grow at a 14.25% CAGR through 2031.
- By connectivity, Wi-Fi devices held 60.35% share of the United States smart homes market size in 2025, while Thread-enabled products are set to expand at an 18.1% CAGR to 2031.
- By installation, DIY deployments controlled 67.35% of the United States smart homes market in 2025, but professionally installed systems are advancing at a 10.05% CAGR to 2031.
- By sales channel, online retail accounted for 52.60% of revenue in 2025; telecom-utility bundles are forecast to post a 12.8% CAGR through 2031.
- By component, hardware represented 76.30% of 2025 revenue, whereas subscription and monitoring services will climb at an 10.95% CAGR over the forecast.
- Amazon, Google, Apple, Honeywell, and Schneider Electric collectively commanded roughly 45% of 2024 revenue.
Note: Market size and forecast figures in this report are generated using Mordor Intelligence’s proprietary estimation framework, updated with the latest available data and insights as of 2026.
United States Smart Homes Market Trends and Insights
Drivers Impact Analysis*
| Driver | (~) % Impact on CAGR Forecast | Geographic Relevance | Impact Timeline |
|---|---|---|---|
| Utility-backed energy-efficiency incentives | +2.1% | Nationwide; strongest in CA, NY, HI, NM | Medium term (2-4 years) |
| Rapid Matter-based multi-brand bundles | +1.8% | Global; peak effect in North America | Short term (≤ 2 years) |
| Aging-in-place retrofit demand | +1.4% | Nationwide; suburban and rural concentrations | Long term (≥ 4 years) |
| Insurance discounts for smart security | +0.9% | Nationwide; pilots in six states | Medium term (2-4 years) |
| Source: Mordor Intelligence | |||
Utility-backed Energy-Efficiency Rebates and Dynamic-Pricing Programs
The Department of Energy’s USD 8.8 billion Home Energy Rebates program—already live in California, Hawaii, New Mexico, and New York—has placed unprecedented purchasing power directly in homeowners’ hands.[1]U.S. Department of Energy, “Home Energy Rebate Programs,” energy.govNew York’s May 2024 roll-out set the tone for states eager to capture federal dollars for smart thermostats, heat pumps, and connected water heaters. Southern California Edison now offers USD 75 bill credits for enrolling certified thermostats in demand-response schemes, while PSEG Long Island earmarked USD 92.45 million for 2025 efficiency measures focused on connected devices. [2]New York State Public Service Commission, “PSEG Long Island 2025 Energy Efficiency Plan,” dps.ny.govWisconsin’s USD 149 million allocation under its Focus on Energy program shows that even colder climates are leaning heavily on connected equipment to curb peak loads. Utilities then recycle the savings they achieve on peak-generation costs into broader rebate pools, thereby creating a virtuous adoption cycle.
Rapid Adoption of Matter Protocol Driving Multi-brand Device Bundles
Matter’s 1.4 specification, published in November 2024, was the watershed moment when unified multi-admin control, expanded device classes, and native Thread mesh support converged. Over 670 Thread-based products had cleared certification by mid-2025, and major retailers pledged dedicated shelf space to Matter-ready gear. [3]CNBC, “Retailers double down on Matter smart home standard,” cnbc.com Apple reversed course, shifting from HomeKit exclusivity to full Matter compliance, a move that signaled ecosystem consensus. Self-healing Thread networks now allow devices from different brands to join without re-commissioning, erasing historical complexities that drove high return rates. Version 1.5, expected in late 2025, will embed grid-interactive energy APIs, positioning residences as dispatchable demand-response nodes rather than passive loads.
Aging-in-Place and “Age-Tech” Demand Accelerating Retrofit Spending
Four in five seniors possess at least one connected device to support independent living, according to AARP’s 2025 survey. California’s Lead Locally pilot demonstrated an 11% yearly drop in household energy use once heat pumps and smart water heaters were combined with automation suite. Medicare Advantage plans are progressively reimbursing remote-patient-monitoring sensors that integrate directly with mainstream smart-home hubs, shrinking out-of-pocket costs for seniors. Voice-first interfaces, buoyed by sharp advances in natural-language models, remove the intimidation factor for older adults who once shunned technology. The result is a sizable retrofit wave reaching well beyond emergency pendants into whole-home environmental controls and predictive safety analytics.
Insurance Premium Discounts for Smart Security Installations
Liberty Mutual’s Smart Home Verified Discount launched across six states in 2024, offering rate cuts when customers share Nest device health data. Early claims data suggest double-digit declines in fire- and break-in-related payouts, encouraging expansion into additional states. Insurers have progressed from static discounts to dynamic risk-mitigation services: water-leak detectors that auto-shut valves, AI-enabled cameras that trigger pre-emptive intervention, and device telematics that auto-populate claims. Professional monitoring firms leverage these partnerships to justify monthly fees, while carriers gain continuous actuarial visibility into risk conditions inside the home.
Restraints Impact Analysis*
| Restraint | (~) % Impact on CAGR Forecast | Geographic Relevance | Impact Timeline |
|---|---|---|---|
| Persistent data-privacy & surveillance fears | -1.3% | National; acute in CA and Northeastern US | Long term (≥ 4 years) |
| High pro-install cost for legacy housing | -0.8% | National; older metro areas | Medium term (2-4 years) |
| Source: Mordor Intelligence | |||
Persistent Data-Privacy and Surveillance Concerns
Although the FCC unveiled the Cyber Trust Mark in 2025, labeling remains voluntary, leaving device makers free to adopt tiered approaches that consumers often find opaque. California’s Consumer Privacy Act requires explicit disclosure of data use, elevating public awareness about what smart cameras, speakers, and sensors collect. Voice-assistant defaults drew renewed scrutiny when Amazon introduced an opt-in voice data retention policy in March 2025, igniting social-media backlash. Professional-grade IP cameras remain outside the FCC label’s scope, perpetuating concerns among security-sensitive households. Family dynamics further complicate matters: younger residents may welcome automation, while older or privacy-conscious members view 24-hour monitoring as intrusive.
High Professional-Installation Cost for Legacy Housing Stock
Many pre-1990 homes feature outdated wiring, thick masonry walls, and HVAC systems incompatible with modern automation kits. Whole-home retrofits often exceed USD 10,000 once electrical upgrades, structural adjustments, and pro labor are included, deterring mass uptake in older metro regions. Contractor shortages add scheduling delays and premium labor costs, especially in cities where renovation backlogs already stretch months. Thread and Wi-Fi do mitigate wiring needs, yet plaster, reinforced concrete, and metal conduits can attenuate signals, forcing homeowners to choose between expanded repeater nodes or costly rewiring to achieve blanket coverage.
*Our forecasts treat driver/restraint impacts as directional, not additive. The impact forecasts reflect baseline growth, mix effects, and variable interactions.
Segment Analysis
By Product Type: Security Dominance Meets Appliance Innovation
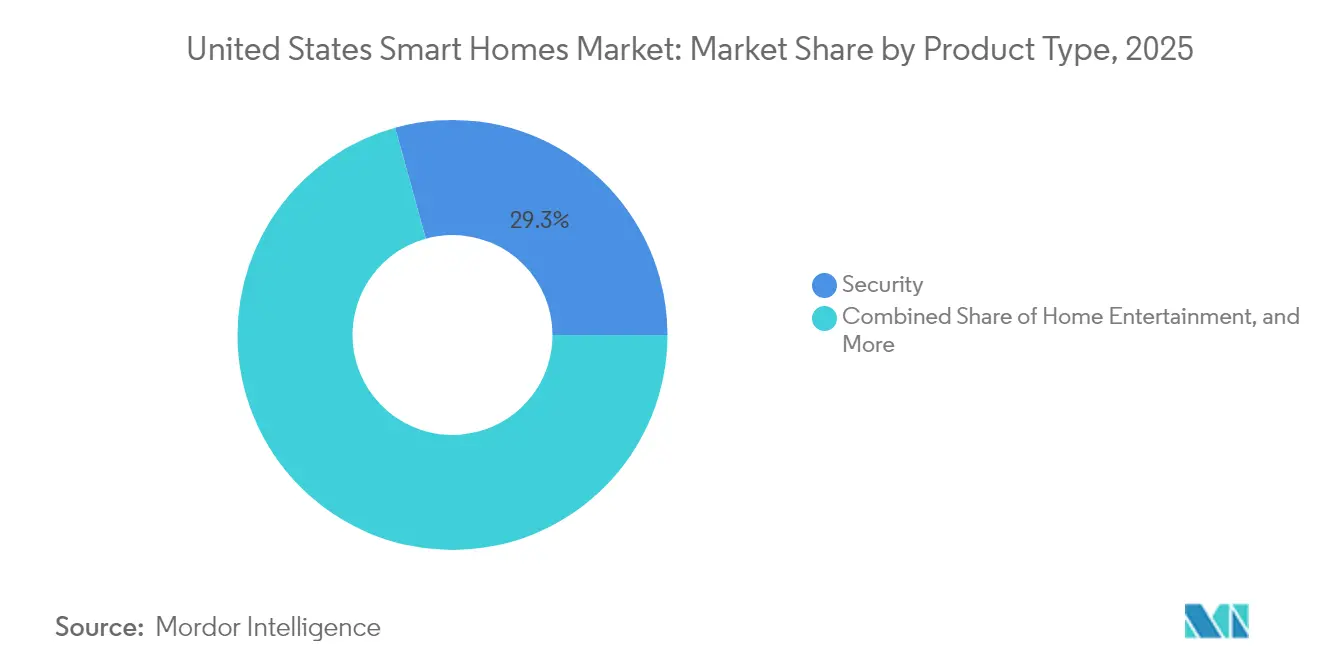
Security systems accounted for a 29.30% share of 2025 spending within the United States smart homes market, underlining consumers’ instinctive prioritization of personal safety and property protection. Early adoption often begins with cameras or video doorbells bundled into insurance discount programs, which then serve as launchpads for broader ecosystems. Smart appliances, however, are poised for the fastest lift, tracking a 14.25% CAGR on the strength of Matter-enabled cross-brand compatibility and escalating utility rebates on energy-star units. Energy-management packages—particularly smart thermostats linked to dynamic pricing schemes—continue benefiting from federal and state incentives. Home-entertainment devices, while maturing, still find incremental gains by acting as centralized automation dashboards on large-screen displays.
Consumer emphasis on unified control is closing the gap between historically siloed categories. Cameras now embed AI analytics that cooperate with lighting scenes, while refrigerators surface real-time dynamic-pricing prompts that mesh with energy-management routines. All told, hardware convergence reinforces the view that product labels will blur over the next five years as platform capabilities outpace single-function devices.



By Connectivity Technology: Thread Disrupts Wi-Fi Dominance
Wi-Fi controlled 60.35% of device shipments in 2025, buoyed by widespread router penetration and low incremental setup friction. Yet the Thread specification is on pace to carve out a substantial share, growing at an 18.1% CAGR to 2031. The latest 1.4 build delivers unified mesh capability, enabling multiple vendor border routers to form a single network without user intervention. Thread’s low-power, IPv6-based architecture allows sensors to sustain multi-year battery life even while participating in real-time communication loops essential for security and energy management.
The convergence between Thread and Wi-Fi is now complementary: high-bandwidth applications such as streaming cameras still rely on Wi-Fi, whereas low-bandwidth door sensors, leak detectors, and buttons migrate to Thread. Apple’s tvOS 26, Google’s Fuchsia-based Nest hubs, and Amazon’s Echo Hub firmware all ship with Thread border-router functionality, signaling mainstream endorsement. The Thread Group surpassed 670 certifications by June 2025, confirming that the ecosystem has passed a critical maturity threshold.
By Installation Type: DIY Preference Challenges Professional Integration
DIY kits captured 67.35% of 2025 revenue, as consumers gravitated toward plug-and-play devices requiring no drilling or code compliance. Retailers curate step-by-step app onboarding and bundle QR-coded quick-start cards to shorten install times. Nonetheless, the professionally installed segment is advancing at a 10.05% CAGR, largely in luxury builds, multifamily residences, and aging-in-place retrofits where code-driven electrical changes are unavoidable. Integrators differentiate by delivering whole-home scene programming, structured wiring, and warranty backing that outstrip the capacity of most end users.
The divide is not absolute. Amazon’s Echo Show 21 and forthcoming 15-inch variant illustrate a hybrid direction: an approachable touchscreen hub with optional pro commissioning for HVAC zoning, security panels, and unified voice control. The United States smart homes market is therefore likely to see sustained coexistence of DIY simplicity and pro-grade depth.
By Sales Channel: Online Retail Leads Telecom Bundle Growth
At 52.60% of 2025 turnover, online storefronts remain the buying venue of choice, primarily for self-install kits. Detailed listings, algorithmic recommendation engines, and extensive user reviews simplify compatibility checks. Telecom and utility bundles, growing at a 12.8% CAGR, are reshaping distribution economics. Verizon has extended 5G Home Internet coverage to 20 million households, coupling service contracts with starter kits that waive upfront hardware fees. AT&T’s 30 million-location fiber roadmap and T-Mobile’s fixed-wireless footprint likewise integrate smart-home hubs to anchor multi-service retention plays. Utilities add a further layer by embedding thermostat rebates directly into monthly billing cycles, shrinking payback periods for consumers.

By Component: Hardware Dominance Shifts Toward Services
Hardware still commands 76.30% of 2025 spending, reflecting the one-time capital nature of cameras, sensors, and hubs. Yet services—subscription monitoring, AI-driven automation tiers, and data analytics dashboards—are projected to rise 10.95% annually as vendors pivot from razor-thin device margins to recurring revenue. Amazon’s USD 19.99 Alexa+ plan provides predictive task automation, while Google’s forthcoming Home Assist will bundle generative AI scripts for cross-device orchestration. Apple’s HomeOS, delayed to spring 2026, prioritizes private-edge processing plus optional cloud upgrades. This monetization shift ensures that future platform viability rests less on unit sales and more on long-term engagement.
Geography Analysis
California continues to anchor the United States' smart homes market due to stringent energy-code mandates and instant rebates under the Golden State program, which offers USD 75 credits for demand-response thermostat enrollment. High electricity tariffs combined with progressive sustainability attitudes lead to above-average adoption of security, energy management, and appliance categories. New York, the first state approved for IRA-funded home energy rebates, has mobilized a dense network of local contractors to accelerate installations in aging housing stock. Retrofit complexity drives professional-install service growth in the Northeast, where brick and brownstone construction complicate wireless propagation and electrical upgrades.
Southern and Southwestern states, notably Texas, Florida, and Arizona, leverage high new-build rates to pre-wire dwellings, minimizing incremental smart-home costs. Heat-pump integration and solar PV coupling are especially popular where extreme temperatures or abundant sunlight raise the ROI on energy savings. The Mountain West—Colorado, Utah, and Idaho—combines technology-savvy demographics with utility incentive stacks targeting security and leak-detection devices that mitigate wildfire and freeze risks.
Rural America is entering a new adoption phase as 5G fixed-wireless access breaks broadband dead zones. The USD 42.5 billion BEAD fund earmarked for last-mile fiber augments this connectivity surge, making cloud-based smart-home platforms feasible in regions that historically lacked reliable backhaul. Utilities craft rural-specific programs, such as prepaid thermostats and remote water-shutoff incentives, acknowledging the longer service-truck rolls and limited contractor density typical of these communities.
Regulatory Landscape
In the United States, smart-home devices sit at the intersection of consumer IoT cybersecurity, RF equipment authorization, and privacy disclosure. The FCC's Cyber Trust Mark program, built on NIST cybersecurity criteria, provides a voluntary labeling pathway for consumer IoT security, and the FCC finalized the IoT cybersecurity labeling framework via Federal Register rulemaking in July 2024. This established the compliance structure used by participating brands and retailers.
Policy momentum around transparency has also increased. H.R. 859, the Informing Consumers about Smart Devices Act, passed the U.S. House of Representatives on April 29, 2025, and would require pre-purchase disclosure for internet-connected devices that include cameras or microphones. If enacted, it would directly affect packaging, online listings, and channel compliance workflows for major smart-home categories such as security cameras, video doorbells, and voice assistants. Separately, national-security scrutiny has expanded to home networking equipment, including consumer routers, reflected in the 2025 introduction of H.R. 866 (ROUTERS Act), which would require a Commerce-led study on national security risks in this segment.
Value Chain Analysis
The smart-homes value chain spans chipset and module suppliers, device OEMs (cameras, sensors, hubs, thermostats, appliances), software platforms and cloud services, and certification bodies that enable interoperability across brands. Standards organizations, particularly the Connectivity Standards Alliance (Matter) and The Thread Group ecosystem, act as gatekeepers for multi-vendor compatibility. With certified Matter and Thread device counts rising and retailers emphasizing cross-brand readiness, this interoperability has become a more visible purchase driver.
Downstream, distribution splits between online retail, telecom and utility bundles, and professional integrators for complex retrofits and premium installations. Recent ecosystem moves show tighter coupling between device makers, platform operators, and energy-service partners. Matter 1.6 (June 2026) added the Joint Fabric concept to support multi-ecosystem control on a single network, while Signify with Silicon Labs (June 2026) to enable concurrent Zigbee and Matter-over-Thread operation in Philips Hue products points to component and firmware capabilities being pulled forward to reduce returns and improve reliability. Energy-focused alliances, including Eaton with FranklinWH (June 2026), also connect panel-level hardware to home energy management and virtual power plant use cases, pushing the value chain beyond devices into grid services and recurring software-enabled functionality.
Competitive Landscape
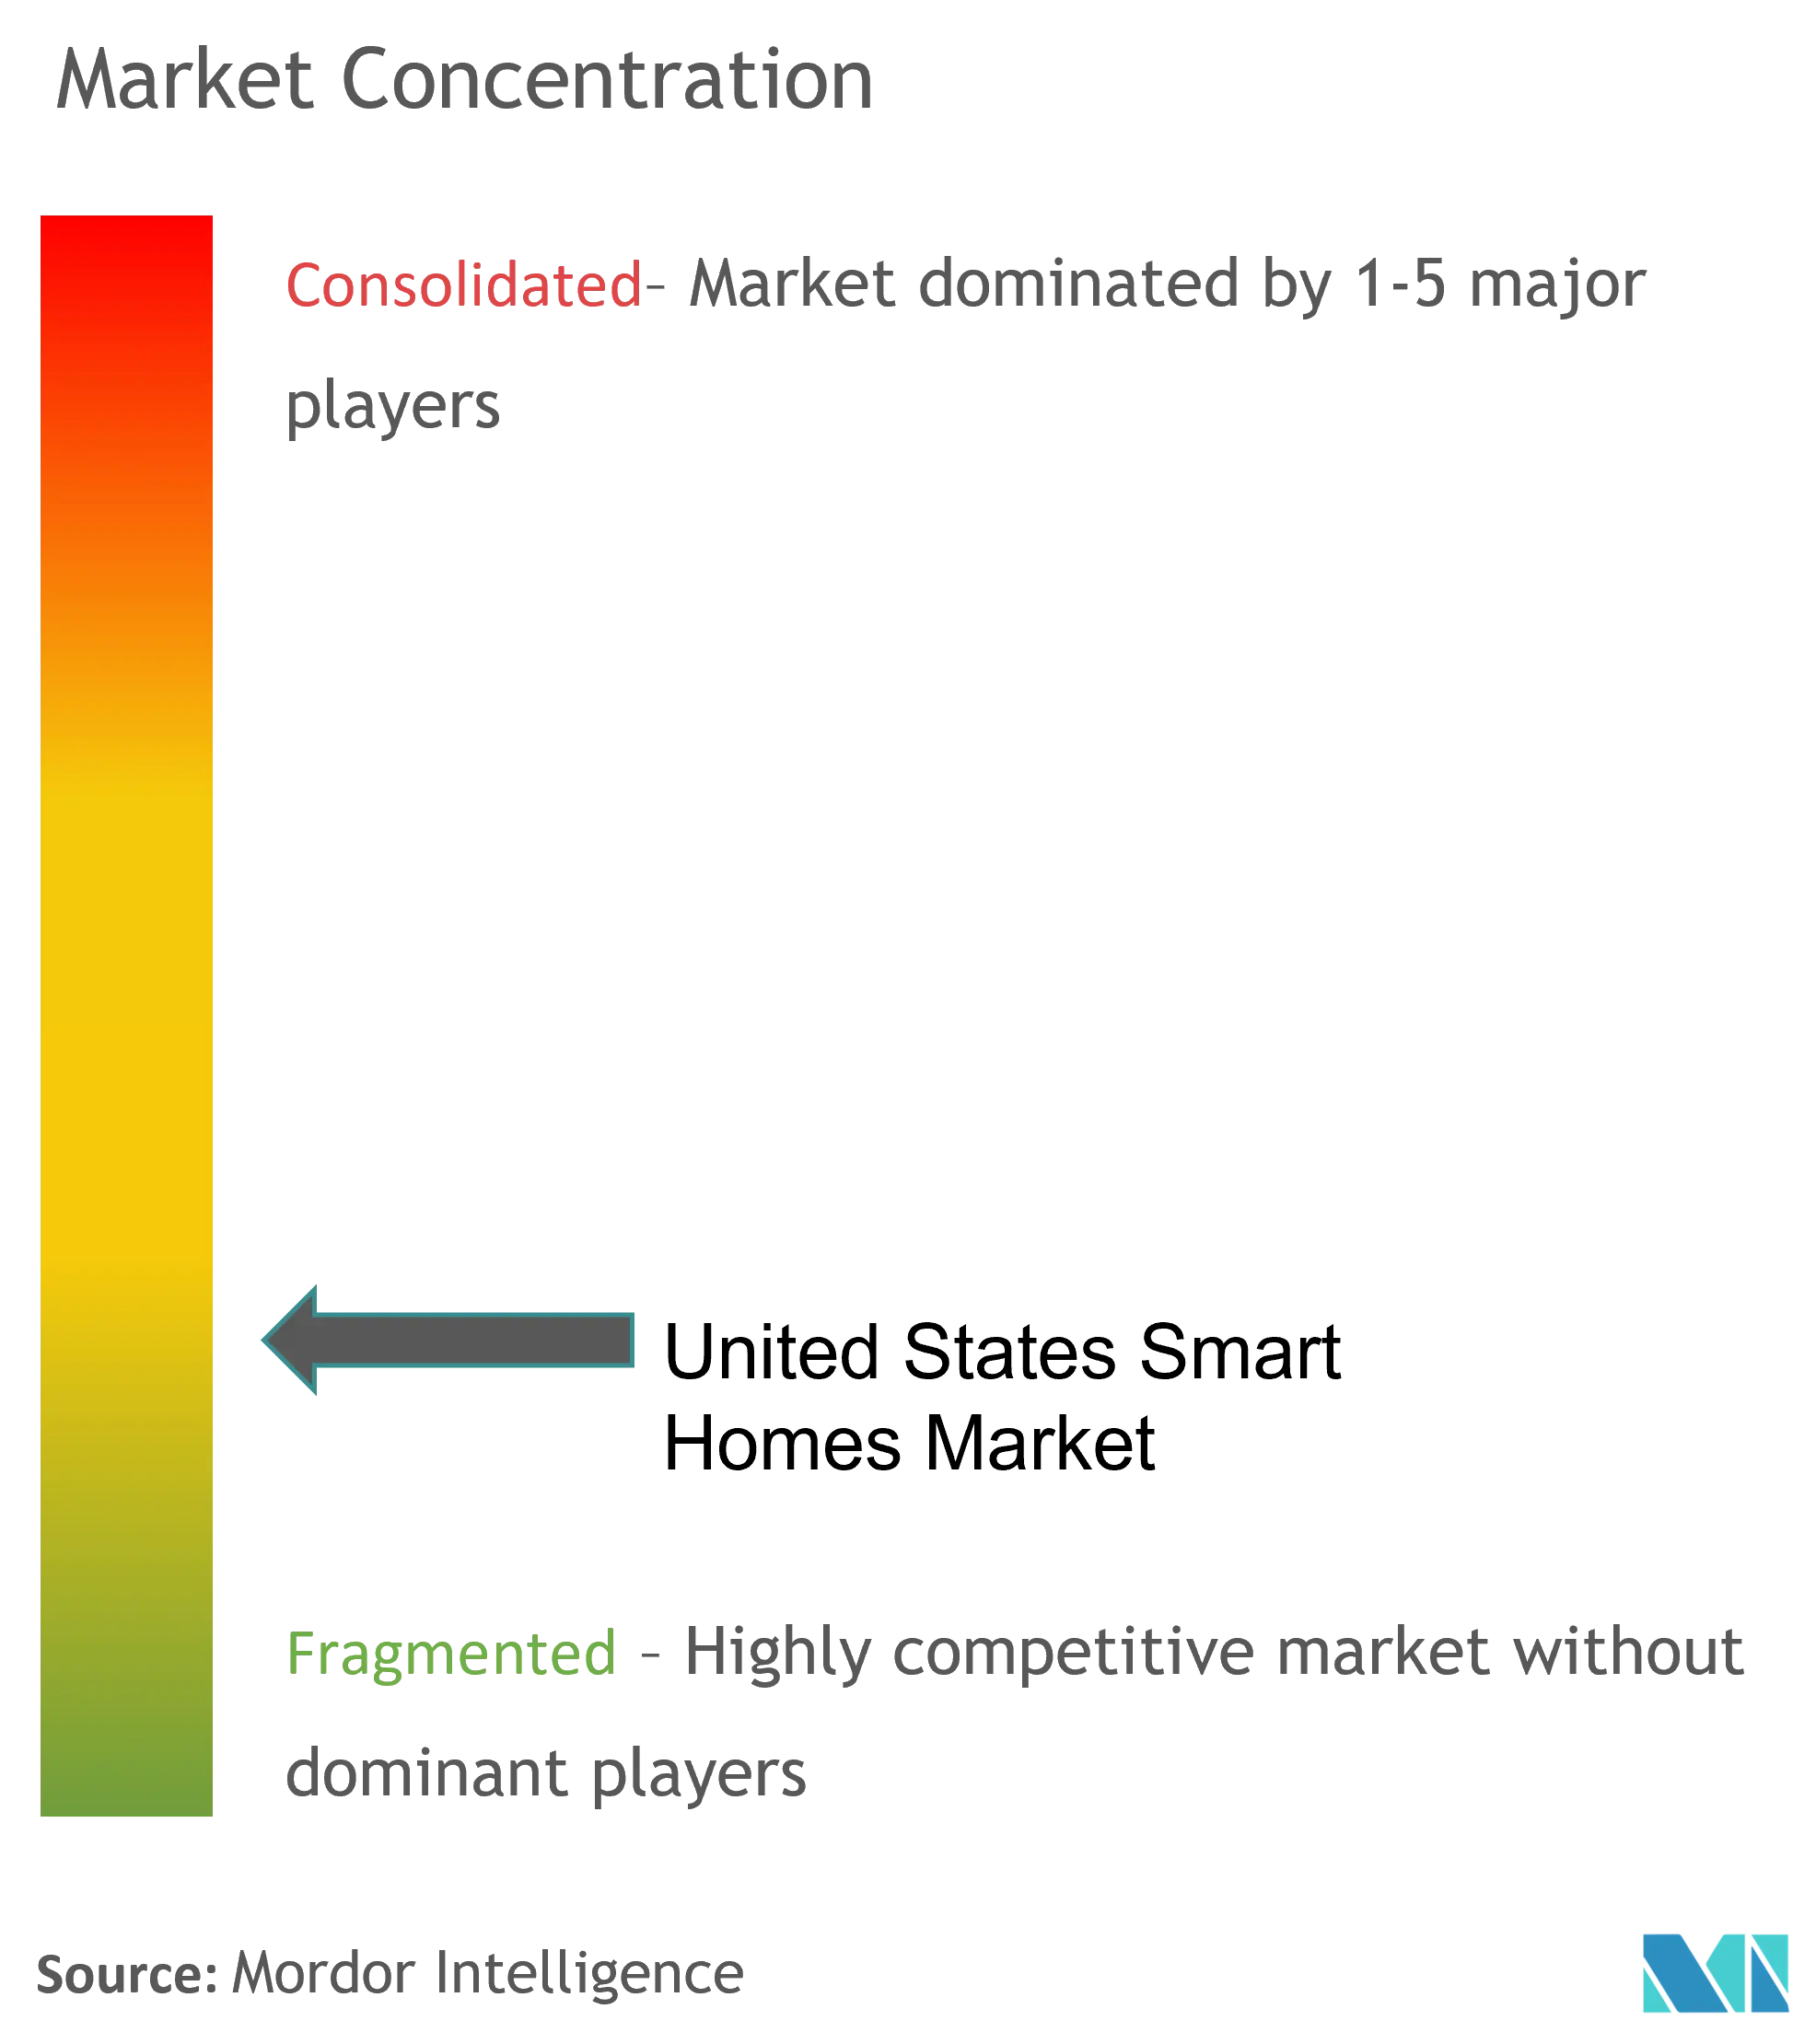
Competitive intensity in the United States smart homes market is medium-high, with five leading platform providers accounting for an estimated 45% share yet leaving ample room for specialized entrants. Amazon and Google dominate voice-assistant ecosystems; each sells multimodal smart displays that double as Thread border routers. Apple’s brand equity and privacy stance carve out a premium segment despite its slower release cadence. Honeywell, Schneider Electric, and Johnson Controls leverage decades of building-automation expertise to secure professional-install and light-commercial niches.
Strategic focus has shifted decisively toward ecosystem breadth. Amazon’s USD 25 billion Alexa investment, despite years of losses, underscores the bet that subscription revenue will cover past deficits and future R&D . Google’s acquisition of Wiz strengthens its lighting portfolio while unlocking user-behavior data for cross-device optimization. Apple’s HomeOS delay reflects its insistence on edge-processed intelligence to differentiate on privacy. Meanwhile, white-space innovators like OhmConnect (now merged with Google Nest Renew) and Athom (80% stake acquired by LG) are positioning energy services and cross-vendor dashboards as the next battlegrounds.
Patent filings highlight voice-command disambiguation, context-aware scene control, and low-power edge AI as priority themes, with Meta, Samsung, and Sony all vying for foundational IP. Utilities and insurers are quietly amassing proprietary datasets that could fuel new underwriting and demand-response products, signaling another competitive front beyond traditional device makers.
United States Smart Homes Industry Leaders
ABB Ltd.
Schneider Electric SE
Honeywell International Inc.
LG Electronics Inc.
Cisco Systems Inc.
- *Disclaimer: Major Players sorted in no particular order

Market Opportunities and Future Outlook
Interoperability upgrades are creating whitespace in multi-ecosystem households and managed multifamily deployments, where residents and property managers often need devices to work across more than one control environment. The Connectivity Standards Alliance released Matter 1.6 in June 2026, introducing Joint Fabric for shared administration of a single Matter network. Silicon Labs showcased a 200-node Matter-over-Thread validation network in June 2026, reflecting a shift from basic device compatibility to scale validation for larger residential footprints and multi-dwelling unit scenarios.
Local-first operation and energy orchestration are also emerging as distinct opportunity pockets within the United States smart-homes market, particularly where privacy, latency, and resiliency concerns limit always-on cloud dependence. One Raven launched a local-first smart home operating system for production homebuilders in July 2026, targeting simpler commissioning and reduced cloud exposure. In energy, collaborations connecting home hardware to grid-facing programs are becoming more concrete, including the June 2026 Sunrun, Tesla, and Renew Home plan centered on aggregating home batteries and smart thermostats into virtual power plant capacity. That model supports broader bundling of smart thermostats, connected panels, and home energy management into utility and service-provider offers.
Recent Industry Developments
- July 2026: LG Electronics partnered with GS E&C to develop AI home solutions by integrating the LG ThinQ ON hub with GS E&C's Xi apartment platform. The collaboration targets a scaled, multi-unit residential context, strengthening smart-home distribution through housing developers and expanding the role of hubs in apartment-level automation.
- March 2025: The FCC formally launched the Cyber Trust Mark labeling scheme for consumer IoT, with Amazon, Best Buy, and Google pledging preferential shelf placement for certified devices. The program elevates cybersecurity labeling into a visible purchase criterion and pushes device makers to align product security practices with NIST-based requirements to maintain channel competitiveness.
- May 2024: New York rolled out its IRA-funded home energy rebates, catalyzing demand for connected energy devices such as smart thermostats, heat pumps, and connected water heaters. The launch operationalized a major purchase incentive at the state level and reinforced utility and contractor ecosystems that bundle devices, installation, and verification.


Research Methodology Framework and Report Scope
Market Definition and Coverage
This market covers revenue generated in the United States from connected home devices and related enabling components that automate, monitor, or control household functions (such as security, lighting, entertainment, energy management, appliances, and home control).
Scope exclusions: Commercial smart building deployments and industrial automation systems are excluded, even if similar connected technologies are used.
Segmentation Overview
- By Product Type
- Comfort and Lighting
- Control and Connectivity
- Energy Management
- Home Entertainment
- Security
- Smart Appliances
- By Connectivity Technology
- Wi-Fi-enabled devices
- Thread-enabled devices
- By Installation Type
- DIY / Self-installed
- Professionally installed integrated systems
- By Sales Channel
- Online retail (Amazon, direct-to-consumer)
- Telecom / Utility bundles (5G-FWA, demand-response kits)
- By Component
- Hardware (devices and hubs)
- Subscription and monitoring services
Data Sources, Market Sizing, and Validation
Desk Research
Desk research was used to anchor the model to real adoption and housing context in the United States, and then to sanity-check device category weightings. We reviewed public datasets and publications such as the US Census Bureau (housing stock and household counts), Bureau of Labor Statistics (consumer spending signals), US Energy Information Administration (residential energy use context), Federal Communications Commission (broadband availability as an enabling signal), and US International Trade Commission data (trade flows for relevant device groupings).
After that, we used company filings, investor presentations, product announcements, and reputable press coverage to understand mix shifts across security, control hubs, lighting, and major appliances, along with the direction of typical pricing. For harder-to-collect references like patent activity and shipment proxies, we also used a paid patent database and a paid company financials and news database to strengthen cross-checks. These desk sources are illustrative, and additional public and paid references were also used to collect data, validate assumptions, and clarify definitions.
Primary Interviews and Surveys
Primary work focused on validating what gets counted as smart home revenue in the United States, and on aligning category shares with what is actually sold and installed. We spoke with a mix of device makers, channel partners, installers, and service and monitoring stakeholders, and then used surveys to pressure-test adoption pace, pricing movement, and the split between DIY and professionally installed systems across major US regions.
Distribution of primary research fieldwork respondents
| Company type | Respondent position | Region |
|---|---|---|
| Top tier: 32% | CXOs: 17% | |
| Mid tier: 47% | Functional/Unit leaders: 35% | |
| Smaller Players: 21% | Managers: 48% |
Market-Sizing & Forecasting
Market sizing starts with a top-down build that reconstructs the addressable smart home spend pool from US household counts and device adoption signals. This total is then translated into category-level revenue using average selling price and replacement cycle assumptions. After that overall figure is built, we corroborated it with selective bottom-up checks, such as sampled price tracking across channels and roll-ups from a limited set of supplier and installer revenue disclosures, which helped adjust totals when coverage was uneven.
Key inputs in the model included the number of occupied households, broadband availability as an enablement indicator, mix of DIY versus professionally installed systems, observed pricing bands for common device types, and attach rates for monitoring or subscription services where applicable. Forecasting used scenario analysis supported by expert views on smart device penetration, pricing normalization, and upgrade cycles, and the scenarios were reconciled into a single base case. Where bottom-up visibility was patchy (for example, smaller installers or niche categories), gaps were handled through calibrated shares tied back to the household-level demand pool, then re-checked through primary feedback.
Data Validation & Update Cycle
Outputs were validated through multiple checks so the totals stayed consistent with independent signals such as household adoption narratives, channel direction, and broad consumer spending trends. If a device category showed a jump that was not supported by the enabling indicators, we revisited assumptions and, when needed, re-contacted respondents to confirm what changed.
Before sign-off, the model goes through review steps, including peer review of assumptions, variance checks against prior-year movements, and consistency checks across related categories to minimize double counting. Reports are refreshed annually, and interim updates are made when material events occur, such as a major pricing reset or a regulatory change affecting connected devices. Right before delivery, we perform a fresh review pass so clients receive the latest updated view.
Mordor Intelligence's United States Smart Homes Market Market Estimate Compared With Other Published Estimates
Published estimates for the United States smart homes market can vary because each publisher uses a different scope line, then applies different pricing and adoption assumptions over time. Differences also come from whether services are counted with devices, how bundles are treated, and how quickly older data points get refreshed.
Professional monitoring and subscription fees are treated outside Mordor Intelligence's scope here, which can drive some published totals higher even when device demand looks similar. The other common gap drivers are category boundaries (for example, whether connected major appliances are included at full value), the way average selling prices are escalated or discounted over the forecast, and currency timing or inflation treatment when older years are restated.
Benchmark comparison
| Source | Market Size | Gaps in Research Methodology |
|---|---|---|
| Mordor Intelligence | USD 50.30 B (2025) | |
| Trade Journal A | USD 31.85 B (2023) | Uses an earlier base year and often reports a broader, faster growth case, with category coverage and service treatment not fully explained, which limits comparability to a 2025 device-focused view. |
| Industry Brief B | USD 19.88 B (2024) | This estimate appears to focus on a narrower device set and a conservative adoption curve, and it can understate categories like connected appliances or multi-device households when modeled as single-device penetration. |
The spread is mainly explained by what gets counted and when it is counted, rather than by a single right or wrong number. By keeping the scope tied to a repeatable household-led demand pool and then testing pricing and mix assumptions with field feedback, the resulting value stays traceable and easier to reconcile across years.


Key Questions Answered in the Report
What is the current value of the United States smart homes market?
The market stands at USD 54.53 billion in 2026 and is projected to reach USD 81.61 billion by 2031
Which product category leads spending?
Security solutions dominate with a 29.30% revenue share, largely due to insurance-linked discounts and the perception of immediate safety benefits.
Why is Thread technology receiving so much attention?
Thread 1.4 enables low-power, self-healing mesh networks that allow devices from multiple brands to interoperate without user intervention, solving historic reliability gaps.
How do federal incentives influence smart home adoption?
Programs such as the USD 8.8 billion Home Energy Rebates lower upfront costs for thermostats, heat pumps, and connected appliances, directly accelerating purchase decisions.
Are privacy concerns still a major barrier?
Yes. Despite the FCC’s voluntary Cyber Trust Mark, data-sharing apprehension—especially surrounding voice assistants and cameras—continues to curb adoption rates, shaving an estimated 1.3% off long-term CAGR.
How are service revenues changing the competitive landscape?
Subscription offerings like Amazon’s Alexa+ illustrate an industry shift toward recurring revenue, with services forecast to grow at an 10.95% CAGR through 2031, outpacing hardware growth.
Page last updated on:






