Market Overview
| Study Period | 2020 - 2031 |
|---|---|
| Forecast Data Period | 2026 - 2031 |
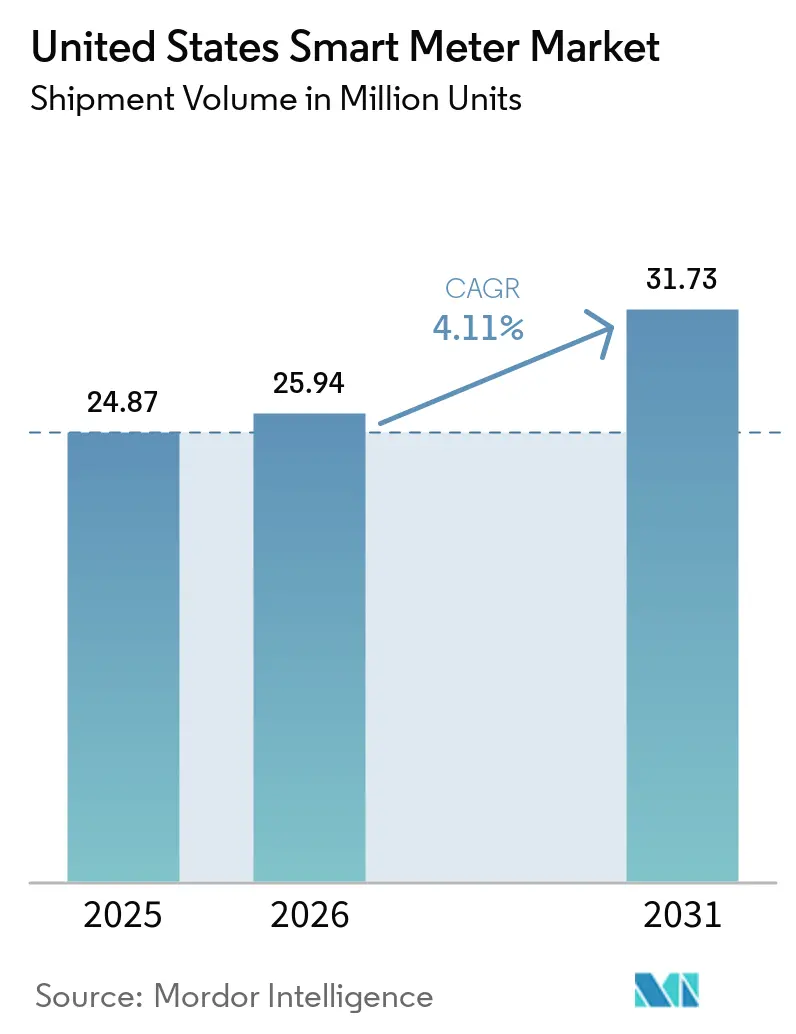
| Base Year Market Size (2025) | 24.87 Million units |
| Market Volume (2026) | 25.94 Million units |
| Market Volume (2031) | 31.73 Million units |
| Growth Rate (2026 - 2031) | 4.11% CAGR |
| Market Concentration | Medium |
Major Players *Disclaimer: Major Players sorted in no particular order Image © Mordor Intelligence. Reuse requires attribution under CC BY 4.0. | |
United States Smart Meter Market Analysis by Mordor Intelligence
The United States smart meter market size was valued at 24.87 million units in 2025 and estimated to grow from 25.94 million units in 2026 to reach 31.73 million units by 2031, at a CAGR of 4.11% during the forecast period (2026-2031). Uptake accelerates as federal infrastructure grants tie funding to advanced metering, utilities refresh devices installed in the 2009-2013 wave, and carriers blanket rural counties with low-power wide-area coverage. Hardware commoditization holds headline prices in check yet added cybersecurity features lift the average meter bill of materials, nudging vendors toward software subscriptions. Time-of-use tariff expansion, grid-edge visibility for renewables, and bidirectional metering for vehicle-to-grid pilots collectively reinforce a steady replacement cadence rather than a single deployment spike. Semiconductor supply normalizes compared with the pandemic years, but intermittent shortages of communication chipsets still lengthen production cycles, encouraging dual-sourcing strategies.
Key Report Takeaways
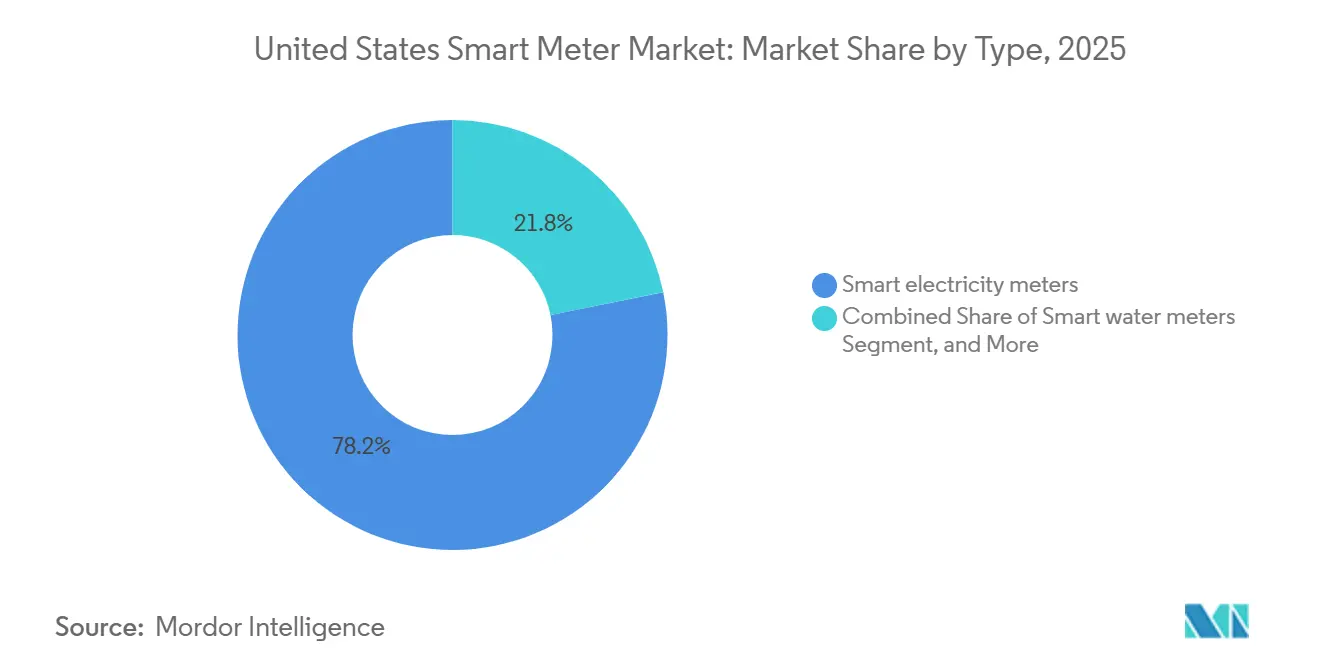
- By type, smart electricity meters led with 78.19% of the United States smart meter market share in 2025, while smart water meters are projected to advance at a 5.01% CAGR through 2031.
- By end-user, residential installations accounted for 71.63% of deployments in 2025, whereas the industrial segment is forecast to grow at a 4.95% CAGR over 2026-2031.
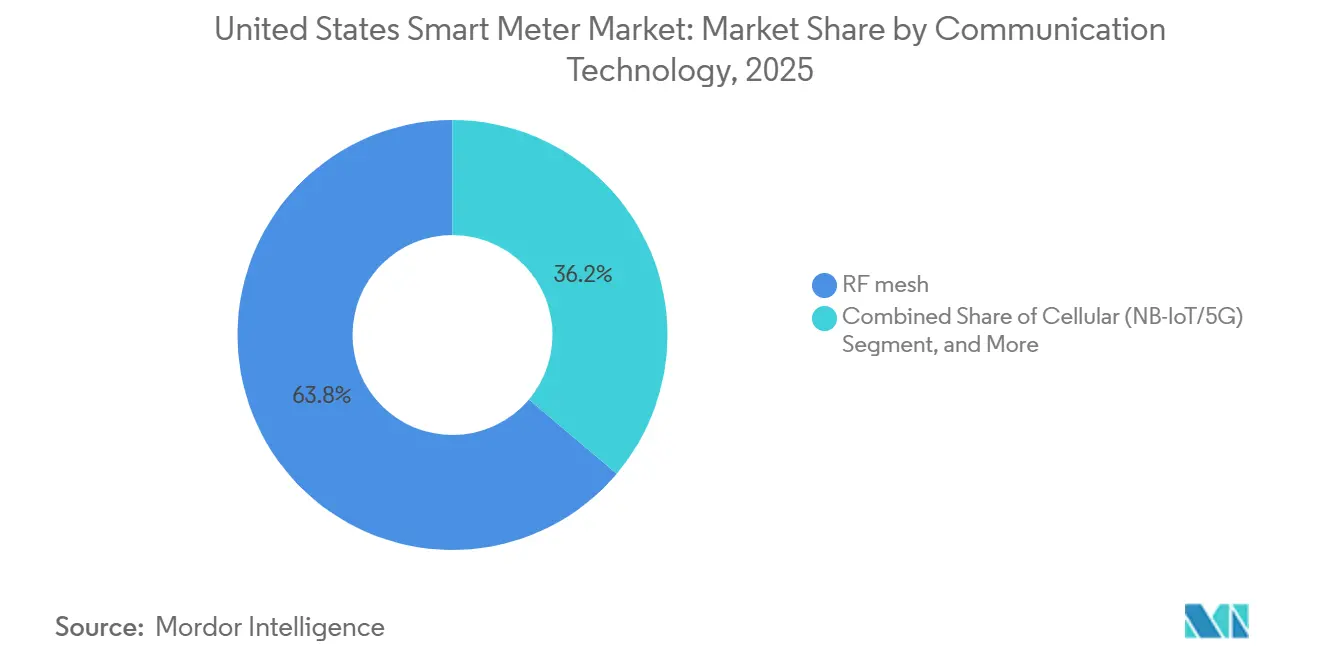
- By communication technology, RF mesh commanded 63.84% of installations in 2025, yet cellular protocols integrating NB-IoT and 5G are expected to post the fastest rise at a 4.86% CAGR to 2031.
- By component, hardware represented 62.28% of spending in 2025, but software platforms for meter data management and analytics are set to record the quickest momentum at a 4.53% CAGR during the forecast period.
Note: Market size and forecast figures in this report are generated using Mordor Intelligence’s proprietary estimation framework, updated with the latest available data and insights as of 2026.
United States Smart Meter Market Trends and Insights
Drivers Impact Analysis*
| Driver | (~) % Impact on CAGR Forecast | Geographic Relevance | Impact Timeline |
|---|---|---|---|
| Higher Consumer Awareness and Federal Mandates | +1.20% | National, with early gains in California, New York, Texas | Medium term (2-4 years) |
| Expansion of Advanced Metering Infrastructure Funding Programs | +1.00% | National, concentrated in rural and underserved areas | Short term (≤ 2 years) |
| Utility Decarbonization and Electrification Roadmaps | +0.90% | California, New York, Washington, Massachusetts, Colorado | Long term (≥ 4 years) |
| Rise of Time-of-Use Tariffs Driving Real-Time Metering Needs | +0.70% | National, led by investor-owned utilities in regulated states | Medium term (2-4 years) |
| 5G and NB-IoT Rollout Improving Meter Connectivity | +0.50% | Urban and suburban markets, expanding to rural territories | Medium term (2-4 years) |
| Integration of Distributed Energy Resources and V2G Ecosystems | +0.40% | California, Hawaii, Vermont, select metropolitan areas | Long term (≥ 4 years) |
| Source: Mordor Intelligence | |||
Higher Consumer Awareness and Federal Mandates
Federal law earmarked USD 3 billion for advanced metering, with 40% targeted at disadvantaged communities, prompting utilities to shorten replacement schedules by up to two years.[1]U.S. Department of Energy, “Grid Deployment Office,” energy.gov State campaigns that highlight bill savings under dynamic pricing raised opt-in rates to 34% in 2025, improving demand-side flexibility.[2]U.S. Energy Information Administration, “Electric Power Monthly,” eia.gov Cost-share incentives in California and New York let utilities accelerate rollout to full coverage by 2028.[3]California Public Utilities Commission, “Electrical Energy,” cpuc.ca.gov The Department of Energy’s renewed Smart Grid Investment Grant ties funding to interoperability standards, narrowing vendor fragmentation. Together, policy carrots and consumer familiarity anchor a predictable adoption curve that underpins the United States smart meter market.
Expansion of Advanced Metering Infrastructure Funding Programs
The Rural Utilities Service committed USD 1.2 billion in 2025, closing a coverage gap where over one-quarter of rural households still relied on manual reads.[4]U.S. Department of Agriculture, “Electric Programs,” rd.usda.gov State co-financing in Texas, Florida, and North Carolina raised available capital, letting cooperatives piggyback fiber backhaul on AMI projects. Tribal authorities installed 47,000 meters in the same year under dedicated federal grants, expanding energy sovereignty. Longer repayment windows from the Loan Programs Office cut financing costs by as much as 150 basis points. Domestic-content rules sparked on-shoring of communication-module assembly lines, trimming logistical risk and adding local jobs within the U.S. advanced metering infrastructure ecosystem.
Utility Decarbonization and Electrification Roadmaps
Investor-owned utilities serving 87 million customers pledged net-zero carbon targets, requiring real-time visibility into rooftop solar, batteries, and charging loads that only granular metering delivers. California ordinances banning gas hookups in new homes shift heating and cooking loads to electricity, magnifying grid-edge data needs. New York’s 70% renewable mandate compels voltage and reactive-power monitoring at each service point. Washington and Massachusetts pair meter data with building benchmarking, automating compliance for commercial properties. Rate cases filed in 2025 bundle AMI investment with time-varying tariffs, reflecting the centrality of smart meters to clean-energy economics.
Rise of Time-of-Use Tariffs Driving Real-Time Metering Needs
Forty-two investor-owned utilities required 15-minute interval data for default TOU plans in 2025, outstripping the capability of first-generation automated reads. California achieved 8-12% peak reduction among customers equipped with smart thermostats tied to meter data. FERC Order 2222 obligated utilities to support telemetry for distributed resource aggregation, catalysing hardware refresh. Critical-peak rebates in ERCOT territory paid residential users up to USD 0.75 per kilowatt-hour curtailed, pushing enrolment above 20%. Success hinges on frequent data refresh, prompting thirty-one utilities to launch portals that display usage every five to fifteen minutes.
Restraints Impact Analysis*
| Restraint | (~) % Impact on CAGR Forecast | Geographic Relevance | Impact Timeline |
|---|---|---|---|
| Cyber-Security and Privacy Concerns in AMI Networks | -0.60% | National, acute in states with strict data privacy laws | Short term (≤ 2 years) |
| Supply-Chain Disruptions for Semiconductor Components | -0.40% | National, with regional variance in vendor diversification | Short term (≤ 2 years) |
| Slower Smart Gas Meter Cost-Benefit Realization | -0.30% | Gas utility territories, concentrated in Northeast and Midwest | Long term (≥ 4 years) |
| Inter-Utility Data Standardization Gaps | -0.20% | Regional transmission organizations and balancing authorities | Medium term (2-4 years) |
| Source: Mordor Intelligence | |||
Cyber-Security and Privacy Concerns in AMI Networks
Reported cyber incidents involving AMI networks climbed 23% year-over-year in 2025, exposing weaknesses in unencrypted legacy protocols. Binding federal directives now compel utilities to implement NISTIR 7628 controls within 18 months, delaying several deployments as systems undergo audits. Privacy advocates argue that 15-minute data reveal occupancy patterns, leading to stricter consent regimes that trimmed dynamic pricing participation by more than ten percentage points in two key states. Utilities dedicate up to 18% of AMI capital to security layers, lifting endpoint cost envelopes by USD 60-70. Quarterly penetration testing mandated under NERC CIP-012-1 adds a compliance burden that smaller municipal utilities struggle to absorb.
Supply-Chain Disruptions for Semiconductor Components
Pandemic-era chip shortages eased in 2025, yet delivery for NB-IoT and Wi-SUN radios still trails pre-2020 norms by about a month. Geopolitical tension over rare-earth inputs forced redesigns that stretched development cycles and deferred meter launches. The CHIPS and Science Act spurred new fabs in Arizona and Ohio, but commercial-scale output will not arrive until 2027. Utilities hedge by dual sourcing across geographies, adding up to 9% procurement cost. Tariffs on imported radio modules raised landed prices, encouraging vendors to set up final assembly in domestic plants that came online in late 2025.
*Our forecasts treat driver/restraint impacts as directional, not additive. The impact forecasts reflect baseline growth, mix effects, and variable interactions.
Segment Analysis
By Type: Electricity Dominance Masks Water-Segment Momentum
Smart electricity meters represented 78.19% of the United States smart meter market share in 2025, cementing their role as the industry benchmark for AMI rollouts. Utilities leaned on these devices for automated load control, with 4.2 million endpoints enrolled in demand-response programs that shaved 1,800 megawatts from summer peaks. Smart water meters are advancing at a 5.01% CAGR to 2031, the quickest among meter types, as municipalities battle non-revenue losses averaging 16% of treated supply. Water-sector adoption accelerates in drought-prone western states that prize consumption transparency to enforce tiered tariffs.
Gas utilities face longer payback windows of 11-14 years, slowing smart gas uptake despite emerging methane-fee regulations. Even so, pilot projects in Massachusetts and New York use pressure sensors to flag leaks, aligning with pipeline safety directives. Heat meters remain niche, tied to district-heating loops in the Pacific Northwest and Northeast, but building-benchmarking laws stir gradual interest. As the United States smart meter market size for water endpoints grows faster than electricity, suppliers diversify product lines to capture incremental volume without cannibalizing mature electric opportunities.


By End-User: Industrial Segment Outpaces Residential Growth
Residential accounts held 71.63% of deployments in 2025, yet that base deepens rather than widens because saturation approaches in urban service areas. Industrial users are projected to expand at a 4.95% CAGR, the highest among end-users, as manufacturers monetize flexible load in wholesale markets and pair smart meters with on-site solar and storage. Commercial buildings integrate meter data into automation systems that fine-tune HVAC runtimes, clipping energy bills by up to 18%. Utilities themselves deploy advanced meters at substations to watch transformer loading in real time, improving asset longevity.
Industrial aggregation under FERC 2222 contributed 620 megawatts of curtailable load in 2025, unlocking payments that offset meter capital outlays. Commercial landlords in benchmarking jurisdictions avoid costly penalties by automating data submission, further propelling adoption. Solar-rich residential segments need bidirectional metering, already present in 18% of California and Hawaii homes. Microgrid-ready meters protect industrial parks in the hurricane-prone Gulf Coast, justifying premium spend for resilience features. Although the household base remains numerically dominant, growth tilts toward industrial and large commercial users, underscoring a shift in spending priorities within the United States smart meter market.
By Communication Technology: Cellular Protocols Gain Ground on Legacy RF Mesh
RF mesh kept 63.84% share in 2025, anchored by legacy rollouts when cellular M2M pricing was steep. The United States smart meter market size for cellular endpoints will rise rapidly as NB-IoT and 5G coverage now blankets 94% of the population, eliminating costly repeaters in sparsely populated zones. Deployment of cellular meters climbs at a 4.86% CAGR to 2031, the fastest among connectivity options, while power-line communication persists where utilities already maintain fiber backhaul to substations.
T-Mobile’s 2.5 GHz spectrum accelerates 5G densification, slashing latency for demand-response controls to below 50 milliseconds, an important threshold for frequency regulation. PLC struggles on underground feeders where signal attenuation forces extra concentrators that add USD 35-50 per endpoint, nudging buyers toward cellular. Wi-SUN Alliance certifications climbed, giving municipal utilities interoperable options that reduce vendor lock-in. FCC allocation of 6 GHz unlicensed spectrum enlarges future choices, though meter chipsets have yet to commercialize the band. The march toward cellular underscores a broader shift from proprietary mesh toward standards-based, carrier-managed networks in the United States smart meter market.
By Component: Software Platforms Outpace Hardware as Analytics Demand Surges
Hardware consumed 62.28% of spend in 2025, but price erosion of 4-6% per year compresses gross margins and shifts vendor focus to software subscriptions. Software platforms for meter data management and analytics will log a 4.53% CAGR through 2031, the fastest among components, as utilities embed artificial intelligence for transformer-failure prediction and theft detection. Managed services represented 18% of outlays in 2025 because utilities offload network operations and firmware patching to third parties, improving cyber posture.
Machine-learning pilots warned of transformer overheating six to nine months ahead, cutting outage minutes by up to 19% in early trials. Cloud-native architectures dominate new MDM procurements, enabling elastic scaling for petabyte-scale datasets. Vendors now bundle edge analytics into firmware, creating differentiation without violating the commodity hardware ceiling. Smaller municipal utilities, once priced out of advanced analytics, adopt software-as-a-service that bills per meter per month, lowering capital thresholds. As recurring revenue displaces one-time hardware sales, the earnings mix across the United States smart meter market gradually tilts toward digital services.
Geography Analysis
The United States smart meter market expands unevenly across regions, reflecting divergent policy drivers, utility ownership models, and demographic density. California, Texas, and Florida together accounted for more than one-third of annual shipments in 2025 as each state paired AMI with resiliency or conservation mandates. The Midwest accelerated installations after semiconductor supply constraints eased, allowing investor-owned utilities to resume deferred rollouts. Northeastern states push smart gas and water meters to curb system leaks and comply with emerging methane regulations, diversifying regional demand profiles.
In the West, drought pressures intensify water-meter replacement, while wildfire mitigation compels granular electric-grid monitoring. Pacific Coast utilities use interval data to coordinate public-safety power shutoffs, embedding meter telemetry into situational-awareness dashboards. Mountain states capitalize on federal rural grants to overcome sparse-population economics that once rendered mesh backhaul uneconomic. Southern cooperatives leverage broadband partnerships, stringing fiber for both backhaul and rural internet access, transforming AMI into a driver of digital inclusion.
The Northeast’s aging housing stock benefits from smart gas meters able to flag pressure irregularities, aligning with strict pipeline-safety oversight. Mid-Atlantic states emphasize energy benchmarking, spurring commercial adoption. In the Midwest, winter peak-shaving programs rely on price signals enabled by widespread meter penetration. The Southeast leans on AMI to integrate rooftop solar and battery programs as net-metering rules evolve. Although regional growth vectors differ, they collectively feed a national installed base projected to top 150 million endpoints by 2031, sustaining mid-single-digit growth in the United States smart meter market.
Competitive Landscape
Market concentration remains moderate: Itron, Landis+Gyr, Aclara, Honeywell, and Sensus shipped an estimated 68% of units in 2025. Incumbents exploit scale advantages, negotiated cellular-data rates, and multi-year service contracts that raise switching barriers. New entrants chase gaps in water and gas metering or emphasize open-protocol architectures that lower integration costs. Vertical integration accelerated in 2025 as hardware vendors acquired analytics providers, seeking sticky, subscription revenue streams.
Edge analytics emerged as a contest arena. Vendors embedded voltage-quality monitoring and harmonic detection directly in firmware, reducing bandwidth needs and enabling faster fault isolation. Patent filings on encrypted firmware updates and hardware roots of trust underscore a pivot toward cybersecurity differentiation. Partnerships with cellular carriers allow bundled connectivity and hardware at predictable monthly fees, resonating with cooperatives that lack telecom procurement expertise.
Software specialists target utilities with heterogeneous meter fleets, offering meter-agnostic analytics that avoid forklift upgrades. Municipal buyers value interoperability, boosting adoption of open-source MDM platforms tailored for smaller IT staffs. White-space opportunities persist in retrofit communication modules that prolong first-generation meter life. Competitive intensity therefore increases, but incumbents retain share through installed-base leverage, ensuring the United States smart meter market continues to display a balanced mix of scale and innovation dynamics.
United States Smart Meter Industry Leaders
Badger Meter Inc.
Mueller Systems LLC
Diehl Metering US
Kamstrup
Neptune Technology Group Inc.
- *Disclaimer: Major Players sorted in no particular order


Recent Industry Developments
- January 2026: Itron signed a five-year agreement with a Midwest cooperative to deploy 420,000 NB-IoT smart meters bundled with cloud-based analytics, valued at about USD 68 million.
- December 2025: Landis+Gyr won a USD 52 million contract with a California water district for 310,000 acoustic leak-detection meters aimed at cutting non-revenue water by 12% in three years.
- November 2025: Honeywell and a major cellular carrier launched a fixed-price package that combines NB-IoT meters, ten-year connectivity, and managed operations for rural cooperatives across 12 states.
- October 2025: Aclara introduced an electric meter with real-time power-quality monitoring compliant with IEEE 1547-2018, targeting distributed-energy integration.


United States Smart Meter Market Report Scope
The United States Smart Meter Market Report is Segmented by Type (Smart Electricity Meters, Smart Gas Meters, Smart Water Meters, Smart Heat Meters), End-User (Residential, Commercial, Industrial, Utilities), Communication Technology (RF Mesh, Power Line Communication, Cellular, Other Technologies), and Component (Hardware, Software, Services). The Market Forecasts are Provided in Terms of Volume (Units).
By Type
| Smart Electricity Meters |
| Smart Gas Meters |
| Smart Water Meters |
| Smart Heat Meters |
By End-User
| Residential |
| Commercial |
| Industrial |
| Utilities |
By Communication Technology
| RF Mesh |
| Power Line Communication (PLC) |
| Cellular (3G/4G/5G, NB-IoT) |
| Other Technologies (Wi-SUN, Zigbee, LoRa) |
By Component
| Hardware (Meters, Communication Modules) |
| Software (MDM, Analytics) |
| Services (Deployment, Managed Services) |
| By Type | Smart Electricity Meters |
| Smart Gas Meters | |
| Smart Water Meters | |
| Smart Heat Meters | |
| By End-User | Residential |
| Commercial | |
| Industrial | |
| Utilities | |
| By Communication Technology | RF Mesh |
| Power Line Communication (PLC) | |
| Cellular (3G/4G/5G, NB-IoT) | |
| Other Technologies (Wi-SUN, Zigbee, LoRa) | |
| By Component | Hardware (Meters, Communication Modules) |
| Software (MDM, Analytics) | |
| Services (Deployment, Managed Services) |


Key Questions Answered in the Report
What was the United States smart meter market size in 2025?
The market reached 24.87 million units in 2025 and is forecast to climb to 31.73 million units by 2031.
Which meter type is growing fastest in the United States?
Smart water meters are projected to advance at a 5.01% CAGR through 2031 as cities tackle non-revenue losses.
Why are industrial customers accelerating smart meter adoption?
Manufacturers use advanced meters to join wholesale demand-response programs and to integrate on-site solar and batteries, driving a 4.95% CAGR in the industrial segment.
How are cellular networks influencing smart meter connectivity?
NB-IoT and 5G coverage now reaches almost all U.S. residents, enabling utilities to deploy cellular meters without costly RF mesh repeaters.
What are the main cybersecurity requirements for new smart meter deployments?
Utilities receiving federal funds must implement NISTIR 7628 controls and perform quarterly penetration testing under NERC CIP-012-1.
Which companies lead the U.S. smart meter supply chain?
Itron, Landis+Gyr, Aclara, Honeywell, and Sensus together shipped about 68% of units in 2025.
Page last updated on:


