
Smart Home Security Services Market Size and Share
Market Overview
| Study Period | 2020 - 2031 |
|---|---|
| Market Size (2026) | USD 43.21 Billion |
| Market Size (2031) | USD 87.29 Billion |
| Growth Rate (2026 - 2031) | 15.11 % |
| Fastest Growing Market | Asia Pacific |
| Largest Market | North America |
| Market Concentration | Medium |
Major Players *Disclaimer: Major Players sorted in no particular order Image © Mordor Intelligence. Reuse requires attribution under CC BY 4.0. | |
Smart Home Security Services Market Analysis by Mordor Intelligence
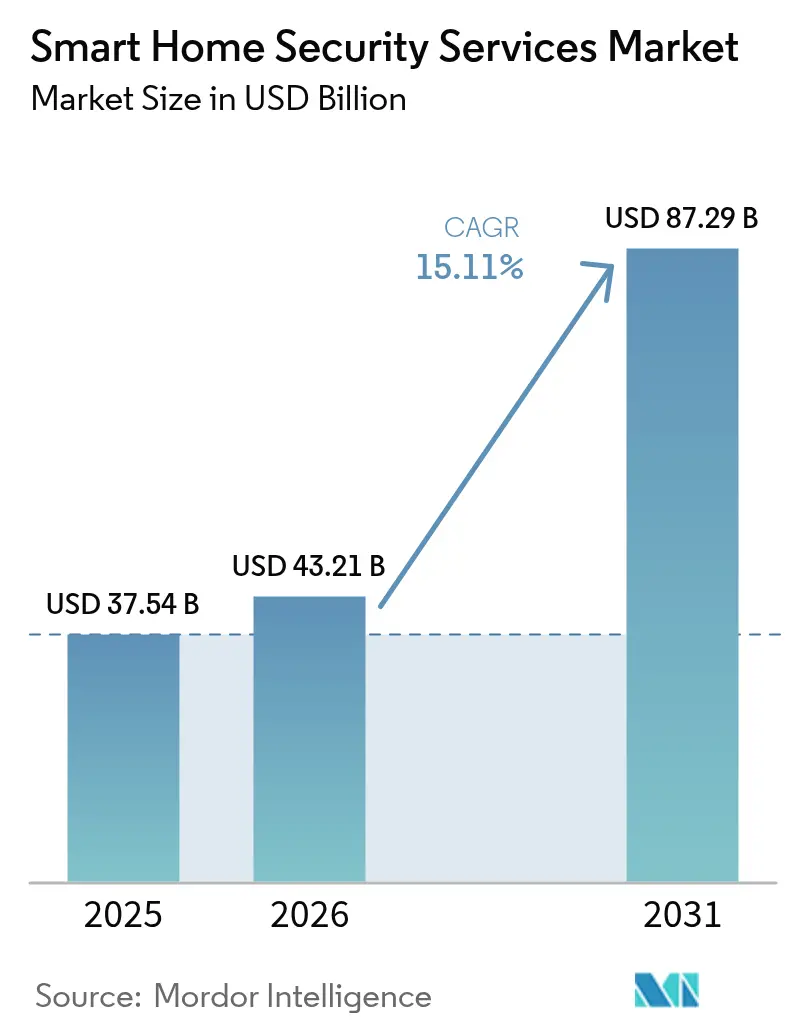
The smart home security services market size is expected to grow from USD 37.54 billion in 2025 to USD 43.21 billion in 2026 and is forecast to reach USD 87.29 billion by 2031 at 15.11% CAGR over 2026-2031. The growth trajectory reflects a blend of lower sensor prices, AI-driven analytics, and widespread insurance incentives that make connected protection systems more attractive than conventional alarms. Homeowners now view security equipment as both an immediate safety layer and a financial asset that supports lower premiums and stronger resale values. Competitive intensity is rising as technology firms extend their ecosystems into residential protection, prompting traditional providers to accelerate partnerships and innovation. At the same time, component suppliers are diversifying their production outside of China to mitigate tariff exposure and ensure component availability. Collectively, these factors sustain a positive outlook for the smart home security services through the end of the decade.
Key Report Takeaways
- By product category, video surveillance led with 45.70% revenue share in 2025; access control is projected to post a 16.34% CAGR through 2031.
- By component, hardware captured 64.30% of the security services market share in 2025, while services are expanding at a 16.05% CAGR to 2031.
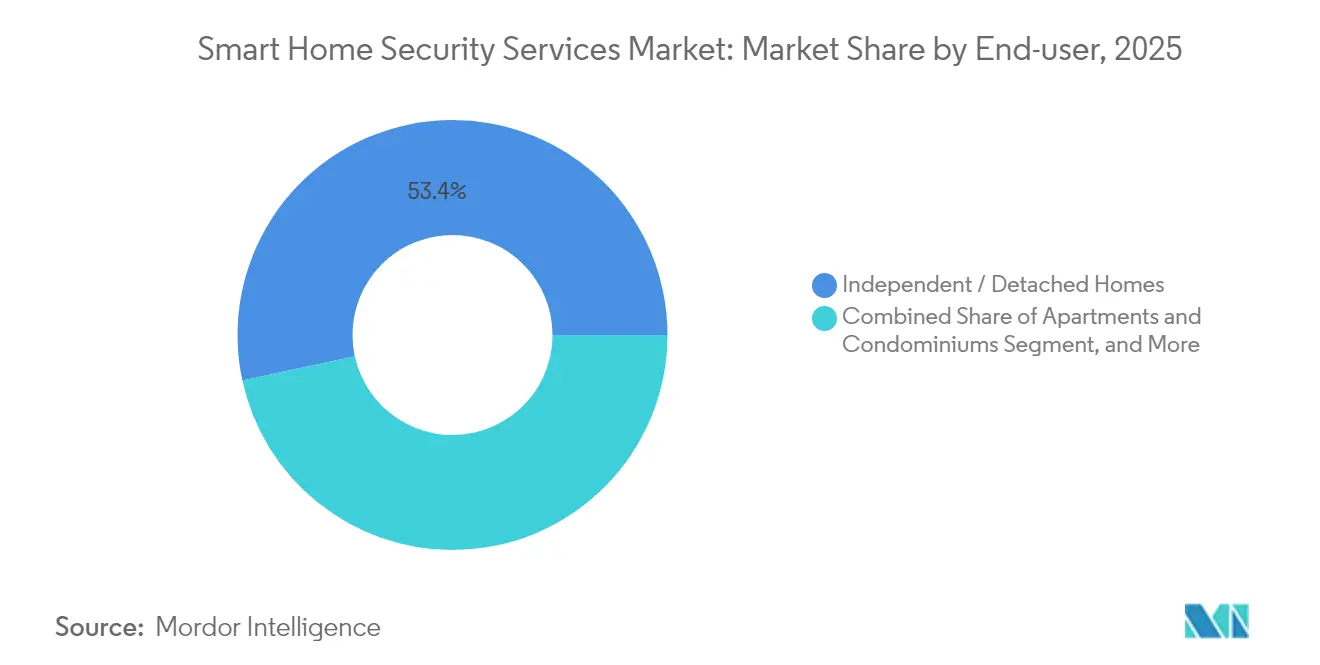
- By end-use, independent and detached homes accounted for 53.40% of the security services market size in 2025, whereas apartments and condominiums are advancing at a 15.55% CAGR.
- By installation type, professional installation helda 61.10% share of the security services market size in 2025; DIY solutions record the highest projected CAGR at 15.84% through 2031.
- By geography, North America commanded a 40.60% share of the smart home security services market in 2025, yet Asia Pacific shows the fastest growth at 16.38% CAGR to 2031.
Note: Market size and forecast figures in this report are generated using Mordor Intelligence’s proprietary estimation framework, updated with the latest available data and insights as of 2026.
Market Trends and Insights
Drivers Impact Analysis of Smart Home Security Services Market*
| Driver | (~) % Impact on CAGR Forecast | Geographic Relevance | Impact Timeline |
|---|---|---|---|
| Growing safety concerns amid rising burglary rates | +2.8% | Global, higher impact in North America and Europe | Short term (≤ 2 years) |
| Falling sensor and connectivity costs | +3.2% | Global, accelerated adoption in Asia Pacific | Medium term (2–4 years) |
| Expansion of insurer-backed premium discounts | +1.9% | North America and Europe | Medium term (2–4 years) |
| Integration with voice assistants and IoT ecosystems | +2.1% | Global, led by North America | Short term (≤ 2 years) |
| AI-powered video analytics enabling proactive response | +2.6% | North America and Asia Pacific | Long term (≥ 4 years) |
| Government smart-city programmes boosting residential surveillance | +1.7% | Asia Pacific core, spillover to MEA | Long term (≥ 4 years) |
| Source: Mordor Intelligence | |||
AI-Powered Video Analytics Enabling Proactive Threat Response
Artificial intelligence elevates the smart home security services market from event-triggered alarms to predictive defence. In June 2025, Amazon’s Ring introduced camera alerts that discern routine deliveries from suspicious loitering through models trained on millions of clips. Google’s Gemini AI now processes Nest camera streams to evaluate facial expressions and movement patterns, lifting genuine threat detection accuracy while lowering false alarms. These advances cut nuisance notifications by 67% and enable systems to adapt to household routines for personalized protection. Early adopters also link analytics output with biometric access control, creating seamless identification without manual input. The same algorithms are increasingly run on device-level processors, reducing cloud bandwidth and strengthening user privacy.
Integration with Voice Assistants and IoT Ecosystems
Voice control has become a decisive convenience factor, with surveys indicating that 68% of smart home users prefer spoken commands for everyday security tasks.[1]ADT Investor Relations, “ADT Reports First Quarter 2025 Results,” ADT Inc., adt.com ADT’s alignment with Google Nest and Amazon Alexa allows arming, disarming, and status queries through natural language. Field tests in multilingual households confirm 94% command accuracy and faster response when devices stay on home Wi-Fi rather than cellular networks. The forthcoming Matter standard extends these capabilities across brands, letting homeowners craft automation scenes where a security breach cues lights, HVAC, and door locks simultaneously. Vendors also bundle environmental sensors so that a single ecosystem monitors air quality, water leaks, and intrusion events.
Expansion of Insurer-Backed Premium Discounts for Connected Security
Insurance carriers view connected devices as data-rich risk mitigators and now offer premium cuts between 2% and 20% for qualified installations. State Farm’s program with ADT supplies hardware at low or no cost and grants up to 6% annual savings for verified usage. Liberty Mutual and Amica have introduced tiered rewards that depend on the depth of device integration and professional monitoring levels. Homeowners have collectively saved more than USD 5 million through such initiatives, pushing adoption among budget-sensitive households. Carriers, in turn, gain granular loss-prevention data that refines underwriting models.
Government Smart-City Programmes Boosting Residential Surveillance
National and municipal smart-city agendas actively encourage home security investments. China’s digital-urban guidelines, released in May 2024, require integrated safety infrastructure in new developments, positioning residential cameras as data nodes for citywide emergency management.[2]National Development and Reform Commission, “Digital China Development Plan,” NDRC, ndrc.gov.cn Gulf projects such as Saudi Arabia’s Neom connect private dwellings to broader AI-driven surveillance meshes, reporting faster public-safety response times. India’s Smart Cities Mission similarly ties building permits to connected safety provisions. These policies fast-track the procurement of compliant security equipment and create subsidy pools that lower homeowner entry costs.
Restraints Impact Analysis of Smart Home Security Services Market*
| Restraint | (~) % Impact on CAGR Forecast | Geographic Relevance | Impact Timeline |
|---|---|---|---|
| High upfront device and installation costs | -2.4% | Global, stronger in price-sensitive markets | Short term (≤ 2 years) |
| Data-privacy and cybersecurity concerns | -1.8% | Europe and North America | Medium term (2–4 years) |
| Patchy battery life of wireless outdoor cameras | -1.1% | Global, harsh climate regions | Short term (≤ 2 years) |
| Emerging data-localisation mandates inflating cloud costs | -1.3% | Europe, Asia Pacific | Long term (≥ 4 years) |
| Source: Mordor Intelligence | |||
High Upfront Device and Installation Costs
Entry packages for single-family homes range from USD 500 to USD 2,000 plus monthly monitoring fees, while large multifamily retrofits can exceed USD 45,000 for full building coverage. Semiconductor shortages and shifting tariff schedules have tightened hardware supply and lifted unit prices for cameras and smart locks. Manufacturers move assembly to Vietnam and the Philippines to diversify risks, yet new trade duties on those countries limit immediate relief. Promotional pricing eases pressure during peak shopping seasons, but sustained affordability remains a hurdle in developing economies, prompting interest in device-as-a-service contracts that spread costs over time.
Data-Privacy and Cybersecurity Concerns
Smart home systems handle continuous video streams, biometric profiles, and occupancy data, raising user anxiety about unauthorised access. Academic assessments show many consumer devices still lack robust encryption or mutual authentication, exposing homeowners to potential breaches.[3]MDPI Editorial Board, “Security Challenges in IoT-enabled Smart Homes,” MDPI, mdpi.com The European Union’s GDPR and similar laws elsewhere impose heavy penalties for improper data handling, forcing providers to add local storage options and transparent consent schemes. Consumers also voice uncertainty over responsibility divisions between cloud hosts and equipment brands, underscoring the need for straightforward privacy documentation and automatic firmware updates.
*Our forecasts treat driver/restraint impacts as directional, not additive. The impact forecasts reflect baseline growth, mix effects, and variable interactions.
Smart Home Security Services Market Segment Analysis
By Product Type:
Video Surveillance Dominates Despite Access Control AccelerationVideo surveillance accounted for 45.70% of the smart home security services market in 2025, anchoring the category with networked cameras, recorders, and edge processors. Continuous price declines in 4K sensors and storage enable households to deploy multi-camera layouts once reserved for commercial sites. AI modules embedded in cameras now filter vehicles, pets, and human faces locally, curbing bandwidth use and protecting privacy. The security services market size for video surveillance equated to nearly USD 17.16 billion in 2025 and is projected to scale with double-digit gains as analytics subscriptions multiply.
Access control registers the fastest 16.34% CAGR through 2031 thanks to fingerprint, iris, and facial unlock solutions that link seamlessly with mobile credentials. Patent filings from leading handset and smart lock producers confirm efforts to blend voice, face, and touch proof points in under one second, addressing user expectations for convenience. Integrated door stations combine high-definition video and biometric readers so that authentication data enriches surveillance streams for stronger event context. As homes adopt parcel drop zones and shared entrances, combined video-access stacks should capture further share of the smart home security services market.




By Component:
Hardware Leadership Challenged by Services GrowthHardware retained 64.30% share of the smart home security services market during 2025, driven by sustained demand for cameras, sensors, and control hubs. However, recurring cloud storage and professional monitoring subscriptions are expanding at a 16.05% CAGR, signalling a gradual pivot toward service-centric revenue. The security services market size tied to services reached close to USD 12.9 billion in 2025 and is set to double by the end of the forecast window. Consumers value 24/7 experts who triage alerts and dispatch first responders, and they appreciate automatic software updates that unlock new analytics without extra hardware.
Software layers sit between hardware and services, integrating AI inference engines and mobile dashboards that unify all devices. As interoperability improves under the Matter standard, platform providers intend to upsell cross-vertical services such as energy management and elder-care monitoring. Providers that seamlessly blend hardware, software, and services under one subscription stand to widen margins and strengthen retention in the smart home security services market.
By End-Use:
Apartments Accelerate Despite Independent Home DominanceIndependent and detached residences represented 53.40% of 2025 revenue because owners can freely choose installers, brands, and monitoring models. Most new single-family builds in North America and parts of Europe already include pre-wired sensor backbones, reducing incremental upgrade cost. Still, the apartment and condominium slice is pacing at a 15.55% CAGR to 2031 as developers embed network cameras and smart locks during construction to differentiate properties and lower liability. Centralised dashboards help managers prove due diligence on safety while automated visitor access cuts staffing needs.
In dense urban markets like Singapore and Tokyo, multifamily retrofits receive municipal incentives when they tie resident camera feeds into neighbourhood command centres. Real-time leak detection and elevator monitoring extend security beyond intrusion, giving building owners tangible cost savings. These priorities will raise the apartment segment’s contribution to the security services market share by several points before decade end and expand service revenue as tenants increasingly demand bundled monitoring.
By Installation Type:
DIY Growth Challenges Professional Installation DominanceProfessional crews delivered 61.10% of installations in 2025, reflecting consumer trust in expert wiring, optimal camera placement, and warranty coverage. Complex integrations across lighting, HVAC, and solar systems often justify the added cost. The DIY trend, however, is climbing at 15.84% CAGR, powered by peel-and-stick sensors, smartphone walkthroughs, and wireless mesh connectivity that removes drilling. Entry-level kits arrive pre-paired, allowing renters to relocate devices with minimal effort. Such kits captured roughly USD 4.05 billion of the security services market size in 2025 and continue to erode the labour premium in straightforward layouts.
Hybrid models have emerged wherein homeowners tackle basic sensor placement yet hire technicians for network optimisation and advanced rules. Retailers and energy utilities now package security equipment with broadband contracts, further blurring lines. Success in the smart home security services market will hinge on flexible delivery tiers that match vastly different customer skills and budgets.
Geography Analysis
North America Smart Home Security Services Market
North America is expected to maintain its leadership in the smart home security services market, with a 40.60% share in 2025. The United States dominates regional demand thanks to mature distribution channels, bundled insurance incentives, and consumer familiarity with voice-enabled control. Canada contributes steady unit growth through suburban expansion, whereas Mexico sees rapid gains in upper-middle-income neighbourhoods where rising crime prompts first-time purchases. Ongoing partnerships between security incumbents and insurers, such as ADT’s alliance with State Farm that offers free starter kits, continue to expand the addressable base.
APAC Smart Home Security Services Market
The Asia Pacific region records the fastest growth, with a 16.38% CAGR through 2031, driven by urban migration and public investments in digital infrastructure. China mandates smart readiness in new dwellings, driving large-scale deployments that integrate residential cameras into district safety clouds. India’s Smart Cities Mission links building codes to connected security prerequisites, and local manufacturers supply cost-efficient kits tailored to regional power and network conditions. The region’s expansive electronics supply chain underpins aggressive pricing, while homegrown AI talent accelerates the localisation of analytics software.
EMEA and South America Smart Home Security Services Market
Europe follows a steady adoption path shaped by GDPR compliance and sustainability priorities. Germany, the United Kingdom, and France spearhead device-as-a-service models that offset upfront costs and guarantee data residency. Southern European nations integrate security with energy-management packages as part of building-retrofit incentives. South America and the Middle East and Africa, although smaller today, experience double-digit growth as telecom operators bundle security cameras with fibre upgrades and as Gulf megaprojects embed residential protection in master-planned cities. These emerging markets add volume and diversity to the global smart home security services market while requiring tailored solutions for variable power infrastructure and climate resilience.


Regulatory Landscape
Cybersecurity-by-design and lifecycle vulnerability management are tightening for consumer IoT devices used in smart home security services. In the European Union, Regulation (EU) 2024/2847 (Cyber Resilience Act, CRA) introduces horizontal requirements that apply to products with digital elements, including smart locks, cameras, alarm systems, and similar connected devices. It also raises the bar through stricter conformity assessment expectations for higher-risk product classes.
Implementation steps are also moving in parallel through standards and national guidance. ETSI EN 303 645 v3.1.3 remains a baseline reference for consumer IoT security requirements, while ETSI work (for example, EN 304 632 under the ETSI work program) is progressing toward harmonized standards that support CRA compliance. In Germany, BSI released TR-03173 v1.11 in January 2026, aligning conformance assessment methods with ETSI EN 303 645 and related ETSI security work. The CRA incident and actively exploited vulnerability reporting obligations start on 11 September 2026 via reporting to ENISA and national CSIRTs, pushing providers and device makers to harden reporting processes and strengthen supply-chain security controls.
Value Chain Analysis
The value chain starts with component suppliers (imaging sensors, Wi-Fi/Thread/BLE chipsets, edge AI processors, storage, and power management) and flows to device OEMs/ODMs that integrate cameras, smart locks, hubs, and sensors. Manufacturing and test are concentrated in electronics supply hubs, but tariff exposure and shifting trade policies have become a meaningful sourcing variable for smart security hardware. This is encouraging diversification of assembly footprints and more modular platform designs that can be certified and produced across regions.
Downstream, distribution spans professional installer channels, direct-to-consumer ecommerce, and retail, while recurring value increasingly attaches to software and services layers, including mobile apps, identity and access management, video analytics, cloud storage, and 24/7 monitoring and dispatch operations. Industry standardization is reshaping the integration layer: the Connectivity Standards Alliance advanced Matter across 2024-2026, including Matter 1.5 (November 2025) adding native support for cameras and closures (locks), and Matter 1.5.1 (March 2026) extending video capabilities. The Matter Compliant Platform Certification program (September 2025) also shifts leverage toward chipset, module, and platform providers that can pre-validate security and networking building blocks, reducing certification burden and accelerating time-to-market for device makers and service brands.
Competitive Landscape
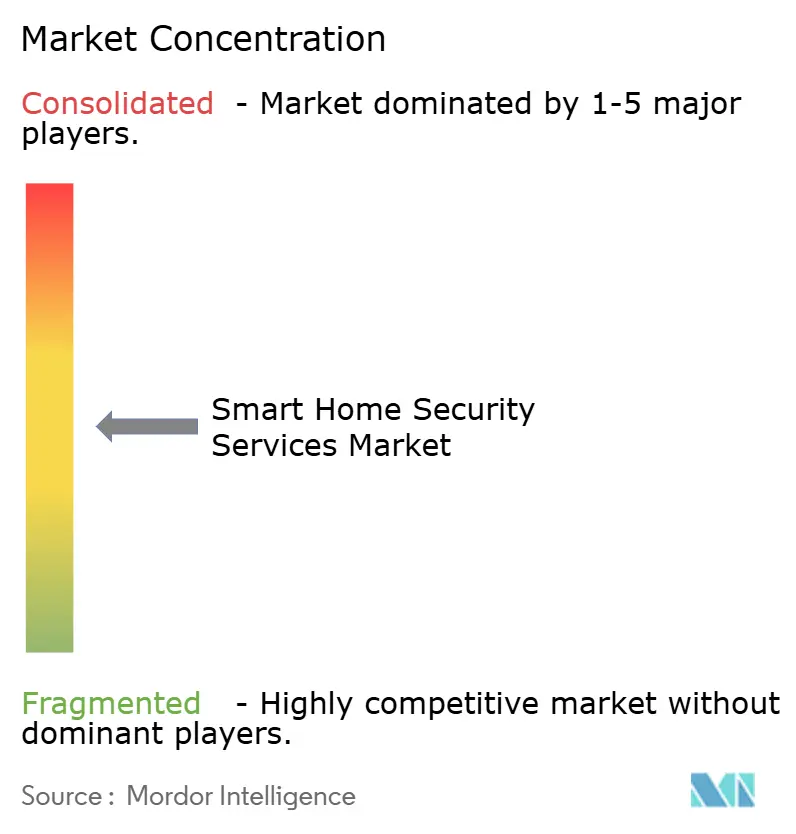
The smart home security services market presents moderate fragmentation, with incumbents, technology giants, and regional specialists jockeying for ecosystem control. ADT leverages its 6 million-plus subscriber base and deep monitoring expertise, augmenting hardware through its partnership with Google that delivered USD 22.5 million in success incentives by 2024. Amazon’s Ring capitalises on an installed base of more than 10 million video doorbells, adding AI-curated alerts that cement lock-in within the broader Alexa platform. Google synthesises Gemini AI with Nest cameras to provide cross-device context that differentiates its offers from hardware-only rivals.
Industrial conglomerates such as Honeywell reported double-digit 2025 security revenue gains by bundling access control, fire systems, and analytics under integrated building suites.[4]Honeywell Investor Relations, “Q1 2025 Earnings Presentation,” Honeywell, honeywell.com Resideo’s acquisition of Snap One deepens channel reach among professional installers and expands product breadth in networking gear. Telecom and energy utilities in North America and Europe are bundling security gear with broadband or smart-meter upgrades, leveraging customer service touchpoints to enter the market. Edge-AI start-ups focus on privacy-preserving analytics that run inside cameras, targeting households wary of cloud storage. As patents around multimodal biometrics and intelligent sensors multiply, competitive success hinges on the ability to present a unified experience that spans hardware, software, and around-the-clock service
Smart Home Security Services Industry Leaders
ADT Security Services
AT&T Inc
Comcast Corporation
Vivint, Inc.
Axis Communications
- *Disclaimer: Major Players sorted in no particular order
Smart Home Security Services Market Companies Covered in this Report
- ADT Inc.
- Amazon (Ring)
- Comcast (Xfinity Home)
- Vivint Smart Home
- SimpliSafe Inc.
- AT&T Digital Life
- Honeywell Home
- Johnson Controls (Tyco/ADT Canada)
- Google Nest
- Arlo Technologies
- Alarm.com
- Axis Communications
- Bosch Security Systems
- Samsung SmartThings
- Hikvision
- Control4 (Snap-One)
- Abode Systems
- Brinks Home Security
- Canary Connect
- August Home

Market Opportunities and Future Outlook
Interoperability is creating room for service differentiation beyond single-vendor ecosystems, especially in video and access control, where recurring revenue attaches to analytics, storage tiers, and monitoring. The Connectivity Standards Alliance expanded Matter to cover cameras and closures in Matter 1.5 (November 2025), and platform-level enablement is now visible. For example, Samsung SmartThings added Matter 1.5 support with Matter-compatible camera support in July 2026. As cameras and locks become more interoperable at the device layer, providers have clearer whitespace to compete on response workflows, insurer-integrated reporting, and multi-property account management, rather than on closed hardware compatibility.
Regulation-driven security baselines are also opening opportunities for compliance-forward offerings and managed security operations tailored to consumer IoT. Australia commenced the Cyber Security (Security Standards for Smart Devices) Rules 2025 in March 2026, and in Europe the CRA implementation steps in 2026 increase the need for lifecycle patching, vulnerability intake, and incident reporting readiness across device and cloud stacks. At the same time, privacy-preserving sensing is broadening home protection and care scenarios where cameras are undesirable. Asahi Kasei Microdevices began mass production of the AK5816AIM mmWave radar module in July 2026, supporting camera-less monitoring concepts that can be bundled into security subscriptions for occupancy detection and safety use cases.
Recent Industry Developments in Smart Home Security Services Market
- July 2026: SimpliSafe expanded its retail presence through Walmart, making its home security products available on Walmart.com and in select US stores. The move broadens reach for DIY security bundles and increases price and feature comparability at the point of purchase, pressuring providers to sharpen packaging and subscription value.
- May 2026: ADT launched ADT Blu, a DIY self-install home security system managed through the ADT+ app and sold via ADT.com and Amazon. This extends ADT further into self-install workflows while keeping an app-centric pathway to monitoring and value-added services.
- August 2024: Luminys Systems Corp., Foxlink, and MediaTek announced a strategic partnership to develop AI-powered video security solutions that pair MediaTek chipsets with Foxlink manufacturing. The collaboration highlights upstream investment in edge-AI performance and scalable production for camera-led smart home security deployments.


Smart Home Security Services Market Report Scope and Research Methodology
Market Definition and Coverage
This market covers paid security services used in residences with smart home setups, where protection is delivered through monitoring, alerting, and related service support tied to connected devices and software.
Scope exclusions: Excludes non-security smart home subscriptions (such as energy, entertainment, and general automation services) even when bundled in a single household app plan.
Segments Covered in This Report
- By Product Type
- Video Surveillance
- Security Cameras
- Monitors
- Storage Devices
- Others
- Access Control
- Facial Recognition
- Fingerprint Recognition
- Iris Recognition
- Smart Locks and Others
- Intrusion Detection and Alarms
- Video Surveillance
- By Component
- Hardware
- Software
- Services (Monitoring and Cloud)
- By End-use
- Independent / Detached Homes
- Apartments and Condominiums
- Other Residential (e.g., Assisted-living)
- By Installation Type
- Professional Installation
- Self-installation (DIY)
- By Geography
- North America
- United States
- Canada
- Mexico
- South America
- Brazil
- Rest of South America
- Europe
- Germany
- United Kingdom
- France
- Italy
- Spain
- Rest of Europe
- Asia Pacific
- China
- Japan
- India
- South Korea
- Rest of Asia Pacific
- Middle East and Africa
- Saudi Arabia
- United Arab Emirates
- South Africa
- Rest of Middle East and Africa
- North America
Data Sources, Market Sizing, and Validation
Desk Research
Desk research was used to set the market context and to build realistic input ranges before we moved into the sizing model. We referenced public sources such as the US Census Bureau housing data, US Bureau of Labor Statistics consumer spending and CPI series, FCC broadband coverage indicators, and OECD household and digital access statistics to estimate the addressable home base and connectivity readiness.
To keep assumptions grounded, we also reviewed sources such as IEA electricity and smart energy indicators (as a proxy for connected-home adoption), NIST cybersecurity guidance (to track security-driven spending signals), and peer reviewed articles on residential IoT security and monitoring behavior. Company filings, earnings call transcripts, investor presentations, and reputable press were used to cross-check how services are packaged and how pricing is shifting toward subscriptions. Where needed, a paid subscription for company financials and news intelligence, plus a patent database, helped validate supplier direction and the pace of feature upgrades. This list is not exhaustive, and many other public sources were checked for data collection, validation, and clarification.
Primary Interviews and Surveys
Primary work focused on interviews and short surveys with security service providers, installers, channel partners, and housing ecosystem participants, followed by targeted re-contacts when numbers did not line up. Since this is a global market, inputs were checked across APAC, EMEA, and the Americas so pricing, monitoring attach rates, and the DIY versus professional installation split could be validated consistently.
Distribution of primary research fieldwork respondents
| Company type | Respondent position | Region |
|---|---|---|
| Top tier: 39% | CXOs: 19% | APAC: 44% |
| Mid tier: 42% | Functional/Unit leaders: 25% | EMEA: 29% |
| Smaller Players: 19% | Managers: 56% | Americas: 27% |
Market-Sizing & Forecasting
For sizing, we use a top-down demand pool build where household counts, broadband penetration, and smart security adoption indicators are combined to reconstruct the paying service base by region. We then translate that base into revenue using typical subscription and service price bands. To keep the model practical, it is built around inputs that can be explained and defended, then stress-tested before the final totals are set.
Key inputs included (illustrative) the share of connected households, the split between professional installation and self-installation, monitoring and cloud storage attachment rates, average monthly subscription levels, and the mix shift across video surveillance versus access control service needs. Where country data was thin, regional averages were used first, then adjusted after interviews highlighted differences in housing types, consumer willingness to pay, and security incident sensitivity. Results were corroborated with selective bottom-up approximations, such as sampled provider price sheets, channel checks on install fees, and sanity checks using publicly discussed subscriber metrics. Those checks are then used to tune adoption and ASP ranges.
Forecasting relied on scenario analysis supported by a light multivariate regression on household connectivity and smart device adoption indicators, followed by expert-based adjustments for pricing progression and service bundling. Because service revenue can move quickly with promotions, we tested conservative and aggressive cases, so the final forecast stays within a band that industry participants recognize.
Data Validation & Update Cycle
Validation is done through multiple passes that compare model outputs against independent signals, then narrow variance before sign-off. We check for anomalies such as sudden jumps in adoption, unrealistic regional ARPU differences, or service growth that conflicts with housing and broadband trends, and we review and correct outliers.
When gaps remain, respondents are re-contacted to confirm whether the issue is scope, timing, or pricing, and the assumptions are updated in the model log so the chain of logic is easy to follow. Reports are refreshed annually, with interim updates when material events occur, and a final pre-delivery review is completed so clients receive the most current view available at that point in time.
Mordor Intelligence's Smart Homes Security Services Market Size Versus Other Published Estimates
Published market values for smart home security services can look far apart because the scope is not always consistent, and the same terms are sometimes applied to different revenue pools. Differences also show up when firms use different timing for currency conversion, different base years, or rely on aggressive adoption curves without re-checking with installers and service operators.
Hardware-only device revenue and one-time equipment sales sit outside Mordor Intelligence's scope here, which is why some broader smart home security figures will not match even if the title sounds similar. A second gap driver is how recurring revenue is treated, since some sources blend monitoring, cloud storage, and maintenance with broader home services, while others assume flat monthly pricing instead of tracking premium feature upgrades and bundling. Finally, update cadence matters because this market shifts with subscription promotions and DIY adoption, which can change the mix within a year.
Benchmark comparison
| Source | Market Size | Gaps in Research Methodology |
|---|---|---|
| Mordor Intelligence | USD 37.54 B (2025) | |
| Industry Publisher A | USD 15.30 B (2025) | Uses a narrower reading of services and appears to undercount bundled monitoring and cloud-related recurring fees that often attach to video surveillance and access control ecosystems. |
| Research Portal B | USD 39.00 B (2025) | Keeps the label as services, but the growth path looks more conservative, which can happen when adoption and price progression are not adjusted for regional connectivity and the shift toward higher priced subscription tiers. |
The table shows that the spread is mainly explained by what gets counted as service revenue and how recurring fees are normalized across regions and housing types. By keeping the service definition tight, then cross-checking adoption and pricing inputs with real channel feedback, the final number stays traceable to clear drivers that can be revisited as the market evolves.


Key Questions Answered in the Report
What is the current size of the smart home security services market?
The market produced USD 43.21 billion in 2026 and is set to grow to USD 87.29 billion by 2031.
Which product segment leads the smart home security services market?
Video surveillance leads with 45.70% revenue share as of 2025, owing to falling camera prices and embedded analytics.
How quickly is the Asia Pacific region growing in smart-home security?
Asia Pacific is expanding at a 16.38% CAGR through 2031, making it the fastest-growing regional market.
Why are insurance discounts important for market adoption?
Premium reductions of 2%–20% offset device costs and encourage homeowners to install verified systems, boosting adoption and data sharing.
What installation model is gaining traction against professional services?
DIY installations are climbing at a 15.84% CAGR because of user-friendly wireless kits and guided mobile apps.
How does AI improve smart-home security performance?
AI-based analytics reduce false alarms by distinguishing routine activities from potential threats and allow cameras to learn household patterns for personalised protection.
Page last updated on:


 Your data is secure and never sold or shared.


