Red Sandalwood Market Size and Share
Red Sandalwood Market Analysis by Mordor Intelligence
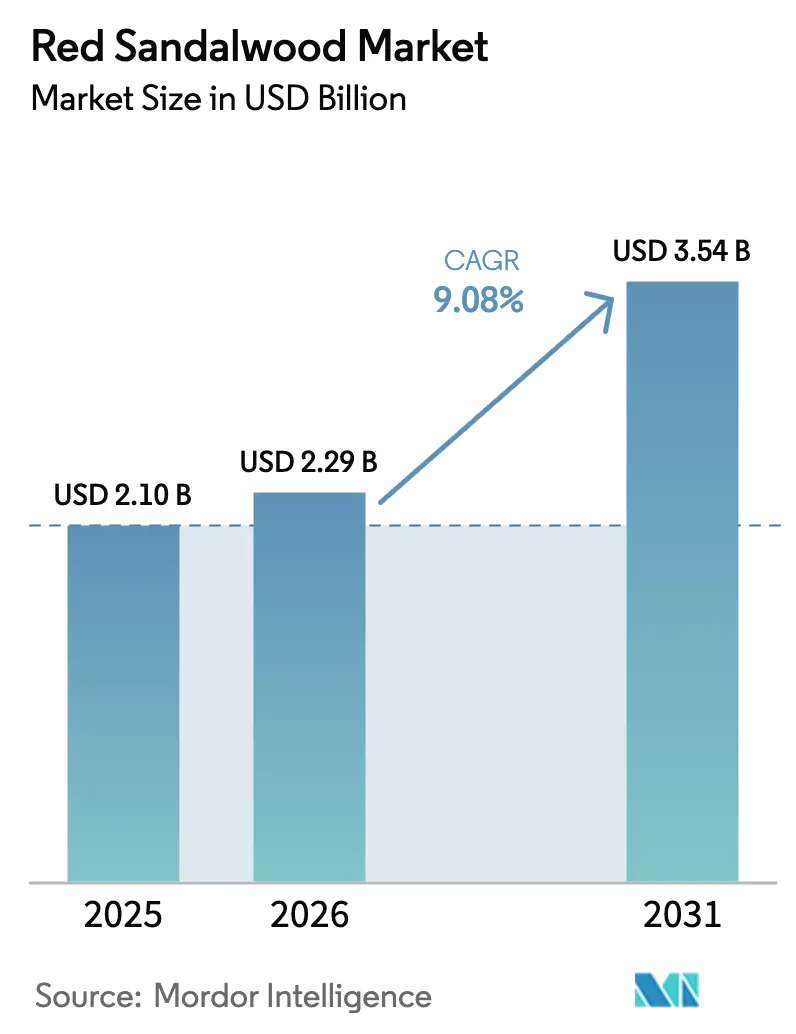
The red sandalwood market size was valued at USD 2.1 billion in 2025 and estimated to grow from USD 2.29 billion in 2026 to reach USD 3.54 billion by 2031, at a CAGR of 9.08% during the forecast period (2026-2031). Persistent Chinese demand for premium musical-instrument backs, tightening Convention on International Trade in Endangered Species of Wild Fauna and Flora (CITES) permit regimes, and the emergence of privately financed agroforestry clusters outside India shape the dual-speed expansion of the red sandalwood cultivation and marketing market. Investors are also reacting to fresh legal supply unlocked through Indian state forest-lease auctions and blockchain-enabled traceability premiums that push fully certified logs 30% to 45% above uncertified equivalents in Chinese veneer channels. Africa is gaining attention, as Ethiopia and Kenya are scaling smallholder models to close a 4.4 million cubic-meter industrial roundwood gap and to serve pharmaceutical buyers seeking verified botanical pigments.[1]Source: International Union for Conservation of Nature, “Exploring the Future of Vegetable Oils: Oil Crop Implications – Fats, Forests, Forecasts, and Futures,” iucn.org Pharmaceutical and cosmetic manufacturers now list Pterocarpus santalinus extracts under U.S. Food and Drug Administration (FDA) botanical guidelines, which further broadens revenue streams for growers able to meet forensic-grade provenance requirements.
Key Report Takeaways
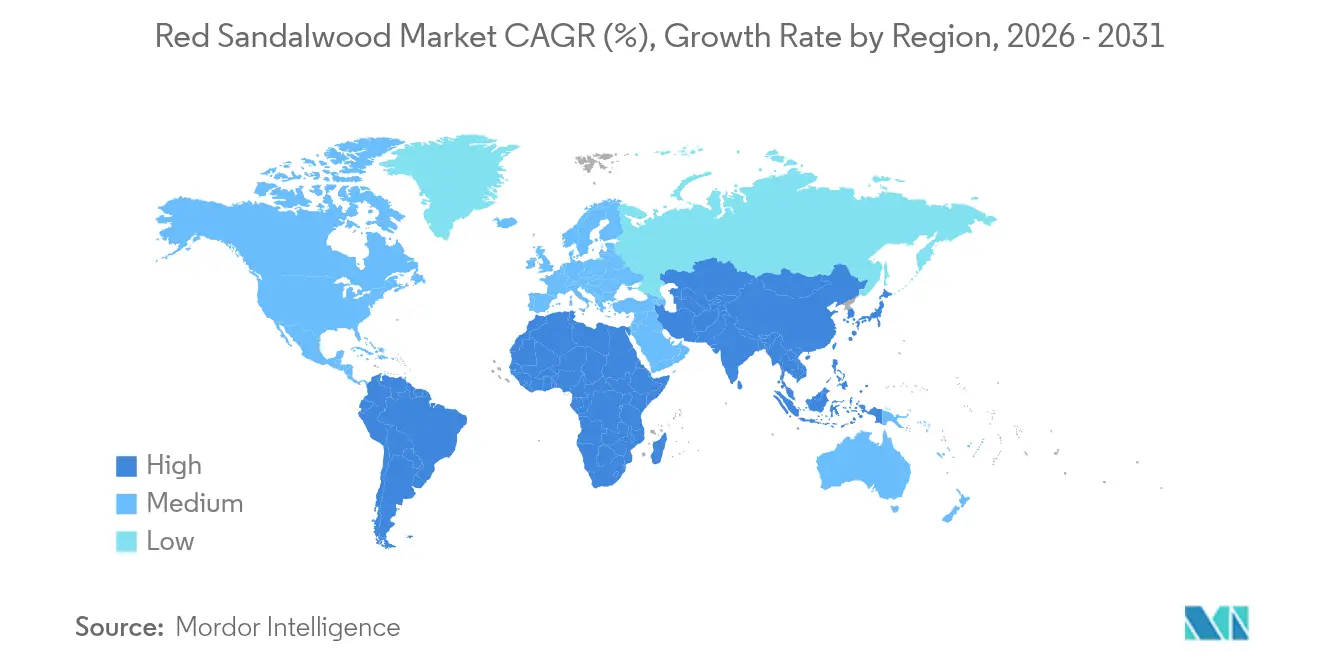
- By geography, Asia-Pacific led with 62.40% of the red sandalwood market share in 2025; Africa is forecast to grow at an 11.32% CAGR through 2031.
Note: Market size and forecast figures in this report are generated using Mordor Intelligence’s proprietary estimation framework, updated with the latest available data and insights as of 2026.
Global Red Sandalwood Market Trends and Insights
Drivers Impact Analysis*
| Driver | (~) % Impact on CAGR Forecast | Geographic Relevance | Impact Timeline |
|---|---|---|---|
| Expiring forest-lease auctions unlocking fresh supply | +1.8% | India (Andhra Pradesh, Karnataka, Odisha, and Tamil Nadu) | Medium term (2–4 years) |
| Privately financed agroforestry clusters in non-traditional regions | +1.2% | Ethiopia, Kenya, Brazil, Saudi Arabia, and United Arab Emirates | Long term (≥ 4 years) |
| Pharmaceutical shift toward natural colorants for anti-inflammatory active pharmaceutical ingredients (APIs) | +1.5% | North America, Europe, and Asia-Pacific | Medium term (2–4 years) |
| Cosmetic majors preferring FDA-cleared botanical International Nomenclature of Cosmetic Ingredients (INCI) names | +1.3% | North America, Europe, and Asia-Pacific | Short term (≤ 2 years) |
| Surge in Chinese musical-instrument demand for premium redwood backs | +2.1% | China, Japan, South Korea, and spillover to North America | Short term (≤ 2 years) |
| Blockchain-enabled traceability premiums for Forest Stewardship Council (FSC)-certified logs | +1.6% | European Union (EU), China, Japan, and United States | Medium term (2–4 years) |
| Source: Mordor Intelligence | |||
Expiring Forest-Lease Auctions Unlocking Fresh Supply
Indian state governments are releasing decades of confiscated stock through transparent e-auctions. Odisha’s upcoming sale in April 2025 will offer a significant quantity following previous disposals, signaling a shift from prohibition to controlled monetization. Andhra Pradesh is advocating a single-window system to cut permit delays. The sudden influx of lawful material tempers black-market prices yet imposes rigorous traceability standards demanded by pharmaceutical and cosmetic buyers. Auction proceeds support state forestry budgets, but inconsistent inter-state procedures still elongate export timelines, prompting calls for national harmonization.
Privately Financed Agroforestry Clusters in Non-Traditional Regions
Ethiopia and Kenya use public-private partnerships to integrate red sandalwood into mixed farms that yield coffee and maize during the long tree rotation period. Lower land costs, favorable climate bands, and patient family-office capital underpin these ventures. Brazil, Saudi Arabia, and the United Arab Emirates are piloting small plots to test growth in semi-arid conditions. Investors target significant yields of heartwood per tree, which would support a favorable internal rate of return if auction prices remain above a certain threshold. Biological variability and limited silvicultural data remain key uncertainties.
Pharmaceutical Shift Toward Natural Colorants for Anti-Inflammatory APIs
Clean-label pressure and safety concerns around azo dyes drive drug makers to swap synthetic pigments for plant-derived alternatives. Santalin and pterocarpine from Pterocarpus santalinus exhibit anti-inflammatory and antioxidant properties, as documented in peer-reviewed studies. FDA botanical guidance and INCI listings simplify regulatory pathways, positioning certified plantation material for uptake in topical creams and oral supplements. Buyers pay significant premiums for contaminant-free extract but require verifiable geographic origin, stimulating demand for blockchain-tagged supply.
Cosmetic Majors Preferring FDA-Cleared Botanical INCI Names
L’Oréal, Estée Lauder, and Shiseido increasingly specify INCI-listed botanical ingredients. Retail prices for cosmetic-grade red sandalwood powder have shown significant value in recent years. Bulk lots are often transacted at discounted rates, highlighting the benefits of purchasing at scale. Brands audit suppliers under the European Union (EU) Deforestation Regulation and California Transparency in Supply Chains Act, meaning only growers with Forest Stewardship Council (FSA) certificates and digital provenance gain shelf access. The bifurcation favors vertically integrated estates capable of ISO 22716 good manufacturing practice compliance.
Restraints Impact Analysis*
| Restraint | (~) % Impact on CAGR Forecast | Geographic Relevance | Impact Timeline |
|---|---|---|---|
| CITES Appendix II permit bottlenecks | −1.4% | India, China, Ethiopia, and Kenya | Short term (≤ 2 years) |
| Ten- to fifteen-year biological gestation hindering internal rates of return (IRR) | −1.1% | Global plantations, notably Africa and South America | Long term (≥ 4 years) |
| Synthetic red dye competition priced below USD 12 per kilogram | −0.9% | North America and Europe | Medium term (2–4 years) |
| Cross-border timber smuggling crackdowns elevating compliance costs | −1.2% | India, China, Vietnam, Singapore, and Kenya | Short term (≤ 2 years) |
| Source: Mordor Intelligence | |||
CITES Appendix II Permit Bottlenecks
Exporters must secure non-detriment findings and legal-acquisition proofs, adding 35% to raw-material costs and delaying shipments 3–6 months[2]Source: United Nations Office on Drugs and Crime, “Wildlife Crime Report 2024,” unodc.org. India’s removal from the CITES Review of Significant Trade eased some hurdles, yet state-level discretion still causes bottlenecks. African range countries were placed under intensified scrutiny in May 2025. Pharmaceutical buyers gravitate toward plantation sources with pre-approved documents, shrinking demand for wild-harvest lots.
Ten- to Fifteen-Year Biological Gestation Hindering Internal Rates of Return (IRR)
Heartwood formation can take several years, with a significant percentage of trees failing to achieve commercial density. Up-front cultivation costs are substantial, which can postpone cash flow for growers. Ethiopian smallholders mitigate risk by intercropping coffee and livestock, but institutional capital often hesitates at long investment horizons. Tissue-culture acceleration techniques remain experimental, leaving biological variability as a core constraint.
*Our forecasts treat driver/restraint impacts as directional, not additive. The impact forecasts reflect baseline growth, mix effects, and variable interactions.
Geography Analysis
The red sandalwood market size for the Asia-Pacific is 62.40% of the market share. Asia-Pacific will retain leadership because natural Pterocarpus santalinus stands are endemic to India, and demand remains concentrated in China’s luxury segment. India’s Andhra Pradesh and Karnataka now coordinate seized-stock auctions to inject lawful supply while maintaining oversight. Chinese buyers absorb this influx even at elevated prices, motivated by furniture resale values that outpace inflation. Japan and South Korea continue to prioritize provenance, supporting premium prices for instrument-grade billets.
Africa is projected to record the fastest 11.32% CAGR to 2031. African supply accelerates on the back of public-private ventures that embed red sandalwood into diversified farms. The region benefits from lower land costs and proximity to Middle Eastern buyers, yet it faces a learning curve around silviculture and forensic tracking. East African states entered the CITES Review of Significant Trade in 2025, which will tighten permit issuance but should lift credibility for compliant exporters. As plantations mature, Africa’s cost advantage could narrow the pricing gap with Indian logs.
Europe and North America collectively account for roughly 18.30% of global uptake, centered on pharmaceutical and cosmetic extracts sold under Food and Drug Administration (FDA) and European Union Cosmetics Regulation 1223/2009 frameworks. The coming EU Deforestation Regulation raises documentation standards, so only operators with blockchain and isotope validation will gain access. South America and the Middle East remain experimental regions but attract patient capital searching for diversifying forestry assets.


Recent Industry Developments
- November 2025: The Andhra Pradesh government is set to launch a Kagar-style operation to curb sandalwood smuggling. This initiative aims to strengthen enforcement so that “no one will dare touch a tree,” ensuring better protection of forest resources.
- September 2025: The Kerala Cabinet has approved a bill to ease restrictions on the cutting and sale of sandalwood trees. The move aims to encourage farmers and private landowners to cultivate sandalwood by simplifying regulatory hurdles. This reform is expected to boost local livelihoods and reduce dependence on illegal sandalwood trade.


Global Red Sandalwood Market Report Scope
Red Sandalwood or Red Sanders (Botanical name: Pterocarpus santalinus, Locally called: Yerra Chandanam (Telugu), Chenchandanam (Tamil), Rakta Chandana (Hindi), Kempu Chandana (Kannada), and Rakto Chandon (Bengali)) thrive predominantly in India’s Eastern Ghats. The report is segmented based on Geography (North America, Europe, Asia-Pacific, and Middle East and Africa). The market numbers will be provided in terms of Volume (Metric tons) for the above mentioned segment.
| North America | United States |
| Canada | |
| Rest of North America | |
| South America | Brazil |
| Rest of South America | |
| Europe | Germany |
| France | |
| Italy | |
| United Kingdom | |
| Russia | |
| Rest of Europe | |
| Asia-Pacific | India |
| China | |
| Japan | |
| Australia | |
| Rest of Asia-Pacific | |
| Middle East | Saudi Arabia |
| United Arab Emirates | |
| Rest of Middle East | |
| Africa | Kenya |
| Ethiopia | |
| Rest of Africa |
| By Geography (Production Analysis (Volume), Consumption Analysis (Volume and Value), Import Analysis (Volume and Value), Export Analysis (Volume and Value), and Price Trend Analysis) | North America | United States |
| Canada | ||
| Rest of North America | ||
| South America | Brazil | |
| Rest of South America | ||
| Europe | Germany | |
| France | ||
| Italy | ||
| United Kingdom | ||
| Russia | ||
| Rest of Europe | ||
| Asia-Pacific | India | |
| China | ||
| Japan | ||
| Australia | ||
| Rest of Asia-Pacific | ||
| Middle East | Saudi Arabia | |
| United Arab Emirates | ||
| Rest of Middle East | ||
| Africa | Kenya | |
| Ethiopia | ||
| Rest of Africa | ||


Key Questions Answered in the Report
What is the current value of the red sandalwood market?
The red sandalwood market size stands at USD 2.29 billion in 2026 and is projected to grow to USD 3.54 billion by 2031.
Which region is the largest consumer of red sandalwood?
Asia-Pacific accounts for 62.40% of global consumption, driven by India's endemic resource and China's furniture and musical-instrument demand.
Why is Africa considered the fastest-growing geography?
Ethiopia and Kenya are scaling certified smallholder plantations that position Africa to grow at an 11.32% CAGR through 2031.
How does the EU Deforestation Regulation affect exporters?
Beginning in late 2025, exporters must provide geolocation and traceability proof, favoring suppliers that use blockchain platforms and FSC certification.
Page last updated on:


