Turmeric Market Size and Share
Turmeric Market Analysis by Mordor Intelligence
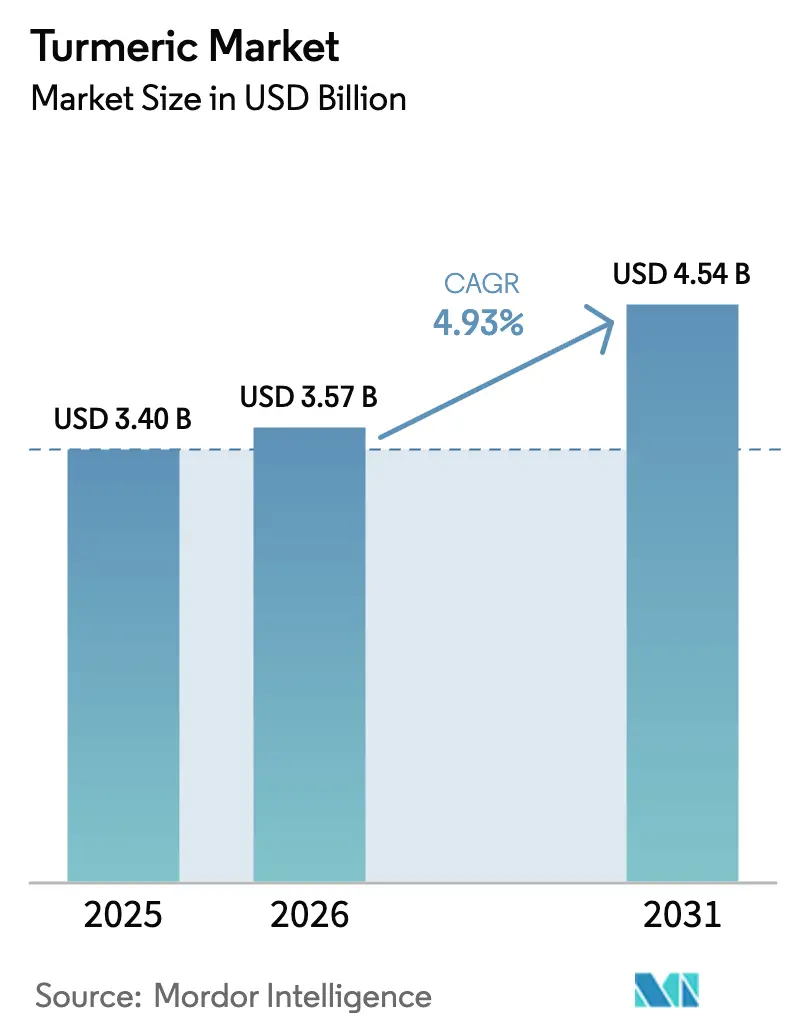
turmeric market size in 2026 is estimated at USD 3.57 billion, growing from 2025 value of USD 3.4 billion with 2031 projections showing USD 4.54 billion, growing at 4.93% CAGR over 2026-2031. The market growth is supported by Asia-Pacific's extensive cultivation infrastructure, North America's emphasis on premium organic turmeric, and Europe's stringent residue regulations that ensure traceable supply chains. Government initiatives continue to enhance production efficiency, while the increasing adoption of curcumin in nutraceuticals and natural colorants drives market expansion. The integration of blockchain technology for supply chain verification, combined with premium pricing for certified sustainable products, is compelling exporters to enhance their logistics and agricultural practices. Market competition continues to intensify as suppliers strive to comply with pesticide regulations and maintain quality standards for pharmaceutical and textile applications.
Key Report Takeaways
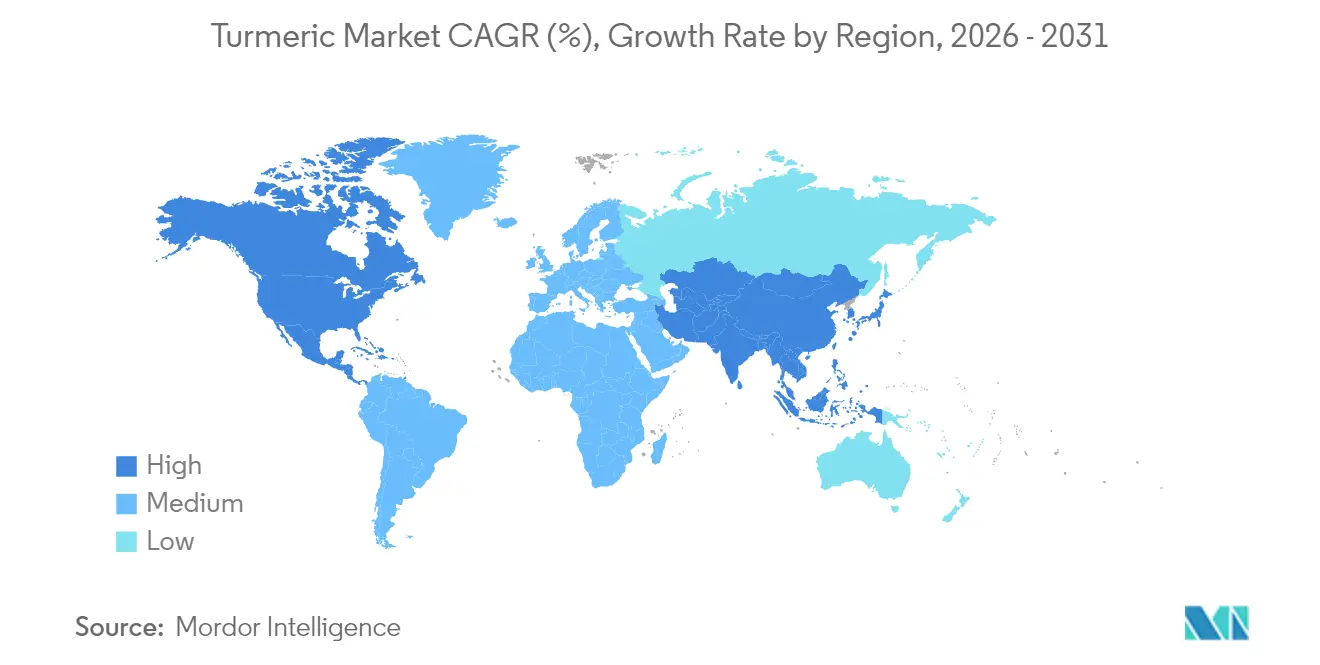
- By geography, Asia-Pacific dominated the turmeric market with an 81.50% share in 2025. North America exhibited the highest growth rate, with a CAGR of 5.42% projected through 2031.
Note: Market size and forecast figures in this report are generated using Mordor Intelligence’s proprietary estimation framework, updated with the latest available data and insights as of 2026.
Global Turmeric Market Trends and Insights
Drivers Impact Analysis*
| Driver | (~) % Impact on CAGR Forecast | Geographic Relevance | Impact Timeline |
|---|---|---|---|
| Rising global demand for natural functional ingredients | +1.2% | Global, early gains in North America, and Europe | Medium term (2-4 years) |
| Expanding curcumin use in nutraceuticals and pharma | +0.9% | North America and Europe core, spill-over to Asia-Pacific | Long term (≥4 years) |
| Government pushes to boost production and exports | +0.7% | India, Bangladesh, Thailand, and Vietnam | Short term (≤2 years) |
| Premiumization of organic and sustainably certified rhizomes | +0.6% | North America, Europe, and Australia | Medium term (2-4 years) |
| Blockchain-based farm-to-fork traceability premiums | +0.4% | Global premium markets, early adoption in Europe | Long term (≥4 years) |
| Emerging demand from natural textile dyeing industry | +0.3% | Europe and North America fashion hubs | Long term (≥4 years) |
| Source: Mordor Intelligence | |||
Rising Global Demand for Natural Functional Ingredients
Post-pandemic consumer demand for clean-label foods led to a 21% increase in turmeric-containing product launches in 2024, according to American International Foods. Curcumin's FDA GRAS status enables its use as both a colorant (E100) and an immunity-enhancing ingredient in dairy products.[1] United States FDA, “GRAS notices for curcumin,” fda.govEuropean dairy manufacturers are incorporating turmeric in yogurt and cheese formulations to address consumer wellness preferences. Research from Texas A&M University demonstrates curcumin's effectiveness against antibiotic-resistant bacteria, supporting its application in natural food preservation. These developments indicate favorable growth prospects for raw turmeric in functional food applications.
Expanding Curcumin Use in Nutraceuticals and Pharma
Drug developers are conducting clinical trials of nanocurcumin for myocardial infarction therapy, while Cellavent's fermented turmeric platform enhances postbiotic content in sports recovery products. Curcumagalactomannoside formulations increase bioavailability, prompting supplement manufacturers to focus on science-backed dosing. The growth in United States curcumin supplement sales indicates sustained market demand. Premium distribution channels in North America and Europe maintain higher prices, which contribute to the raw turmeric market revenues.
Government Pushes to Boost Production and Exports
India established its National Turmeric Board in January 2025 with the objective to increase production to 2 million tons in five years through farmer assistance programs, quality testing laboratories, and export initiatives. The Indian Institute of Spices Research developed the IISR Surya turmeric variety, which increased yields by 30% and met the color requirements of the masala industry. Fiji's agriculture ministry recorded a 118% increase in export value during 2020 following the implementation of targeted extension services.[2]Fiji Ministry of Agriculture, “Taskforce Visits Reveal Export Surge,” agriculture.gov.fj These government initiatives support production growth and market stability in the raw turmeric segment.
Premiumization of Organic and Sustainably Certified Rhizomes
The Union for Ethical BioTrade certification and similar programs promote biodiversity action plans, which encourage retailers to stock traceable rhizomes. In Florida, domestically grown organic turmeric commands USD 2-4 per pound wholesale, significantly higher than imported varieties. Research indicates that consumers demonstrate increased willingness to pay for products with verified origins and sustainable farming practices. European and North American sustainable fashion brands incorporate turmeric dyes, allowing growers to expand beyond food markets. These factors contribute to higher average selling prices in the raw turmeric market.
Restraints Impact Analysis*
| Restraint | (~) % Impact on CAGR Forecast | Geographic Relevance | Impact Timeline |
|---|---|---|---|
| Monsoon-linked price volatility | -1.1% | India, Bangladesh, and Thailand | Short term (≤2 years) |
| Stringent pesticide-residue compliance barriers | -0.8% | Global exports, especially Europe, United States, and United Kingdom | Medium term (2-4 years) |
| Soil fatigue and disease outbreaks in intensive clusters | -0.6% | India, China, and Southeast Asia | Long term (≥4 years) |
| Competition from lab-fermented synthetic curcumin | -0.4% | North America and Europe pharmaceutical arenas | Long term (≥4 years) |
| Source: Mordor Intelligence | |||
Monsoon-Linked Price Volatility
Erratic rainfall led to 70-80% fluctuations in spot prices during July 2023, reflecting India's 80% share of global turmeric production. Farmers experienced increased input costs due to fertilizer inflation, while traders faced hedging challenges due to unreliable weather forecasts. Supply disruptions affected processors, compelling them to maintain higher inventory levels. The resulting price inflation impacted packaged food brands, potentially shifting demand toward lower-cost spices. This price volatility reduced investment confidence in the raw turmeric market during brief trading periods.
Stringent Pesticide-Residue Compliance Barriers
European authorities identified 248 pesticide-related issues in spice imports during 2023, with ethylene oxide accounting for 25% of total detections.[3]European Commission, “RASFF Annual Report 2023,” ec.europa.eu In 2024, the United Kingdom implemented stricter inspection protocols for Indian turmeric imports following the discovery of carcinogenic substances in shipments. The Food Safety and Standards Authority of India (FSSAI) increased domestic Maximum Residue Limits (MRLs) to 0.1 mg/kg, creating a significant disparity with European Union standards of 0.01 mg/kg and increasing the risk of shipment rejections. To maintain market access, exporters need to establish residue testing laboratories and enhance farmer training programs. Non-compliance results in shipment destruction or re-exportation, impacting the raw turmeric market.
*Our forecasts treat driver/restraint impacts as directional, not additive. The impact forecasts reflect baseline growth, mix effects, and variable interactions.
Geography Analysis
Asia-Pacific held 81.50% of the turmeric market share in 2025. India's five-year production expansion plan focuses on high-yield varieties, drip irrigation, and mechanized cleaning units. Bangladesh, Thailand, Vietnam, and Indonesia are increasing cultivation areas due to favorable climate conditions and government support. While China maintains significant production volumes, leaf spot disease outbreaks affect export quality, creating opportunities for other regional suppliers. Processors in the region are adopting steam sterilization methods to meet European residue requirements and maintain access to premium markets.
North America exhibits the highest regional growth rate at 5.42% CAGR through 2031. U.S. turmeric imports increased from USD 14 million in 2013 to USD 51 million in 2023, with India supplying 70%. Florida and Georgia's domestic production is reducing import dependency, supported by USDA grants and farm-gate prices ranging from USD 2-4 per pound. Local producers market their turmeric as fresh and ethically produced for natural food retailers. The Canadian Food Inspection Agency's annual 10,000-sample residue testing program influences import practices, prompting processors to implement pre-market testing and cleaning procedures.
Europe shows increasing demand for organic and traceable turmeric supplies. The Netherlands reported turmeric exports of USD 14.37 million in 2024, functioning as a key distribution hub despite limited domestic production.The region maintains strict pesticide residue limits of 0.01 mg/kg, necessitating third-party laboratory verification in supply chains. Germany and France lead European consumption growth, while the United Kingdom implements stricter import controls following carcinogen-related incidents. The fashion industry's demand for turmeric-based dyes creates additional market opportunities, allowing suppliers to expand beyond food applications and capture specialized market segments.


Recent Industry Developments
- January 2025: The Union Ministry inaugurated India’s National Turmeric Board, setting a target of 2 million metric tons of production within five years.
- August 2024: The Turmeric Co. deployed a science-based product strategy to rival leading sports nutrition brands.
- April 2024: Ducol Organics and Colours Limited began commercial operations at its new Mahad, Maharashtra plant to expand turmeric-derived pigment capacity.


Research Methodology Framework and Report Scope
Market Definitions and Key Coverage
According to Mordor Intelligence, our study defines the global turmeric market as the total farm-gate and wholesale value, and the corresponding metric-ton volume, of raw rhizome and processed forms, including powder, oil, and oleoresin, supplied to food, beverage, cosmetic, household, and light industrial channels in a calendar year.
Scope exclusion: The analysis leaves out chemically synthesized curcumin isolates and finished dietary supplement capsules or tablets.
Segmentation Overview
- By Geography (Production Analysis (Volume), Consumption Analysis (Volume and Value), Import Analysis (Volume and Value), Export Analysis (Volume and Value), and Price Trend Analysis)
- North America
- United States
- Canada
- Europe
- Spain
- United Kingdom
- France
- Germany
- Netherlands
- Russia
- Asia-Pacific
- China
- India
- Japan
- Australia
- Bangladesh
- Thailand
- Vietnam
- Indonesia
- South America
- Brazil
- Peru
- Middle East
- Turkey
- United Arab Emirates
- Africa
- South Africa
- Nigeria
- North America
Detailed Research Methodology and Data Validation
Primary Research
Structured interviews with growers, traders, bulk processors, food formulators, and nutraceutical buyers in India, the United States, Germany, and Nigeria helped clarify yield swings, contract prices, organic premia, and demand pivots that are poorly documented in public records. Follow-up surveys with logistics agents and spice-blend manufacturers allowed Mordor analysts to fine-tune trade flow assumptions and cross-check self-reported volumes.
Desk Research
Our analysts first assembled multi-year output, acreage, yield, and export-price series from tier-1 sources such as FAOSTAT, the Spices Board India crop bulletins, ITC Trade Map customs data, Eurostat Comext, and USDA FAS country notes. These datasets anchor supply, trade, and pricing baselines across regions. Company 10-Ks, investor presentations, respected news reports, Codex residue limits, and paid snapshots from D&B Hoovers then enriched cost spreads, channel mix, and processor margins. The sources named are illustrative and not exhaustive; dozens of additional public and fee-based references supported data collection and validation.
Market-Sizing & Forecasting
We reconstruct global demand through a top-down production and trade build, which is subsequently cross-checked with bottom-up processor roll-ups and sampled average selling price by form. Key inputs include planted acreage trends, average field yield, farm-gate and FOB prices, organic share, functional-food product launch counts, and tariff shifts. Forecasts draw on multivariate regression with scenario overlays for monsoon variability and health and wellness spending indices. Where processor data are missing, gap filling relies on regional channel feedback plus price-volume elasticity benchmarks agreed during primary research.
Data Validation & Update Cycle
Model outputs pass variance checks against independent trade tallies and wholesale price series, followed by multi-analyst review. Reports refresh annually, with interim updates triggered by material events such as major crop failures or new residue limits. A final pre-publication sweep ensures clients receive the most current view.
Why Mordor's Turmeric Baseline Earns Decision-Maker Confidence
Published figures often diverge because firms pick different product boundaries, price anchors, and refresh cadences. Our disciplined scope, dual-approach modeling, and yearly field checks narrow those gaps for executives who need dependable numbers.
Key gap drivers include inconsistent inclusion of industrial uses, varying treatment of supplement sales, and price averaging methods that overlook wholesale to retail spreads. Mordor's model adjusts each lever transparently and revisits it every year, which lifts comparability across regions and over time.
Benchmark comparison
| Market Size | Anonymized source | Primary gap driver |
|---|---|---|
| USD 3.40 B (2025) | Mordor Intelligence | - |
| USD 3.43 B (2024) | Global Consultancy A | Omits industrial non-culinary volumes and extends growth through simple linear interpolation without trade validation |
| USD 4.77 B (2023) | Trade Journal B | Combines turmeric supplements and oleoresins under one heading and uses a single averaged price assumption |
| USD 5.86 B (2024) | Tech Insights C | Builds estimate from retail shelf scans only and applies a uniform CAGR across all regions |
In summary, cross-firm figures vary mainly because of scope creep, single-source pricing, or sparse refresh cycles. Mordor's balanced, variable-rich approach delivers a transparent baseline that can be traced back to clear data points and repeatable steps, giving stakeholders a firm foundation for planning.


Key Questions Answered in the Report
What is the current value of the turmeric market?
The turmeric market is valued at USD 3.57 billion in 2026 and is projected to rise to USD 4.54 billion by 2031.
Which region leads global turmeric production?
Asia-Pacific, led by India, accounts for 81.50% of supply and holds the largest turmeric market share.
Why are organic turmeric prices higher?
Certified organic rhizomes command up to 45% premiums because consumers value pesticide-free, traceable produce and because certification costs raise farm expenditure.
What drives turmeric demand in nutraceuticals?
Curcumin’s anti-inflammatory and antioxidant properties, combined with improved bioavailability technologies, have lifted United States supplement sales to USD 151.7 million.
How does blockchain influence the raw turmeric market?
Blockchain systems create transparent farm-to-fork records, boosting buyer confidence, reducing rejection risks, and enabling suppliers to earn traceability premiums.
What are the main restraints to market growth?
Monsoon-linked price swings, stringent pesticide rules in Europe and the United States, soil-borne diseases, and competition from lab-fermented curcumin can temper market expansion.
Page last updated on:


