
E-Reader Market Size and Share
Market Overview
| Study Period | 2020 - 2031 |
|---|---|
| Market Size (2026) | USD 8.83 Billion |
| Market Size (2031) | USD 11.94 Billion |
| Growth Rate (2026 - 2031) | 6.24 % |
| Fastest Growing Market | Asia Pacific |
| Largest Market | North America |
| Market Concentration | High |
Major Players *Disclaimer: Major Players sorted in no particular order Image © Mordor Intelligence. Reuse requires attribution under CC BY 4.0. | |
E-Reader Market Analysis by Mordor Intelligence
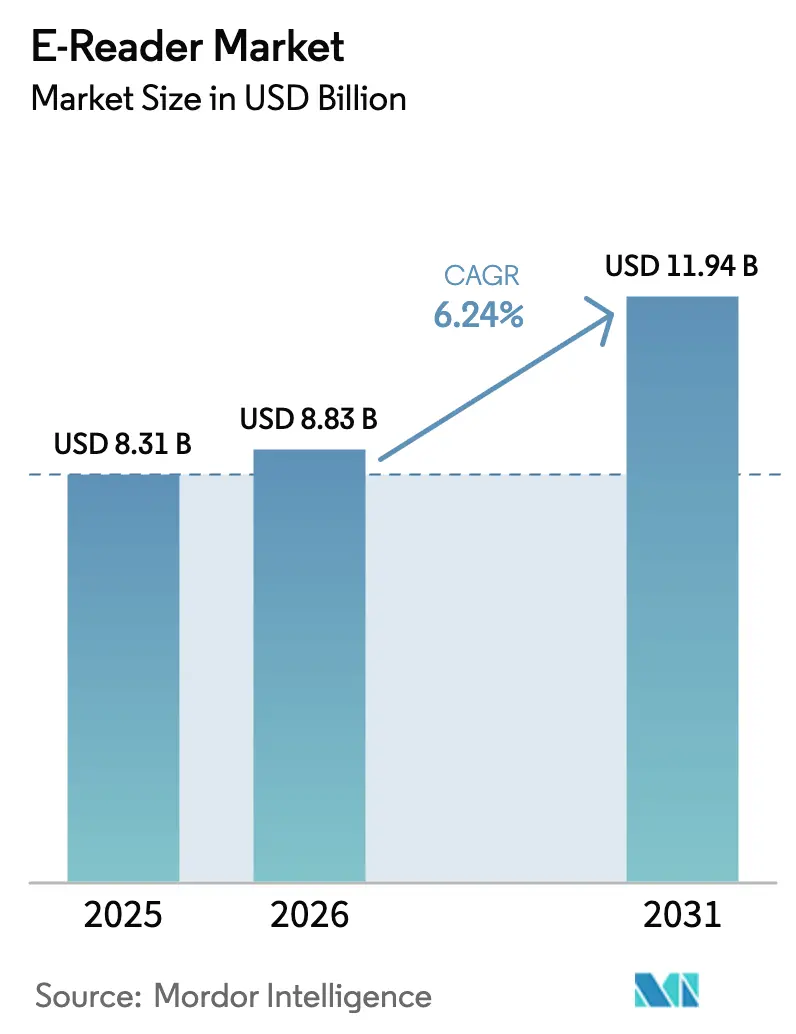
The E-Reader market size is expected to grow from USD 8.31 billion in 2025 to USD 8.83 billion in 2026 and is forecast to reach USD 11.94 billion by 2031 at 6.24% CAGR over 2026-2031. Advances in colour e-ink, artificial intelligence features, and institutional procurement models underpin this steady growth. Colour display innovation broadens use cases in education and comics, while AI-driven summarization and language tools add value for professional and student users. Institutional sustainability mandates accelerate bulk buying as schools and corporations cut paper consumption. Competitive intensity centers on display supply, because E Ink Holdings owns the dominant manufacturing technology that most brands rely on, enabling premium pricing and influencing downstream device cost. Rising digital literacy in Asia-Pacific and sub-USD 100 entry-level devices widen geographic reach and deepen mass-market penetration. The long battery life and eye-comfort advantages of e-ink screens continue to distinguish dedicated readers from tablets and smartphones despite rising multifunction competition.[1]
Key Report Takeaways
- By screen size, the 6–8-inch category held 67.10% of the E-Reader market share in 2025. The above 8-inch category is projected to register an 8.18% CAGR between 2026 and 2031.
- By display technology, E-ink Carta led with 70.95% share in 2025, while E-ink Kaleido colour is set to advance at a 9.23% CAGR through 2031.
- By connectivity, Wi-Fi only accounted for 58.85% of the E-Reader market size in 2025, whereas Wi-Fi plus cellular connectivity is forecast to grow at 9.44% CAGR to 2031.
- By distribution channel, institutional procurement is on track for a 8.89% CAGR, surpassing overall market growth.
- By end user, the education segment is expected to expand at a 9.58% CAGR through 2031.
Note: Market size and forecast figures in this report are generated using Mordor Intelligence’s proprietary estimation framework, updated with the latest available data and insights as of 2026.
Market Trends and Insights
Drivers Impact Analysis of E-Reader Market*
| Driver | (~) % Impact on CAGR Forecast | Geographic Relevance | Impact Timeline |
|---|---|---|---|
| Rising e-Learning enrolments | +1.80% | Global, strongest in APAC and North America | Medium term (2-4 years) |
| Affordable entry-level devices below USD 100 | +1.20% | Global, particularly emerging markets | Short term (≤ 2 years) |
| Expansion of self-publishing and digital-first titles | +0.90% | North America, Europe, APAC core | Long term (≥ 4 years) |
| Commercialisation of colour e-ink for K-12 content | +1.50% | Global, early adoption in developed markets | Medium term (2-4 years) |
| Institutional paper-reduction sustainability mandates | +0.70% | Europe, North America, select APAC markets | Long term (≥ 4 years) |
| Device-content subscription bundles by telecoms | +0.40% | APAC, Latin America, select European markets | Medium term (2-4 years) |
| Source: Mordor Intelligence | |||
Rising e-learning enrolments
Expanding online and hybrid programs push universities and K-12 districts to adopt digital textbooks that pair well with dedicated readers. Procurement teams favour large-format models that accept stylus input for annotation and note-taking. Colour e-ink helps science and math teachers retain visual fidelity while lowering eye strain compared with backlit LCD tablets. AI translation and text-to-speech functions further increase device utility for multilingual classrooms. Budget holders also point to the lower total cost of ownership because digital textbooks remain current without annual reprints.[2]
Affordable entry-level devices below USD 100
Cost-optimized models rely on stripped-down hardware and maturing E-ink supply, bringing the E-Reader market to first-time buyers in Southeast Asia and Latin America. Local telecom operators subsidize hardware in exchange for fixed-term content subscriptions that guarantee recurring revenue. Price competition puts pressure on premium brands to refresh mid-tier lineups more quickly, shortening product cycles and encouraging modular component reuse. Entry-level penetration also feeds second-hand markets, prolonging device lifespans and enlarging the overall user base.[3]
Expansion of self-publishing ecosystems
Independent authors now release digital-first titles that bypass traditional publishing bottlenecks. Royalty structures in major storefronts favour e-books, so creators market directly to global readers, boosting catalogue diversity. Recommendation algorithms inside dedicated readers surface niche genres and long-tail content, reinforcing the device-centric reading habit. Hardware makers respond by integrating storefront shortcuts and author analytics that reward exclusive distribution on their platforms. The trend strengthens network effects that tie hardware, storefront, and subscription models together.
Commercialization of colour e-ink for K-12 content
Kaleido and Gallery 3 technologies present more than 50,000 colour shades at 300 PPI while preserving low power draw. Educational publishers now adapt illustrated textbooks to e-ink layouts that keep pagination stable across devices. Pilot deployments show notable backpack weight reduction and improved accessibility for students with visual processing preferences. Successful pilots increase district-level procurement budgets, pushing order volumes to levels that justify further panel-price reductions. The cycle accelerates hardware adoption and validates institutional business models.[4]
Restraints Impact Analysis of E-Reader Market*
| Restraint | (~) % Impact on CAGR Forecast | Geographic Relevance | Impact Timeline |
|---|---|---|---|
| Competition from tablets and large-screen smartphones | -2.10% | Global, strongest in developed markets | Short term (≤ 2 years) |
| Limited multifunction capability of e-ink hardware | -1.40% | Global, particularly tech-savvy demographics | Medium term (2-4 years) |
| Single-supplier bottleneck for e-ink display modules | -0.80% | Global manufacturing and supply chain | Long term (≥ 4 years) |
| Restrictive DRM ecosystems curbing regional uptake | -0.60% | Emerging markets, regions with limited content libraries | Medium term (2-4 years) |
| Source: Mordor Intelligence | |||
Competition from tablets and large-screen smartphones
Six-inch readers now compete with 6.7-inch phones that stream video, run games, and browse the web. Tablet makers rolled out eye-comfort modes and variable refresh displays that mitigate blue-light fatigue, narrowing the ergonomic gap. Consumers in high-income regions often own both a phone and a tablet, lowering the perceived need for a single-purpose device. Retail promotions, therefore, pitch readers as complementary tools for deep reading rather than general infotainment. Brand messaging now emphasizes distraction-free focus and weeks-long battery life to differentiate.
Hardware limitations constrain feature development
E-ink refresh lag restricts animation, so interfaces remain slower than LCD counterparts. Developers struggle to deliver rich note-taking layers, full-colour magazine layouts, and interactive charts without visible ghosting artifacts. Firmware teams use partial refresh techniques and higher frame buffers, but improvements increase the bill of materials cost. Absence of video conference capability limits enterprise adoption, where multifunction tablets already fill that need. Device makers concentrate on incremental panel upgrades instead of broad feature parity, which tempers price elasticity.
*Our forecasts treat driver/restraint impacts as directional, not additive. The impact forecasts reflect baseline growth, mix effects, and variable interactions.
E-Reader Market Segment Analysis
By Screen Size:
Large displays drive premium growthThe 6–8-inch tier represented 67.10% of the E-Reader market size in 2025 because it balances portability with legibility for most fiction and non-illustrated non-fiction content. Mid-range pricing and broad accessory ecosystems reinforce its dominance. The above 8-inch category now attracts academic and professional buyers who need wide margins for annotation. Colour and handwriting layers on 10-inch models enhance textbook interaction and diagram clarity. As panel yields improve, average selling prices decline, supporting an 8.18% five-year CAGR for large displays. Below 6-inch models lose share as phone screen growth eclipses their size and nullifies portability advantages.
A thriving aftermarket of protective folios and keyboard sleeves positions large readers as hybrid note-taking tablets. Corporate training departments appreciate that files sync over secure enterprise servers without the distraction risk of full Android or iOS ecosystems. Bundled stylus and cloud storage packages drive recurring revenue and tie users into proprietary annotation formats. Margins remain healthy because few competitors can navigate the logistics of big glass substrates. Epson and Sharp supply specialty touch layers that maintain pen precision even at lower refresh rates.


By Display Technology:
Colour innovation accelerates adoptionE-ink Carta retained 70.95% of 2025 shipments because the monochrome platform delivers superior contrast and multi-week battery life at cost points suitable for mass market devices. Economies of scale allow aggressive promotional pricing below USD 100, maintaining a sizable installed base. The E-Reader market share for colour remained small in 2025, yet the E-ink Kaleido segment is forecast to clock 9.23% CAGR through 2031 as schools pilot tablet replacements and comics publishers digitize back catalogues. Gallery 3 panels with film-based colour filters solve early brightness loss problems, though refresh rates still trail LCD. SiPix and fringe technologies serve signage and industrial workflows where biostability and ultra-low power matter more than pixel density.
Device makers now integrate ambient light sensors that tune front-light warmth to mineral-paper colour temperatures, reinforcing the analog reading feel. Firmware upgrades push partial colour refresh options that cap energy drain. Enterprises explore custom front-light waveguides that preserve colour fidelity under LED street lighting conditions for outdoor field manuals. Such specialized requirements create smaller but higher margin niches that further diversify revenue streams for component suppliers.
By Connectivity:
Cellular integration gains momentumWi-Fi-only models accounted for 58.85% of the E-Reader market size in 2025 because home wireless coverage already reaches high penetration in core markets. Consumer cost sensitivity favours the lower bill of materials and retail price of Wi-Fi-only hardware. In contrast, devices equipped with Wi-Fi plus cellular modems log a 9.44% CAGR as traveling professionals and students require constant cloud sync for annotations and shared course packs. Global e-SIM profiles simplify provisioning across borders. Carriers now bundle unlimited document sync rather than metered data plans, underscoring the minimal bandwidth demands of e-ink devices. Bluetooth only or offline sync caters to defense and research institutions where radio silence or air-gapped networks remain mandatory.
Cloud-first workflows encourage cellular adoption. Collaborative editing and AI summarization rely on server processing, so latency becomes critical. Manufacturers offset modem power draw with larger batteries and firmware that toggles radios only during scheduled sync intervals, preserving multi-week uptime. Content storefronts exploit always-connected devices for push marketing promotions that drive incremental sales without requiring user-initiated store visits.
By Distribution Channel:
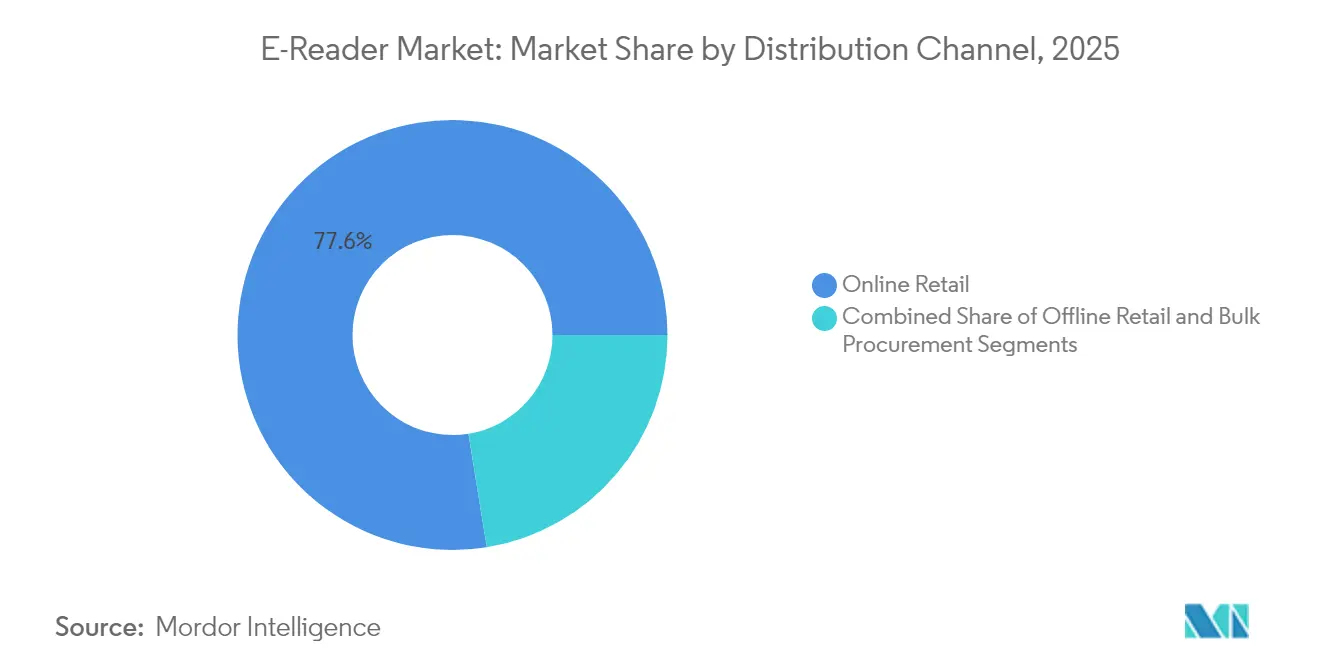
Institutional procurement transforms salesOnline retail retained 77.55% share in 2025 because brand-owned websites and general e-commerce marketplaces facilitate quick comparison and provide buyer reviews that demystify technical specifications. Fulfillment partners offer local warranties that match or exceed brick-and-mortar service levels. Nevertheless, institutional and bulk procurement registers a 8.89% CAGR as entire school districts, universities, and multinational corporations commit to zero-paper initiatives. Requests for quotation often stipulate encrypted device management portals, warranty pooling, and recycling clauses, features more easily negotiated through direct B2B contracts than consumer channels. Offline electronics stores keep some relevance for hands-on trials of premium models, yet their share continues to slide, particularly in markets with high postal reliability.
Bulk buyers usually contract for multiyear content licenses tied to device serial numbers, guaranteeing predictable revenue for hardware suppliers. Training manuals, policy binders, and onboarding kits shift to digital paper, trimming reprint costs when regulations change. The procurement trend feeds a refurb flow as institutions redeploy used devices to community libraries after three-year cycles, expanding the total addressable audience at lower price points.
By End User:
Educational segment leads growthLeisure readers comprised 52.10% of unit shipments in 2025, illustrating the legacy dominance of fiction enthusiasts who prize distraction-free immersion and month-long battery life. However, the students and education category posts a 9.58% CAGR by 2031. National curricula in Europe and East Asia mandate digital textbook availability, incentivizing district leaders to invest in central device fleets. Formalized note-taking, search, and citation tools increase academic productivity. Publishers offer subscription models that undercut print textbook bundles, thereby appealing to budget-constrained institutions. Professional and enterprise users represent a smaller but high-value niche because engineering teams and legal departments replace bulk paper binders with secure, tamper-proof e-ink repositories.
Campus bookstores increasingly bundle colour readers with mandatory course packs, simplifying first-semester logistics. Integrated quiz modules and analytics feed back into learning management systems, so instructors track reading progress. Accessibility features like adjustable font weights and dyslexia friendly typefaces comply with inclusive education regulations, broadening the user pool. Corporate buyers add readers to employee welcome kits, emphasizing carbon reduction commitments to stakeholders and regulators.
Geography Analysis
North America E-Reader Market
North America remained the largest regional contributor with a 46.05% 2025 share of the E-Reader market, buoyed by high discretionary spending and integrated content platforms that couple device sales with vast catalogues. Early Kindle adoption fostered an entrenched user culture that favours dedicated readers for long-form content. Public library consortia syndicate digital loans that automatically expire, saving taxpayers substantial restocking costs and sustaining circulation growth. Retail subsidies and trade-in programs keep upgrade cycles brisk, cushioning the market against tablet cannibalization.
APAC E-Reader Market
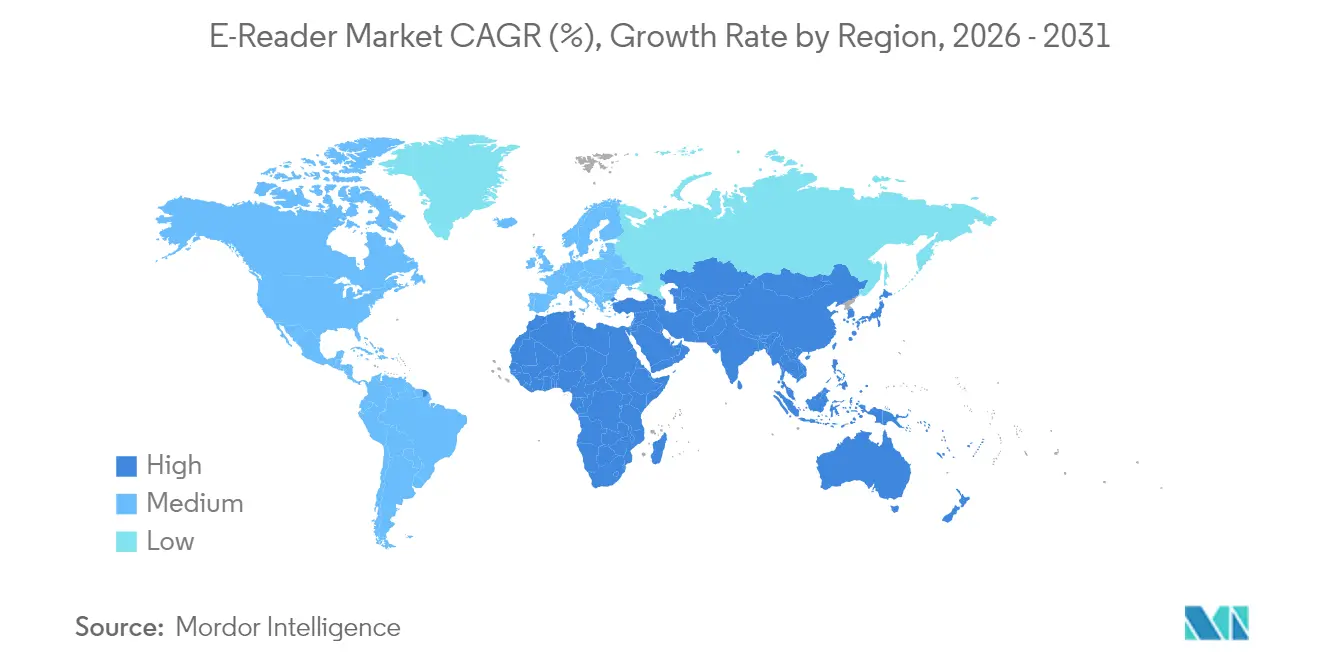
Asia-Pacific delivers the fastest growth at a 7.62% CAGR through 2031. Rising middle-class income intersects with nationwide digital literacy campaigns in China, India, and Indonesia. Domestic brands such as Onyx Boox leverage local manufacturing tax incentives to price competitively, while global players partner with telecom giants to bundle storefront credits. Japan’s mature e-book ecosystem, valued at JPY 670.3 billion (USD 94.2 billion) in 2024, illustrates a willingness to pay for premium colour devices with manga-optimized layouts. Government subsidies for remote village libraries in India and Indonesia further widen rural adoption.
Europe, LATAM and Africa E-Reader Market
Europe shows steady mid-single digit expansion under the influence of the EU General Product Safety Regulation, which prioritizes environmentally responsible hardware. Institutional buyers weigh lifecycle emissions and repairability scores before awarding contracts. The EU Deforestation Regulation also nudges publishers toward digital first distribution, indirectly expanding the E-Reader market. Scandinavian school systems pilot district wide device programs that eliminate printed workbooks, while German corporates integrate secure readers into board meeting workflows. Latin America and Africa remain emerging opportunities, where falling hardware prices and expanding 4G coverage unlock new addressable segments. Local language content partnerships and micro-financing options gain traction in these regions.
Regulatory Landscape
E-readers and adjacent e-ink note devices sold globally are shaped by product safety, radio, and battery rules that affect hardware design, labeling, and aftersales obligations. In the European Union, devices must comply with CE-marking frameworks such as the Low Voltage Directive (2014/35/EU), Electromagnetic Compatibility Directive (2014/30/EU), and the Radio Equipment Directive (2014/53/EU), which set requirements for electrical safety, electromagnetic emissions, and wireless connectivity for Wi-Fi and cellular-enabled models.
Repairability and battery-serviceability requirements are becoming more explicit in Europe and add compliance-driven engineering work for sealed, thin devices. The EU Right to Repair Directive (2024/1799) applies from July 31, 2026, reinforcing obligations around reasonable repair pricing, access to spare parts and repair information, and limits on software barriers to third-party repair. The EU Battery Regulation 2023/1542 further raises the bar by requiring, from February 18, 2027 (Article 11), portable devices sold in the EU to have end-user-replaceable batteries using commercially available tools and without prohibitive adhesives. Beyond Europe, device makers also manage country certifications and safety registrations such as CCC in China, BIS registration in India, and PSE compliance for lithium-ion batteries in Japan, which affects timelines and costs for multinational launches and broader channel distribution.
Competitive Landscape
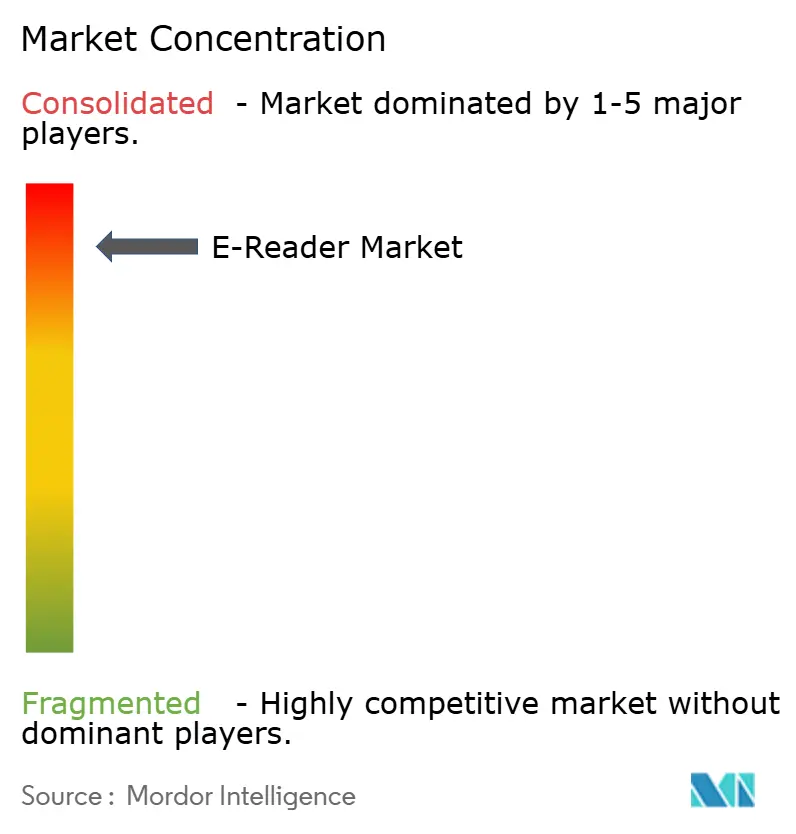
Market concentration is high because Amazon controls roughly 80% of global shipments through its vertically integrated Kindle ecosystem. Rakuten Kobo ranks second at 10%, carving out share via openness to EPUB and library integrations. E Ink Holdings sits upstream with near monopolistic control of electrophoretic panel manufacturing. The combined dominance of these firms sets a high entry barrier for newcomers that lack both content catalogues and component supply guarantees. Nevertheless, niche challengers prosper by focusing on specialized use cases. reMarkable targets creative professionals with pen-centric workflows. Onyx Boox appeals to power users through Android app compatibility and large form factors. Readmoo differentiates with innovative folding designs that fit in small handbags while offering 8-inch colour screens.
Strategic moves reinforce incumbent advantage. Amazon launched Kindle Colorsoft in October 2024, validating colour technology for mainstream audiences. Kobo announced Instapaper integration in July 2025 to offset the retirement of Pocket, thereby keeping read-later habits within its ecosystem. E Ink earned UL 2799 zero-waste certification in May 2025, helping device brands meet sustainability procurement criteria. Competitors answer with modular stands, keyboard accessories and warranty friendly component swaps to prolong product life. AI integration becomes the next battleground as firmware updates roll out summarization, translation and voice-assist features without sacrificing battery life. Privacy conscious segments scrutinize on-device versus cloud inference, influencing brand trust rankings.
Intellectual property portfolios shape pricing power. Amazon’s Whispernet and Goodreads data feed personalized recommendations that drive stickiness. Kobo leverages parent company Rakuten’s e-commerce analytics to refine merchandising. reMarkable patents in low latency pen input fortify its premium positioning. The competitive field remains dynamic, yet vertical integration and economies of scale allow dominant players to defend share even as new entrants explore flexible display prototypes and open-source storefronts.
E-Reader Industry Leaders
-
Amazon.com Inc.
-
Barnes & Noble Inc.
-
Rakuten Kobo Inc
-
Hanvon Technology Co. Ltd.
-
Onyx International Inc.
- *Disclaimer: Major Players sorted in no particular order
E-Reader Market Companies Covered in this Report
- Amazon .com, Inc.
- Rakuten Group, Inc. (Kobo)
- Barnes and Noble, LLC
- PocketBook International SA
- Onyx International Inc. (BOOX)
- Hanvon Technology Co., Ltd.
- Bookeen SAS
- ECTACO Inc.
- Sony Group Corporation
- Apple Inc.
- ReMarkable AS
- Boyue Shenzhen Technology Co., Ltd.
- Fujitsu Limited
- Huawei Technologies Co., Ltd.
- Xiaomi Corporation
- Bigme Corporation
- Dasung Tech Co., Ltd.
- Tolino Alliance GmbH and Co. KG
- Energy Sistem Technology, S.A.
- Arta Tech sp. z o.o.
Market Opportunities and Future Outlook
Ecosystem differentiation is emerging as a whitespace for challengers to large, vertically integrated platforms, particularly when readers look for social discovery, independent retail support, or alternative recommendation graphs. In June 2026, Rakuten Kobo integrated StoryGraph, adding native reading-progress and community features that connect device usage with a third-party reading network, and this expands Kobo's retention toolkit beyond storefront-only engagement. Separately, Bookshop.org confirmed Kobo e-reader support with a rollout discussed for 2026, which creates a route for e-book purchases tied to independent bookstores and can support Kobo adoption in markets where consumers prefer non-Amazon retail options.
Hardware and firmware roadmaps are also creating room for AI-assisted reading workflows that work within e-ink constraints, including summarization, translation, and structured note extraction for PDFs and textbooks without shifting users to backlit tablets. Upstream innovation remains pivotal because E Ink Holdings is the dominant electrophoretic display supplier, and partnership activity around e-reader SoCs and timing control points to tighter reference platforms for color e-paper and AI features. At the same time, the compliance cycle in Europe (right-to-repair and upcoming battery-serviceability requirements) creates space for product lines designed for easier battery replacement and spare-part availability, aligning with institutional procurement criteria that already emphasize lifecycle management, warranty pooling, and sustainability clauses in bulk tenders.
Recent Industry Developments in E-Reader Market
- July 2026: Released 16 GB model of Kindle Colorsoft and first-ever Kindle Colorsoft Kids. The launch expands Amazon's Kindle Colorsoft lineup and broadens addressable segments in family and education use cases. The action reinforces Amazon's dominant market position and ecosystem lock-in.
- June 2026: Integrated Kobo e-reader platform with the StoryGraph reading community app. The integration enhances social reading workflows on Kobo devices and deepens user engagement with community features. The partnership expands competitor ecosystem, potentially narrowing Amazon's moat.
- May 2026: Expanded partnership to develop generative-AI-enabled e-reader SoCs with hardware timing controllers. The collaboration broadens AI driven capabilities and on device processing for e readers. It accelerates AI-enabled reading experiences across devices, influencing product differentiation.
E-Reader Market Report Scope and Research Methodology
Market Definition and Coverage
For this report, the market is defined as revenues generated from dedicated e-reader devices sold to consumers and institutions, across online and offline channels, with value captured at the point of device sale in each geography.
Scope exclusions: We exclude tablet PCs, smartphones, general-purpose laptops, and paid digital reading content sales unless they are bundled and inseparable from the device transaction.
Segments Covered in This Report
- By Screen Size
- Below 6 inch
- 6-8 inch
- Above 8 inch
- By Display Technology
- E-ink Carta
- E-ink Kaleido (Colour)
- SiPix and Others
- By Connectivity
- Wi-Fi only
- Wi-Fi + Cellular
- Bluetooth-only / Offline sync
- By Distribution Channel
- Online Retail
- Offline Retail
- Institutional / Bulk Procurement
- By End-user
- Students and Education
- Professionals / Enterprise
- Leisure and General Public
- By Geography
- North America
- United States
- Canada
- Mexico
- Europe
- United Kingdom
- Germany
- France
- Italy
- Rest of Europe
- Asia-Pacific
- China
- Japan
- India
- South Korea
- Rest of Asia
- Middle East
- Israel
- Saudi Arabia
- United Arab Emirates
- Turkey
- Rest of Middle East
- Africa
- South Africa
- Egypt
- Rest of Africa
- South America
- Brazil
- Argentina
- Rest of South America
- North America
Data Sources, Market Sizing, and Validation
Desk Research
Desk work starts with anchoring demand signals and supply-side constraints that shape device shipments and pricing. We refer to public statistics and documentation such as U.S. International Trade Commission import data, UN Comtrade trade series, and U.S. Bureau of Labor Statistics CPI components that help normalize pricing and inflation effects over time.
To avoid building the model on one single data stream, we also review sources such as International Telecommunication Union connectivity indicators, World Bank macro series, and selected peer-reviewed papers on e-ink display adoption and reading behavior. On the industry side, we check annual reports, investor presentations, and reputable press coverage for product-cycle timing and channel mix changes. We supplement this with paid subscriptions for company financials and news, patent databases, and shipment-level import/export visibility where needed. The examples above are illustrative only, and many additional public and subscription sources were reviewed to collect, cross-check, and clarify inputs.
Primary Interviews and Surveys
Primary work is used to pressure-test the desk assumptions that most often move the total, especially average selling price (ASP), channel discounts, and the timing of major model refreshes. We spoke with a mix of device-side stakeholders, channel participants, and enterprise or education buyers across key regions, so that regional launch timing, currency impacts, and procurement seasonality could be checked and then reflected in the final model.
Distribution of primary research fieldwork respondents
| Company type | Respondent position | Region |
|---|---|---|
| Top tier: 37% | CXOs: 17% | APAC: 42% |
| Mid tier: 45% | Functional/Unit leaders: 35% | EMEA: 33% |
| Smaller Players: 18% | Managers: 48% | Americas: 25% |
Market-Sizing & Forecasting
The core sizing is built using a top-down demand pool, where household and institutional adoption indicators are translated into expected device shipments, which are then converted to value using region-specific ASP paths. To keep the totals realistic, we corroborate outcomes with selective bottom-up checks, such as sampled SKU pricing by channel, typical promotion depth, and a constrained roll-up using a short list of visible supplier and distributor signals.
Inputs that matter for e-readers include replacement cycles for dedicated devices, e-ink component availability and lead times, the share of Wi-Fi versus cellular models, education and library procurement seasonality, and the observed spread between list price and realized price after discounts. Forecasting is handled using scenario analysis supported by light regression-style checks on variables like disposable income, connectivity readiness, and inflation-adjusted device pricing, followed by expert review to confirm whether the scenarios align with what buyers are planning. When a bottom-up cross-check is missing for a smaller geography, we use proxy ratios from comparable markets and then scale only after the implied ASP and unit intensity meet the interview checks.
Data Validation & Update Cycle
Before final sign-off, results are validated through multiple passes that look for outliers in shipment growth, price jumps, and region shares that do not align with known product launches or channel promotions. We compare the outputs against independent signals such as trade flows, component commentary, and device price tracking, so any unusual swings are investigated and corrected.
The model is reviewed by another analyst, and we re-contact sources when key assumptions shift, such as a large refresh cycle, a sudden currency move, or an unexpected change in institutional demand. Reports are refreshed annually, and interim updates are made when material events occur, followed by a final pre-delivery check so clients receive the latest updated view.
Mordor Intelligence's E Reader Market Size Measured Against Other Published Estimates
Published market sizes for e-readers can vary a lot, even when the topic sounds identical, because the refresh timing, currency conversion choices, and the way ASP is treated during promotions can all shift the final number. We keep the comparison practical by focusing on a few gap drivers that can be checked and repeated by another analyst.
When yearly averages are used for exchange rates and ASP is adjusted for channel discounting around peak sales windows, the total lands differently than estimates that apply spot currency rates or assume a flat price curve. This is also where the refresh-led approach used by Mordor Intelligence tends to track closer to what buyers and channels report for the same time window.
Benchmark comparison
| Source | Market Size | Gaps in Research Methodology |
|---|---|---|
| Mordor Intelligence | USD 8.83 B (2026) | |
| Trade Journal A | USD 2.20 B (2024) | Often sized as dedicated e-book reader hardware only, with older base-year timing and limited normalization for regional price dispersion, which can understate value when premium models and institutional bundles are present. |
| Regional Consultancy B | USD 0.27 B (2024) | Typically anchored on a narrower product definition and a smaller captured channel set, and it may rely on partial shipment visibility that misses offline retail and education procurement in several countries. |
The spread in the table is mainly explained by base-year alignment, currency timing, and whether ASP is treated as a list price or a realized price after promotions and channel margins. By keeping scope tied to device-sale value and by checking the price and volume logic against interview feedback and external signals, the methodology gives us a repeatable estimate that can be updated cleanly when refresh cycles and pricing conditions change.
Key Questions Answered in the Report
How large is the E-Reader market in 2026?
The E-Reader market size stands at USD 8.83 billion in 2026 with a 6.24% CAGR outlook to 2031.
Which display technology is growing fastest?
E-ink Kaleido color panels are projected to register a 9.23% CAGR through 2031 as education and comics drive color adoption.
Why are large screen readers gaining traction?
Models above 8 inches support detailed diagrams and handwriting, helping the segment grow at an 8.18% CAGR.
What role do sustainability mandates play?
Corporate and campus paper reduction goals accelerate institutional procurement, lifting bulk sales by a 8.89% CAGR.
Who dominates global shipments?
Amazon controls about 80% of worldwide units, followed by Rakuten Kobo at roughly 10%, giving the market a high concentration score.
Which region offers the strongest growth potential?
Asia-Pacific is forecast to expand at 7.62% CAGR as digital literacy initiatives and local manufacturing reduce adoption barriers.