
Market Overview
| Study Period | 2019 - 2031 |
|---|---|
| Forecast Data Period | 2026 - 2031 |
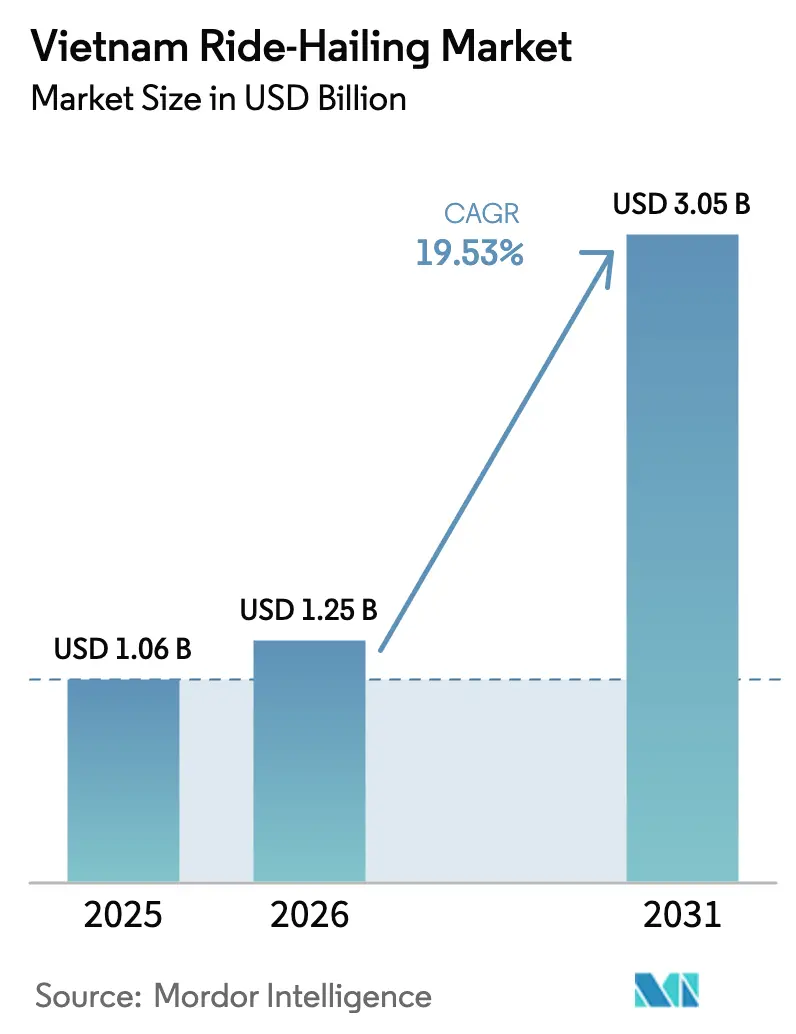
| Base Year Market Size (2025) | USD 1.06 Billion |
| Market Size (2026) | USD 1.25 Billion |
| Market Size (2031) | USD 3.05 Billion |
| Growth Rate (2026 - 2031) | 19.53 % |
| Market Concentration | Medium |
Major Players *Disclaimer: Major Players sorted in no particular order Image © Mordor Intelligence. Reuse requires attribution under CC BY 4.0. | |
Vietnam Ride-Hailing Market Analysis by Mordor Intelligence
The Vietnam ride-hailing market size was valued at USD 1.06 billion in 2025 and estimated to grow from USD 1.25 billion in 2026 to reach USD 3.05 billion by 2031, at a CAGR of 19.53% during the forecast period (2026-2031). Rapid smartphone adoption, metro-line extensions in Hanoi and Ho Chi Minh City, and generous e-wallet promotions are converging to expand the addressable pool of digital commuters. Incumbents with provincial-level operating licenses are advantaged because Decree 158/2024 allows local transport departments to cap vehicle numbers, raising entry barriers for late movers. Parallel policy pushes—registration-fee waivers for electric cars under Decree 51/2025 and the central bank’s real-time settlement rails—lower fleet costs and speed cashless payments, reinforcing structural demand. Against this backdrop, super-apps are subsidizing fares through food-delivery and fintech profits, locking in user loyalty while tightening the competitive screws on single-vertical rivals.
Key Report Takeaways
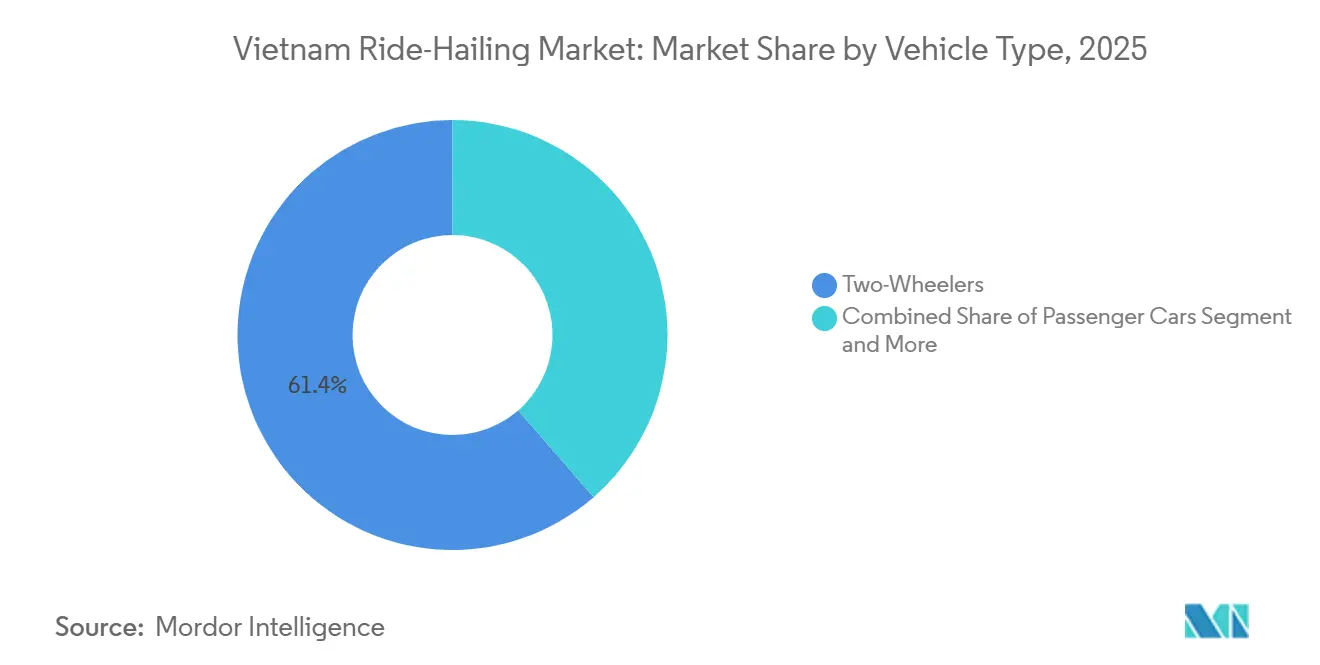
- By vehicle type, two-wheelers led with 61.36% of the Vietnam ride-hailing market share in 2025, while vans and multi-purpose vehicles are poised to log a 19.55% CAGR to 2031, the fastest pace in the segment universe.
- By propulsion, internal-combustion vehicles still controlled 73.27% of the Vietnam ride-hailing market size in 2025, while battery-electric fleets are expanding at a 19.65% CAGR through 2031.
- By service model, e-hailing captured 83.35% revenue share in 2025, while robo-taxi pilots are forecast to advance at a 19.63% CAGR over 2026-2031.
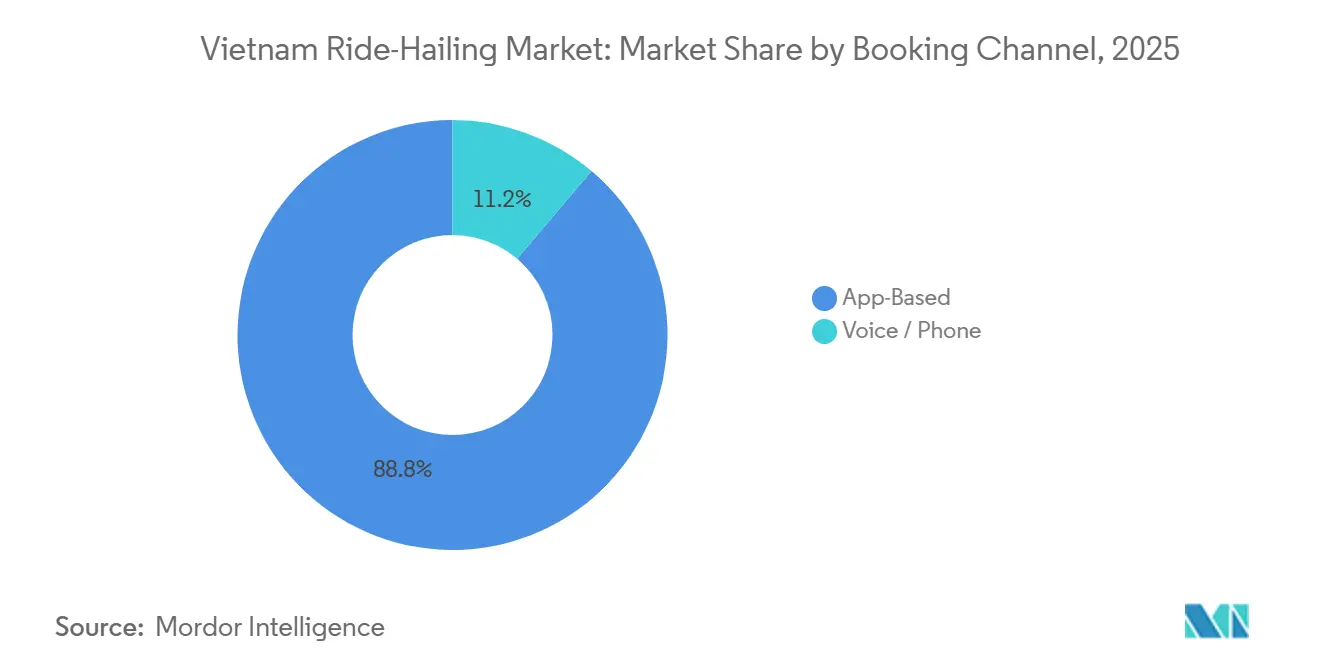
- By booking channel, app-based bookings captured 88.82% revenue share in 2025 and are forecast to advance at a 19.57% CAGR over 2026-2031.
- By end user, the personal segment commanded 77.37% revenue in 2025; corporate accounts are expected to post a 19.59% CAGR as firms replace owned fleets with subscription packages.
Note: Market size and forecast figures in this report are generated using Mordor Intelligence’s proprietary estimation framework, updated with the latest available data and insights as of January 2026.
Vietnam Ride-Hailing Market Trends and Insights
Drivers Impact Analysis*
| Driver | (~) % Impact on CAGR Forecast | Geographic Relevance | Impact Timeline |
|---|---|---|---|
| EV-friendly tax incentives spurring fleet electrification | +4.1% | National, early gains in urban centers | Medium term (2-4 years) |
| Expansion of Hanoi and HCMC metro lines creating first/last-mile demand nodes | +3.5% | Hanoi, HCMC metropolitan areas | Short term (≤ 2 years) |
| Explosive adoption of e-wallets and cashless payments among Gen-Z consumers | +3.2% | National, with concentration in Hanoi, HCMC, Da Nang | Short term (≤ 2 years) |
| Government "Make In Vietnam" digital roadmap accelerating smart-mobility adoption | +2.8% | National, driven by central government policy | Medium term (2-4 years) |
| Super-app fare subsidies via cross-vertical loyalty ecosystems | +2.6% | National, strongest in Grab/Be/Zalo user bases | Short term (≤ 2 years) |
| Tourism rebound expected to surpass pre-COVID levels | +2.4% | Hanoi, HCMC, Da Nang, Nha Trang, Phu Quoc | Medium term (2-4 years) |
| Source: Mordor Intelligence | |||


EV-Friendly Tax Incentives Spurring Fleet Electrification (VinFast, Xanh SM)
Decree 51/2025 eliminates EV registration fees for a significant period and substantially lowers the special consumption tax for electric vehicles compared to internal combustion engine (ICE) cars. This policy results in a notable reduction in acquisition costs, making EVs more financially accessible. By the middle of the forecast period, Xanh SM is expected to have deployed a considerable fleet of VinFast VF e34s across numerous provinces, serving a large and growing number of riders. Bulk electricity contracts negotiated with EVN are expected to lead to a meaningful reduction in tariffs. This enables fares to be set noticeably lower than those of traditional sedans, while still ensuring that drivers maintain competitive earnings. VinFast’s Green series introduces a lease-to-own financing option with an interest rate significantly below standard bank rates.
Expansion of Hanoi and Ho Chi Minh City Metro Lines Creating First/Last-Mile Demand Nodes
Ho Chi Minh City’s Metro Line 1 commenced operations, drawing in a significant number of daily riders to its closely situated pick-up zones. Platforms, during off-peak hours, entice commuters with geofence discounts within a short distance of the stations, effectively boosting trip numbers. Meanwhile, Hanoi’s Lines 2A and 3 cater to a substantial daily ridership. Notably, Be Group highlights that a considerable portion of these passengers opt for a ride-hail shortly after disembarking. Responding to the trend, a recent directive from the ministry mandates dedicated pick-up bays at all metro stops by mid-2026, aiming to significantly reduce wait times. Drawing parallels, similar initiatives in Bangkok and Jakarta saw ride-hail volumes surge considerably within a short period, a target now within reach for Vietnam's ride-hailing market.
Explosive Adoption of E-Wallets and Cashless Payments Among Gen-Z Consumers
Vietnam saw a significant rise in e-wallet adoption, with MoMo emerging as a leading platform hosting a substantial share of active accounts [1]“Cashless Vietnam Roadmap,” State Bank of Vietnam, sbv.gov.vn . By eliminating cash handling, transaction times were noticeably reduced, enabling drivers to complete additional trips during their shifts. Gen-Z demonstrated a remarkably high wallet penetration rate, far exceeding the regional average, highlighting their early adoption of QR payments for retail and food delivery. Grab's integration of ZaloPay in 2023 led to a notable increase in its monthly active user base within a short period, driven by the introduction of cross-vertical reward redemption. Furthermore, the government’s Decision 749/QD-TTg mandates interoperability, effectively reducing settlement fees. This allows platforms to allocate micro-subsidies to price-sensitive routes while maintaining healthy unit economics.
Government “Make In Vietnam” Digital Roadmap Accelerating Smart-Mobility Adoption
Decision 749/QD-TTg prioritizes 5G, IoT sensors, and open-data APIs that ride-hailing apps harness for real-time routing [2]“Digital Vietnam 2025,” Ministry of Information and Communications, mic.gov.vn . By 2025, Hanoi and Ho Chi Minh City had connected thousands of traffic cameras, significantly reducing peak-hour trip times. In 2024, a vehicle-to-infrastructure pilot in Ho Chi Minh City allowed select fleets to pre-book green-light sequences. This advantage is now integrated into the electric sedans of VinFast and Xanh SM. A recent decree halved licensing lead-times in Da Nang and Can Tho, boosting tier-2 expansions by FastGo and TADA. The synchronization of central policies with provincial implementations is driving the growth of Vietnam's ride-hailing market beyond its two major cities.
Restraints Impact Analysis*
| Restraint | (~) % Impact on CAGR Forecast | Geographic Relevance | Impact Timeline |
|---|---|---|---|
| Rising driver-acquisition costs amid gig-labor shortages and wage hikes | -2.3% | National, most severe in Hanoi, HCMC | Short term (≤ 2 years) |
| Fragmented provincial taxi-licensing caps complicate compliance | -1.8% | National, acute in provinces outside Hanoi/HCMC | Long term (≥ 4 years) |
| Urban congestion and limited curb-side pick-up zones increasing service latency | -1.6% | Hanoi, HCMC, Da Nang | Medium term (2-4 years) |
| Cyber-security Decree 53 raising data-localization cost burden | -1.2% | National, affects foreign platforms disproportionately | Medium term (2-4 years) |
| Source: Mordor Intelligence | |||
Rising Driver-Acquisition Costs Amid Gig-Labor Shortages and Wage Hikes
In 2025, average monthly driver earnings increased significantly, following a notable minimum wage hike in 2024. Platforms are now investing substantial amounts per recruit on sign-up bonuses and lease subsidies, driving acquisition costs well above pre-pandemic levels. Be Group’s BE5X driver hub, aiming to reduce churn through bundled insurance and maintenance, faced a setback: a considerable portion of its participants exited within six months, pointing to issues with rigid repayment terms. Meanwhile, Grab tested guaranteed-income plans in Ho Chi Minh City's District 7, offering competitive compensation for a set number of monthly trips. These subsidies, which required significant quarterly investments, successfully reduced attrition by a noticeable margin. However, rising labor expenses are squeezing margins for operators who lack the scale to benefit from cross-subsidization in adjacent verticals.
Fragmented Provincial Taxi-Licensing Caps Complicate Compliance
Decree 158/2024 keeps license quotas in provincial hands. Hanoi permits a significantly higher number of ride-hail cars compared to neighboring Bac Ninh, which imposes a much stricter limit. This discrepancy results in numerous separate application processes. In many smaller markets, smaller apps face compliance costs that often exceed their initial revenue, leading to substantial delays in expansion. In recent years, taxi lobbies have successfully resisted increases in quotas across several provinces, arguing that such changes would jeopardize their existing investments. A ministry proposal aimed at standardizing criteria has faced resistance from local authorities, who are reluctant to lose their fee income. As a result, inconsistent regulations are expected to continue for the foreseeable future. Consequently, concentration remains in Hanoi and Ho Chi Minh City, with a significant majority of the national fleet operating in these two megacities.
*Our forecasts treat driver/restraint impacts as directional, not additive. The impact forecasts reflect baseline growth, mix effects, and variable interactions.
Segment Analysis
By Vehicle Type: Two-Wheelers Anchor Growth While Vans Accelerate On Corporate Demand
Two-wheelers delivered 61.36% of the Vietnam ride-hailing market share in 2025, driven by the widespread use of motorcycles, which are better suited for navigating urban alleyways compared to cars. With affordable fares, short-distance trips are the most common in the dense urban centers of Hanoi and Ho Chi Minh City. Vans and MPVs are forecast to chart a 19.55% CAGR to 2031 as employers swap fixed shuttles for on-demand pooling, slicing per-employee transport costs minimally. This growth is attributed to employers shifting from fixed shuttles to on-demand pooling, which helps reduce transportation costs for employees. Be Group’s leasing program for multi-seat vans at competitive rates is increasing the availability of vehicles for airport transfers, where ticket prices are relatively higher. Meanwhile, passenger cars are under pressure as electric vehicle operators offer lower fares due to reduced fuel costs. This has led traditional players to invest heavily in hybrid vehicles to remain competitive.
Three-wheelers hold a negligible share of the market, facing obstacles such as unclear regulatory classifications and consumer safety concerns. However, app-based shuttles in industrial parks are showing potential, as predictable shift schedules align well with fixed routes, improving vehicle efficiency. A pilot program in Ho Chi Minh City in 2025 prioritized vans, leading to shorter journey times and improved reliability for corporate clients. As electrification incentives expand, electric vans with longer ranges are expected to gain market share from diesel minibuses, which are increasingly unable to meet stricter emissions standards.


By Propulsion Type: ICE Dominance Erodes As Incentives Favor EVs
Internal-combustion engines still commanded 73.27% of the market in 2025, yet battery-electric fleets are scaling fast on a 19.65% CAGR tailwind. By the end of the forecast period, Vietnam's ride-hailing market for electric vehicles is anticipated to achieve significant growth. This expansion is driven by government policies that reduce upfront costs and shorten the time required to recover investments, given the current cost differences between fuel and electricity. A leading operator in the market demonstrates that electric vehicles have notably lower operating costs compared to traditional internal combustion engines (ICE). This cost advantage enables the company to offer more affordable ride prices while maintaining competitive earnings for drivers. Hybrids are gaining traction as an interim solution for taxi companies transitioning to full electrification, with recent orders highlighting this approach.
Compressed natural gas (CNG) and liquefied petroleum gas (LPG) remain niche options, limited to small-scale operations in specific areas where refueling infrastructure is already in place. However, their adoption is hindered by a lack of financial incentives and limited consumer awareness. A prominent electric vehicle manufacturer offers financing options that are more favorable than traditional bank loans, providing smaller operators with an accessible pathway to adopt electric vehicles without substantial upfront investments. As government regulations increasingly favor electric taxis, traditional ICE vehicles are expected to be phased out from urban centers and may become more common in less densely populated areas unless taxation policies are revised.
By Service Type: E-Hailing Rules While Robo-Taxi Pilots Inch Forward
E-hailing booked 83.35% of 2025 revenue, cementing its role as the default urban mobility option in the Vietnam ride-hailing market. The segment’s success rides on dynamic pricing, real-time matching, and embedded wallets that reduce friction relative to street-taxis. Robo-taxi pilots could post 19.63% CAGR but remain confined to test circuits because the Ministry of Transport has yet to issue final autonomous-vehicle guidelines. Grab postponed its Ho Chi Minh City pilot from 2025 to 2026 to comply with Decree 53 data-handling clauses, proving that regulation sets the cadence of innovation. Peer-to-peer car-sharing lingers under a minimal range because owners fear wear-and-tear and renters distrust vehicle condition; blockchain reputation scores deployed by TADA have yet to shift sentiment materially.
Subscription ride bundles are gaining traction: GrabUnlimited and Be Pass charge VND 25,000 to 49,000 (USD 0.95 to 1.86) monthly for unlimited short trips and lower surge multipliers, channeling predictable cash flow into what is otherwise an episodic business. Their subscription slice reached its peak share of total bookings within six months for Be Group, showing Vietnamese riders accept mobility-as-a-service when the value is clear. Dedicated metro pick-up zones coming online in 2026 will further entrench e-hailing since only apps with dynamic supply algorithms can capitalize on micro-demand spikes.
By Booking Channel: App Dominance Mirrors Digital Maturity
App-based reservations captured 88.82% of 2025 rides and are set to grow 19.57% annually as smartphone penetration tops nationwide. Voice bookings persist among older users and rural pockets but are fading; Grab shut its Hanoi call center in 2024, moving queries to an AI voice bot that routes to drivers directly. Zalo’s one-tap ride option inside Vietnam’s largest messaging platform grabbed a few of the app-rides within 12 months by stripping out app-download friction.
Decision 749/QD-TTg’s requirement for payment-platform interoperability cuts transfer fees, letting operators pass savings to bargain hunters via promo codes pushed through app notifications. The “Safe Tourism” badge is only visible in app ecosystems that log trip metadata, sidelining voice-based dispatchers from the lucrative visitor pool.
By End User: Corporate Accounts Race Ahead As Firms Ditch Owned Fleets
Personal use still comprised 77.37% of 2025 rides, reflecting Vietnam’s young median age of 32.5 and the high hassle of car ownership in congested cities. Yet corporate accounts are charting a 19.59% CAGR to 2031 as multinationals adopt Grab Business and Be Biz for centralized billing, expense control, and policy enforcement.
In a move favoring on-demand services, the Ministry of Finance's 2024 circular allows companies to deduct the full amount of actual ride-hailing expenses. In contrast, depreciation on owned vehicles is limited to a partial deduction. Corporate trips, typically longer than personal journeys, often utilize premium vehicle tiers, significantly boosting revenue per ride. While tourist travelers are categorized under personal trips, they generate noticeably higher revenue per journey. To capitalize on this lucrative segment, especially as tourist arrivals bounce back, multilingual driver modules are set to roll out in 2025.
Geography Analysis
In 2025, Hanoi and Ho Chi Minh City, with a small proportion of Vietnam's population, accounted for a significant majority of the nation's ride-hailing revenue. This dominance is attributed to the cities' higher disposable incomes and the introduction of metro lines, conveniently directing riders to app-friendly pick-up points [3]“Regional Socio-Economic Indicators 2025,” General Statistics Office, gso.gov.vn . By 2026, Ho Chi Minh City's share of the ride-hailing market is expected to grow substantially, supported by the city's large base of smartphone users and a high volume of daily metro riders. To tap into the demand, geo-fenced off-peak discounts have been introduced around Metro Line 1 stations, targeting commuters who prefer not to use buses in the sweltering heat. Meanwhile, Hanoi's partially operational Line 3 caters to a significant number of daily riders, and strategic surge pricing around Cau Giay has led to a notable boost in driver earnings, enhancing supply elasticity.
Da Nang, capturing a modest share of the 2025 revenue, owes its success to an influx of Korean and Japanese tourists, whose average ride values surpass those of domestic travelers by a considerable margin. Following Decree 158, the city expedited its licensing process to a much shorter timeframe, allowing companies like FastGo and TADA to dominate the airport transfer niche, especially during peak demand seasons.
Can Tho and Nha Trang have embraced Xanh SM’s electric taxis, capitalizing on the cities' cheaper electricity rates compared to other regions to offer fare discounts that challenge traditional diesel competitors. However, provincial quotas, such as the limited number of vehicles in Bac Ninh, stifle broader adoption, resulting in lower ride densities outside the major cities. Although there's a push for a unified licensing criterion by 2025, provincial resistance over fee revenues has stalled the initiative, suggesting continued fragmentation at least until 2028.
Regulatory Landscape
Vietnam regulates app-based ride-hailing through the road-transport framework for contract passenger transport. Decree 158/2024/ND-CP (issued December 18, 2024, effective January 1, 2025) replaced Decree 10/2020/ND-CP and tightened operating conditions for commercial transport, including requirements tied to digital compliance such as journey monitoring, driver image-recording devices, and standardized e-invoicing. This raises the baseline for platform and fleet onboarding.
In 2026, the Government amended and reinforced enforcement tools around contract vehicles. Decree 218/2026/ND-CP (issued June 19, 2026, effective August 10, 2026) tightens management of contract vehicles and sets a path toward trip-level data sharing with the Traffic Police Department (Ministry of Public Security) starting January 1, 2028, increasing data-handling and reporting obligations for platforms and transport businesses. Decree 238/2026/ND-CP (effective August 15, 2026) amends the penalties regime for road transport, including higher penalties for contract vehicles operating in taxi-like, fixed-route patterns, with fines cited up to VND 14 million and license-point deductions. The change constrains informal pooling and fixed pick-up behaviors.
Value Chain Analysis
The Vietnam ride-hailing value chain starts with vehicle and energy inputs (motorbikes, cars, and increasingly EVs, plus charging and battery services), then moves through financing and leasing, driver acquisition and compliance onboarding, and platform operations (matching, pricing, routing, customer support, and fraud controls). Payment rails (e-wallets and QR, plus settlement) feed into service delivery and after-sales (insurance, maintenance, repairs, and driver welfare programs).
Decree 158/2024/ND-CP (effective January 1, 2025) adds compliance-related hardware and digital process requirements, including journey monitoring, driver image recording, and e-invoicing. These requirements sit upstream of service fulfillment and affect procurement and onboarding costs. Competitive differentiation increasingly hinges on control of fleet supply and operating cost levers. Xanh SM (GSM) runs a vertically integrated model anchored on VinFast vehicles and related charging infrastructure within the Vingroup ecosystem. Other major platforms lean more on partnerships: Be Group expanded its ecosystem approach via the BE5X Centre (June 2025), working with OEM and finance partners (including BYD, Great Wall Motor (Haval), Selex Motors, and VPBank) to bundle procurement, financing, and digital integration for drivers. This brings manufacturers, lenders, and energy partners closer to the core ride-hailing transaction, while also raising the capital and partnership thresholds needed to scale reliably beyond the largest cities.
Competitive Landscape
In 2025, Grab holds onto a dominant majority market share. However, Be Group's strides towards profitability and Xanh SM's swift expansion of electric vehicles (EVs) hint at vulnerabilities in Grab's stronghold. Leveraging its diverse portfolio, Grab uses profits from GrabFood and Moca to subsidize ride discounts. This strategy, coupled with loyalty points redeemable across its services, has significantly boosted active users year-over-year.
Be Group's BE5X is reshaping the landscape by vertically integrating driver leasing, insurance, and servicing. This approach aims to reduce driver churn, binding them to long-term packages. Yet, a notable attrition rate within the first few months highlights the delicate balance between offering flexibility and fostering loyalty. Meanwhile, Xanh SM's extensive fleet of electric cars boasts significantly lower per-kilometer costs compared to competitors. This cost advantage allows for meaningful fare discounts, a strategy that resonates well in price-sensitive secondary cities.
In response to market shifts, traditional taxi firms are adapting. Vinasun faced a substantial profit drop in early 2024, prompting a hybrid upgrade initiative funded partially through asset sales after TAEL Two Partners' exit at a loss. Recognizing the changing tides, Mai Linh formed a joint venture with GSM in 2024, launching Green MeKong SM and planning a network of EV workshops. This move underscores their acknowledgment of the declining economics of internal combustion engines (ICE) under the new tax regime. Meanwhile, niche players like inDrive, with its negotiable-fare model, and TADA, boasting a blockchain reputation system, collectively command a small market share. Their growth is hampered by user switching costs, which are closely tied to loyalty points and saved payment details. Looking ahead, a 2025 mandate for dedicated metro pick-up bays is set to benefit platforms with dynamic supply allocation capabilities. This advantage is predominantly held by Grab and Be, further solidifying their economies of scale.
Vietnam Ride-Hailing Industry Leaders
Xanh SM (GSM)
FastGo
GrabTaxi Holdings Pte Ltd
Be Group JSC
inDrive
- *Disclaimer: Major Players sorted in no particular order


Market Opportunities and Future Outlook
Electrification-led ecosystem buildouts are creating whitespace across vehicle access, charging, and two-wheeler cost reduction. In 2026, Grab disclosed initiatives linked to autonomous-vehicle and delivery-robot pilots in Vietnam and signed cooperation with local authorities (including the Hanoi Department of Construction) around green transport and charging infrastructure, indicating deeper coordination with city stakeholders rather than app-only competition. Be Group also reduced EV barriers for its driver base through partnerships that connect vehicle supply with energy convenience, including integrating battery-swapping touchpoints via a YADEA Vietnam tie-up.
At the same time, regulation is tightening operating models and placing more weight on compliant, data-ready platforms and fleets. Decree 218/2026/ND-CP (effective August 10, 2026) and Decree 238/2026/ND-CP (effective August 15, 2026) sharpen the distinction between legitimate contract transport and taxi-like fixed operations. They also set a forward requirement for trip-level contract data submission to the Traffic Police Department starting January 1, 2028. This increases the premium on operators that can standardize driver training, onboard monitoring equipment, and automate data exchange and e-invoicing at scale, while constraining informal shared-ride formats that mimic fixed-route services.
Recent Industry Developments
- July 2026: Grab announced a major scale-up plan for its electric-vehicle charging network in Vietnam, described as a fifteenfold expansion through 2028. The initiative supports faster EV adoption among driver-partners by reducing charging access constraints and positions Grab to compete more directly with vertically integrated EV-first operators.
- June 2026: Be Group signed a strategic partnership with YADEA Vietnam to increase the supply of electric motorcycles for its driver partners and to integrate YADEA battery-swapping locations into the Be app. By linking vehicle access with energy refueling convenience, the partnership targets lower total operating costs and improves utilization for two-wheeler e-hailing.
- April 2026: Xanh SM rebranded to Green SM to synchronize its brand identity globally. The consolidation of brand architecture supports cross-market expansion narratives and helps standardize customer trust and partner communications as the operator scales its EV ride-hailing model.


Research Methodology Framework and Report Scope
Market Definition and Coverage
This market covers paid passenger trips in Vietnam that are arranged through ride-hailing style booking flows, whether the trip is requested through an app or by phone, and then completed by a driver using an eligible vehicle.
Scope exclusions: Excludes standalone food, grocery, parcel, and courier deliveries that do not involve transporting a passenger.
Segmentation Overview
- By Vehicle Type
- Two-Wheelers
- Three-Wheelers
- Passenger Cars
- Vans & MPVs
- Buses & Shuttles
- By Propulsion Type
- Internal Combustion Engine (ICE)
- Hybrid
- Battery-Electric
- Compressed Natural Gas (CNG) / Liquefied Petroleum Gas (LPG)
- By Service Type
- E-Hailing
- Car-Sharing (Peer-to-Peer)
- Robo-Taxi
- Subscription-Based Ride Packages
- By Booking Channel
- App-Based
- Voice / Phone
- By End-User
- Personal
- Corporate / Institutional
Data Sources, Market Sizing, and Validation
Desk Research
Desk research was used to establish the fact base for demand, supply, and policy signals that shape paid on-demand trips in Vietnam. We reviewed public sources such as Vietnam government releases and transport policy notices, the General Statistics Office, and central bank or payments ecosystem publications that help interpret cashless usage patterns.
To anchor mobility activity, we also referred to sources such as customs and trade statistics for vehicle and parts flows, urban planning and transport infrastructure updates, and relevant academic or peer-reviewed work on urban mobility and mode choice in Vietnam. Company annual reports, public investor presentations, credible press coverage, and app ecosystem announcements were used to time-check fare changes and service rollouts. Where needed, we supplemented this with paid database access for company financials and intelligence, plus a news and financials database, to cross-verify revenue direction and ownership changes. These examples are not exhaustive, and many other public and subscription sources were also used for data collection, validation, and clarification.
Primary Interviews and Surveys
Primary work focused on validating trip economics and real demand behavior across major urban centers and secondary cities, since adoption and pricing can vary by locality. We spoke with a mix of platform-side, fleet and driver ecosystem participants, and corporate travel administrators, then ran follow-up checks to confirm how booking mix (app versus phone) and service formats are used in practice.
Distribution of primary research fieldwork respondents
| Company type | Respondent position |
|---|---|
| Top tier: 25% | CXOs: 14% |
| Mid tier: 61% | Functional/Unit leaders: 41% |
| Smaller Players: 14% | Managers: 45% |
Market-Sizing & Forecasting
Sizing starts with a demand-pool rebuild that links Vietnam urban mobility spend to digitally arranged paid trips. The model uses a top-down approach by translating active users and trip frequency into annual trip volume, then converting trips into value using observed fare levels and platform take-rate patterns. To keep the totals realistic, we also run selective bottom-up approximations, such as sampled city-level price checks, supply availability signals, and reasonableness tests against operator scale described in public materials.
Key inputs used in the model include smartphone and mobile internet adoption, cashless payment usage for transport, the mix of two-wheelers versus cars for ride-hailing trips, average trip distance and time proxies by city traffic conditions, regulatory changes affecting operating rules, and fuel and vehicle cost trends that influence driver participation. Forecasting relies mainly on scenario analysis, where base, conservative, and faster-adoption paths are built around expected changes in demand, pricing, and vehicle mix, then tuned using what industry respondents consider achievable. When local gaps appear in bottom-up checks, we apply simple fill methods using comparable city indicators and then re-test totals so outliers do not distort the national number.
Data Validation & Update Cycle
Outputs are validated through triangulation across independent signals, followed by variance checks at the year level and at major input-driver level, so we can see which assumption is moving the result. If an indicator changes sharply, such as a fare reset, a major policy update, or a step-change in vehicle mix, the team re-contacts sources to confirm what changed and whether the effect is temporary.
Before sign-off, the model and the written logic go through multiple analyst review steps, including checks for arithmetic, units, and currency handling. The report is refreshed annually, and interim updates are made when material market events occur. Right before delivery, a final pass is done so clients receive the most current view available at that time.
Mordor Intelligence's Vietnam Ride Hailing Market Size Versus Other Published Estimates
Published market sizes for Vietnam ride-hailing can look far apart, even when they cover the same country, because the service basket and the starting year are not always aligned. Differences also show up when some studies treat related mobility revenues as part of ride-hailing, or when they use a more aggressive adoption curve for later years.
Food delivery and other non-passenger on-demand services sit outside Mordor Intelligence's scope, which is one reason the 2025 value below can look lower than estimates that roll multiple super-app revenue streams into one headline number.
Benchmark comparison
| Source | Market Size | Gaps in Research Methodology |
|---|---|---|
| Mordor Intelligence | USD 1.06 B (2025) | |
| Global Consultancy A | USD 1.70 B (2024) | Uses a different base year and appears to rely on broader ride-hailing revenue framing that may blend adjacent on-demand categories, which can inflate the headline versus passenger-trip-only value. |
| Market Analytics B | USD 2.14 B (2024) | Starts from a higher 2024 benchmark and carries a longer forecast window, and the visible scope description is not tight on what is excluded, so related mobility revenues and differing price assumptions can widen the estimate. |
Reading the table together, the spread is mainly explained by what each publisher counts as ride-hailing revenue and which year they anchor as the current market size. Our process keeps the number traceable to clear demand drivers, trip-level economics, and repeatable checks, which helps keep assumptions visible when the market is moving quickly.


Key Questions Answered in the Report
How big is the Vietnam ride-hailing market in 2026?
The Vietnam ride-hailing market size stands at USD 1.25 billion in 2026 and is forecast to reach USD 3.04 billion by 2031.
What is the projected growth rate for Vietnam’s ride-hailing sector?
The market is projected to post a 19.53% CAGR between 2026 and 2031.
Which vehicle type leads booking volumes?
Two-wheelers hold a 61.36% share in 2025 because motorcycles navigate Vietnam’s narrow urban lanes more efficiently than cars.
Why are electric cars scaling quickly in Vietnamese ride-hailing fleets?
Registration-fee waivers and 1-3% consumption tax under Decree 51/2025 compress EV pay-back periods to under three years, encouraging operators such as Xanh SM to deploy large electric fleets.
Which companies are challenging Grab’s dominance?
Be Group has reached profitability through subscription bundles, while Xanh SM leverages an all-electric fleet to undercut fares, gradually eroding Grab’s 70%-plus share.
How are corporate users influencing market dynamics?
Corporations replacing owned cars with ride-hailing subscriptions are driving a 19.59% CAGR in enterprise accounts, boosting average trip values and stabilizing demand for operators.
Page last updated on:


 Your data is secure and never sold or shared.


