Africa Ride-Hailing Market Size and Share
Market Overview
| Study Period | 2020 - 2031 |
|---|---|
| Forecast Data Period | 2026 - 2031 |
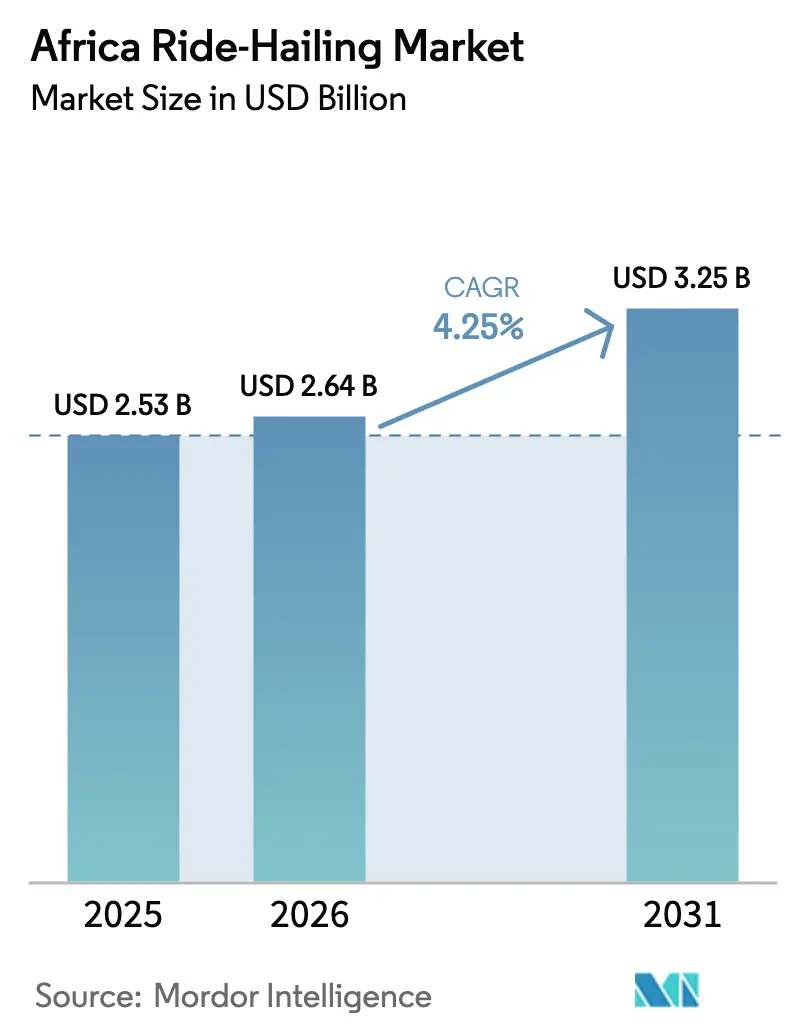
| Base Year Market Size (2025) | USD 2.53 Billion |
| Market Size (2026) | USD 2.64 Billion |
| Market Size (2031) | USD 3.25 Billion |
| Growth Rate (2026 - 2031) | 4.25% CAGR |
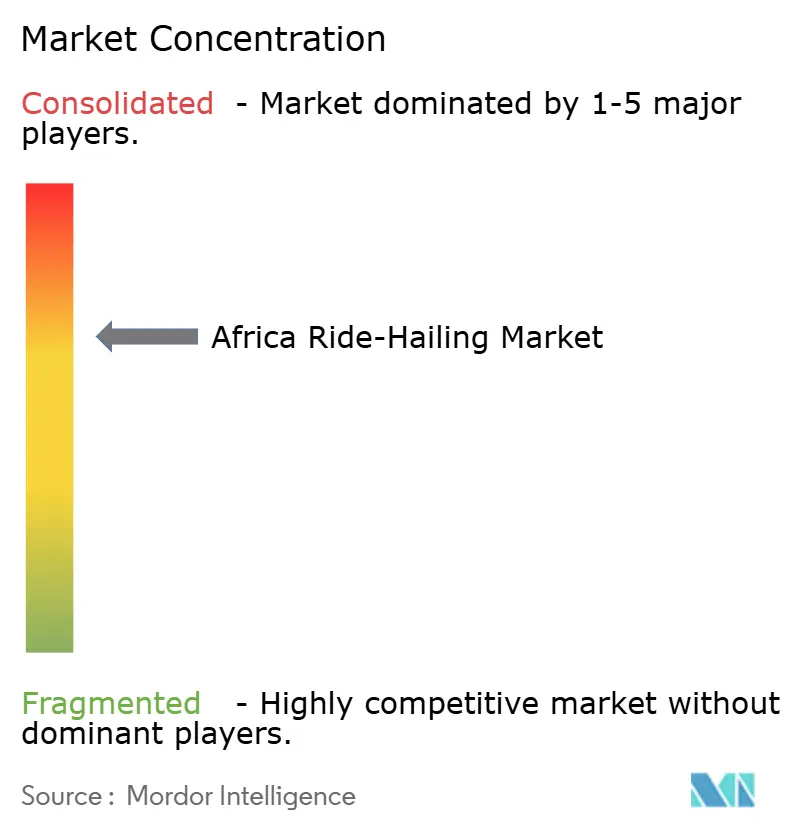
| Market Concentration | Medium |
Major Players *Disclaimer: Major Players sorted in no particular order Image © Mordor Intelligence. Reuse requires attribution under CC BY 4.0. | |
Africa Ride-Hailing Market Analysis by Mordor Intelligence
The African ride-hailing market size is expected to grow from USD 2.53 billion in 2025 to USD 2.64 billion in 2026 and is forecast to reach USD 3.25 billion by 2031 at 4.25% CAGR over 2026-2031. Growth is anchored in widening smartphone ownership, flourishing mobile‐money ecosystems, and venture funding that targets digital mobility solutions. Motorcycles remain the preferred vehicle class because they overcome road congestion and limited parking space in large cities. East Africa benefits from supportive e-mobility policies, while Southern Africa capitalises on comparatively mature financial infrastructure. Platform competition is intensifying as operators refine commission models, prioritise driver welfare, and pilot electric two-wheeler fleets.
Key Report Takeaways
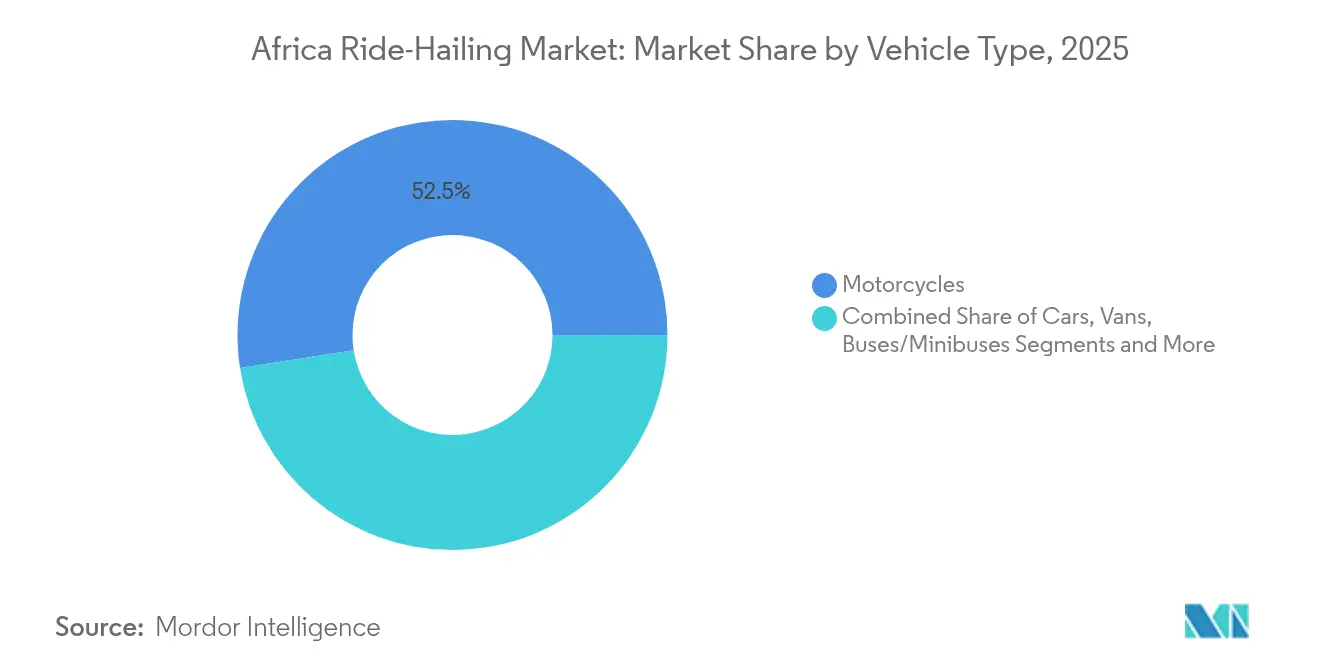
- By vehicle type, motorcycles captured 52.45% of Africa's ride-hailing market share in 2025; electric motorcycles are set to grow at 11.5% CAGR between 2026-2031.
- By propulsion, internal combustion engines accounted for 88.74% of the African ride-hailing market size in 2025; electric propulsion records the fastest growth at 11.45% CAGR.
- By service model, on-demand point-to-point rides held 79.95% of the African ride-hailing market size in 2025, while subscription models exhibit a 9.15% CAGR through 2031.
- By end-user, individual consumers represented 83.98% revenue share in 2025; the corporate segment advances at a 6.85% CAGR.
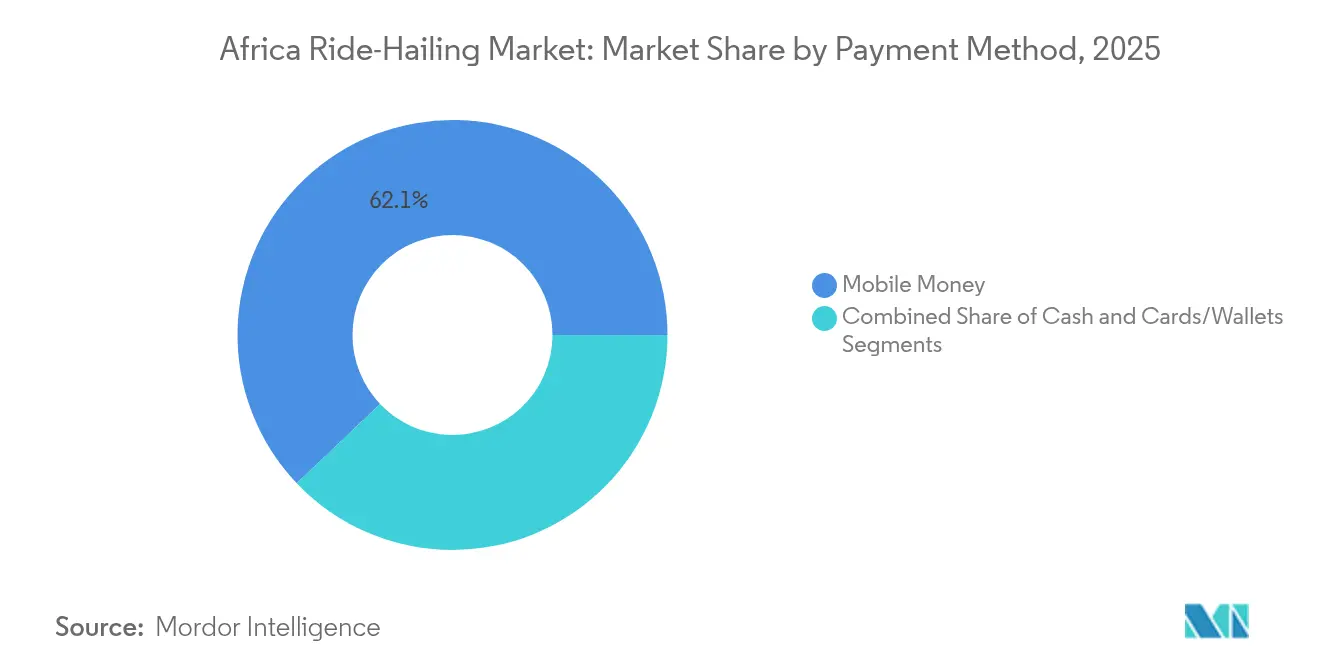
- By payment method, mobile money processed 62.10% of the African ride-hailing market size in 2025; cards and wallets grow at a 6.05% CAGR.
- By platform type, app-based aggregators retained a 92.15% share in 2025 with a 7.55% CAGR outlook.
- By region, Southern Africa led with 27.72% revenue share in 2025; East Africa is projected to expand at a 6.18% CAGR to 2031.
Note: Market size and forecast figures in this report are generated using Mordor Intelligence’s proprietary estimation framework, updated with the latest available data and insights as of 2026.
Africa Ride-Hailing Market Trends and Insights
Drivers Impact Analysis*
| Driver | (~) % Impact on CAGR Forecast | Geographic Relevance | Impact Timeline |
|---|---|---|---|
| Smartphone and Mobile-Money Penetration | +1.8% | East, West, Southern Africa | Medium term (2-4 years) |
| Rapid Urbanisation and Congestion | +1.2% | Lagos, Nairobi, Johannesburg, Cairo | Long term (≥ 4 years) |
| Venture-Capital Inflows | +0.9% | Nigeria, Kenya, South Africa, Egypt | Short term (≤ 2 years) |
| Formalisation of Informal Transit | +0.7% | West Africa, East Africa | Long term (≥ 4 years) |
| Micro-EV Economics for Two-Wheeler Fleets | +0.5% | East Africa, Southern Africa | Medium term (2-4 years) |
| Telco Super-Apps Bundling Transport | +0.4% | Kenya, Nigeria, Ghana | Medium term (2-4 years) |
| Source: Mordor Intelligence | |||
Smartphone and Mobile-Money Penetration Surge
Robust 4G rollout is pushing smartphone connections toward a 50% share of total mobile lines by 2030, while mobile-money transactions underpin frictionless in-app payments that sidestep limited card infrastructure. Alternative payment methods already drive 69% of digital commerce, creating a ready user base for cash-free ride booking[1]“Mobile Economy Sub-Saharan Africa 2024,” GSMA, gsma.com. Expanding digital channels also enlarge the talent pool for drivers who can enrol, verify identity, and receive earnings entirely on mobile devices.
Rapid Urbanisation and Traffic Congestion
Africa's urbanization rate creates a structural demand shift toward ride-hailing services as traditional public transport systems struggle with capacity constraints. Sub-Saharan Africa’s cities grow by nearly 4% per year, outpacing public-transport upgrades and worsening peak-hour delays. Motorcycles cut point-to-point travel times in congested corridors and offer first-mile/last-mile connectivity where buses do not operate[2]Emilie Martin et al., “Motorcycle Taxis in Transition? Digitalisation and Electrification in East African Capitals,” Sciencedirect, sciencedirect.com. Informal two-wheeler services have thus become indispensable for women and low-income workers in cities such as Kampala.
Venture-Capital Inflows into Mobility Tech
Dedicated mobility funds and corporate investors channel capital toward fleet-financing and battery-swap infrastructure. Notable deployments include USD 100 million investment in Moove to boost vehicle supply and expand credit scoring for drivers. Capital injections accelerate fleet renewal, promote safety features, and lower entry barriers for new drivers. Yango Group's launch of a USD 20 million corporate venture fund targeting early-stage startups in the Middle East, North Africa, and Sub-Saharan Africa further validates the investment thesis.
Formalisation of Informal Transit
Government initiatives to formalize informal transport systems create structured growth opportunities for ride-hailing platforms while addressing regulatory compliance concerns. The African Union’s 2024 Startup Model Law encourages consistent licensing frameworks for app-based mobility while safeguarding worker rights. City-level rules in Lagos in 2025, signal a tilt toward regulated employment structures that promote insurance coverage and tax compliance. The formalization trend creates opportunities for platforms that can navigate complex regulatory environments while providing structured employment alternatives to informal transport operators.
Restraints Impact Analysis*
| Restraint | (~) % Impact on CAGR Forecast | Geographic Relevance | Impact Timeline |
|---|---|---|---|
| Fragmented and Evolving Municipal Regulations | -0.8% | Lagos, Nairobi, Johannesburg, Cairo | Short term (≤ 2 years) |
| Driver Activism Against Commission Models | -0.6% | West Africa, Central Africa | Long term (≥ 4 years) |
| Road-Safety Liabilities & High Accident Rates | -0.4% | Kenya, Nigeria, South Africa | Short term (≤ 2 years) |
| Grid Unreliability Slowing E-Mobility Rollout | -0.3% | Nigeria, Ghana, Angola | Medium term (2-4 years) |
| Source: Mordor Intelligence | |||
Fragmented and Evolving Municipal Regulations
Mobility platforms grapple with a significant hurdle, the fragmented and ever-evolving municipal regulations. These regulations, differing from city to city, necessitate tailored operational models. This customization not only complicates operations but also compels companies to shell out multiple local licensing fees, thereby eroding potential economies of scale. In this intricate regulatory maze, some jurisdictions champion benefits for gig workers, while others enforce local ownership quotas or insist on integration with regional infrastructure.
Driver Activism against Commission Models
Driver organization and activism against platform commission structures represents a fundamental challenge to traditional ride-hailing business models across Africa. Organised driver unions in markets such as Kenya demand reduced platform deductions and more transparent pricing. Collective bargaining raises operating costs for aggregators and encourages experimentation with zero-commission or fixed-fee structures to retain supply.
*Our forecasts treat driver/restraint impacts as directional, not additive. The impact forecasts reflect baseline growth, mix effects, and variable interactions.
Segment Analysis
By Vehicle Type: Motorcycles Anchor Urban Mobility
Motorcycles accounted for 52.45% of the African ride-hailing market share in 2025, and is expected to expand at 11.5% CAGR, reflecting Africa's unique urban mobility requirements where two-wheelers navigate congested streets more efficiently than four-wheeled vehicles. Their manoeuvrability and lower acquisition cost underpin widespread adoption, while pilot schemes for battery swapping and solar charging accelerate electrification.
Cars maintain a secondary position in the market, primarily serving premium segments and corporate clients, while vans and buses serve specific logistics and mass transit applications. Three-wheelers occupy a niche position in markets like Nigeria and Kenya, where they provide intermediate capacity between motorcycles and cars. The introduction of mobile internet has enabled a second wave of growth in the motorcycle segment, allowing these vehicles to function as productivity tools and delivery services beyond traditional passenger transport.


By Propulsion: Electric Gains Momentum
Internal‐combustion engines preserved 88.74% of Africa's ride-hailing market size in 2025, but their share declines as governments incentivise low-emission fleets. Kenya’s 85% renewable-energy mix reduces charging costs and positions electric bikes as income multipliers for drivers. Hybrid drivetrains remain niche primarily due to higher initial costs and limited maintenance infrastructure across most African markets.
Electric propulsion represents the fastest-growing segment at 11.45% CAGR for 2026-2031, driven by government initiatives and economic incentives that make electric vehicles increasingly attractive for commercial operators. Rwanda's comprehensive e-mobility strategy aims to convert 100,000 motorbikes to electric, supported by innovative solutions like solar-powered charging stations and battery swapping to address grid reliability challenges.
By Service Model: On-Demand Dominance, Subscription Upside
On-demand rides generated 79.95% of the African ride-hailing market size in 2025. Instant booking meets flexible travel patterns in informal economies, especially for shift workers. The on-demand model's success reflects broader consumer behavior patterns across Africa, where informal economic activities require flexible transport solutions that can adapt to varying schedules and destinations. Subscription bundles gain traction among corporates that view predictable monthly fees as an alternative to fleet ownership.
The subscription segment is forecast to expand at 9.15% CAGR, doubling revenue by 2031. Subscription models gain traction among corporate clients seeking to provide employee transport benefits while maintaining cost control, particularly in markets like South Africa and Kenya where formal employment sectors are more developed. The service model segmentation indicates market maturation, with platforms beginning to offer differentiated service tiers to capture diverse consumer segments and use cases across the continent.
By End-User: Individuals Rule, Corporates Accelerate
Individual passengers contributed 83.98% of the 2025 Africa ride-hailing market revenue, reflecting the consumer-centric nature of ride-hailing adoption across the country's diverse urban markets. Widespread mobile-money acceptance and pay-as-you-go pricing align with personal cash-flow realities. Corporates and institutions grow faster at 6.85% CAGR as employers outsource staff shuttles for duty of care and cost transparency.
Individual consumer dominance stems from ride-hailing's ability to serve diverse personal mobility needs, from daily commuting to social and emergency transport requirements. The segment benefits from mobile money integration, with nearly half of the transactions processed through mobile money platforms that align with individual consumer payment preferences. Corporate adoption accelerates as companies recognize ride-hailing's advantages over traditional employee transport methods, including reduced liability, improved safety tracking, and cost transparency.
By Payment Method: Mobile Money Prevails
Mobile money processed 62.10% of 2025 Africa ride-hailing market share. The mobile money ecosystem's integration with ride-hailing platforms creates operational efficiencies that reduce transaction costs and improve service accessibility. Cash payments maintain a significant but declining position, primarily in markets with lower digital payment penetration or among demographic segments with limited smartphone access.
Cards and wallets represent the fastest-growing payment segment at 6.05% CAGR for 2026-2031. Card and digital-wallet penetration rise in tandem with smartphone upgrades. This growth indicates market sophistication, particularly in urban centers where consumers adopt multiple payment options for different transaction types and service providers.
By Platform Type: Aggregators Consolidate
App-based aggregators controlled 92.15% of the 2025 Africa ride-hailing market share, while maintaining 7.55% CAGR for 2026-2031. This dominance reflects consumer preference for smartphone-based booking systems that provide real-time tracking, cashless payments, and driver verification features. Feature extensions toward food delivery and bill payment increase daily active minutes, bolstering network effects. Legacy radio dispatch persists only in areas with low smartphone density.
App-based platforms' success stems from their ability to address key consumer concerns around safety, pricing transparency, and service reliability that traditional dispatch services struggle to provide. The growth rate indicates continued platform innovation and market expansion rather than displacement, as app-based aggregators penetrate new geographic markets and demographic segments across the continent.
Geography Analysis
Southern Africa captured 27.72% of 2025 Africa ride-hailing market share, anchored by South Africa’s advanced banking rails and dense smartphone coverage. Ride-hailing demand is concentrated in Gauteng and Western Cape, where commuting distances are long and public buses are unreliable. Currency volatility remains a risk to discretionary spending, yet ongoing urban renewal projects enlarge serviceable zones.
East Africa records the fastest 6.18% CAGR for 2026-2031. Kenya leads through supportive renewable-energy policy that cuts charging cost for electric fleets. Rwanda’s battery-swap corridors, mapped to solar micro-grids, lower range anxiety for motorcycle operators. Uganda and Tanzania adopt similar models, using mobile-money APIs to automate battery rental payments.
West Africa, spearheaded by Nigeria, offers scale but faces complex licensing regimes. Lagos discusses mandatory health insurance for drivers, which could increase compliance costs yet improve welfare. Ghana benefits from cross-border mobile-money interoperability that eases driver remittances, while Senegal courts francophone platforms with tax holidays. Central Africa trails in absolute volume due to smaller urban clusters and limited road quality, but cities such as Douala and Kinshasa demonstrate latent demand whenever data networks improve. North African markets remain attractive; however, subsidy reforms for fuel and electricity introduce unpredictability in fare structures.
Competitive Landscape
Uber Technologies leverages global engineering, in-house mapping, and dedicated fleet-financing partners to maintain a significant revenue share. Its collaboration with Moove expands vehicle supply and embeds credit underwriting within the app. Bolt Technology follows; it differentiates via low commission tiers and has earmarked EUR 500 million for driver onboarding and courier expansion.
inDrive distinguishes itself with a negotiation-based fare model that appeals to price-sensitive riders. The strategy boosted downloads to record positions in Egypt. Yango advances through a hyper-local playbook, integrating language packs and region-specific loyalty programmes. Local entrants such as Twytch test fixed-rate structures, aiming to resolve driver concerns over volatile take-home pay.
All major platforms pilot electric two-wheeler leasing in Kigali, Nairobi, and Kampala. Partnerships with battery-swap operators help reduce downtime. Several aggregators also roll out driver-focused fintech products such as micro-insurance and high-yield wallets to reinforce retention. Regulatory diplomacy is a key competitive lever. Operators engage city councils to shape safety standards and clarify tax duties. Those able to integrate digital driver verification and medical benefits improve compliance prospects and bolster brand equity.
Africa Ride-Hailing Industry Leaders
Uber Technologies Inc.
Bolt Technolgy
inDrive (SUOL INNOVATIONS LTD)
Yango Group
Little Limited
- *Disclaimer: Major Players sorted in no particular order

Recent Industry Developments
- March 2025: Yango Group launched Yango Ventures, a USD 20 million fund supporting mobility, fintech, and B2B software startups across Africa and the Middle East.
- January 2025: Twytch debuted in South Africa with a fixed-rate driver payout model supported by blockchain-based identity verification.
- October 2024: inDrive entered Zambia with a zero-commission offer for the first six months to accelerate driver onboarding.
- March 2024: Uber led a USD 100 million round in Moove, lifting the vehicle-financing startup’s valuation to USD 750 million.


Research Methodology Framework and Report Scope
Market Definitions and Key Coverage
Our study defines Africa's ride-hailing market as every smartphone-mediated, point-to-point passenger trip completed by licensed drivers on two, three, or four-wheel motor vehicles, with fares paid in cash or through mobile money inside all fifty-four nations. We track yearly gross booking value in constant 2024 US dollars, which lets users see genuine spending trends.
Scope Exclusion: informal street-hail motorcycle rides that bypass any digital platform are not counted.
Segmentation Overview
- By Vehicle Type
- Motorcycles
- Cars
- Vans
- Buses/Minibuses
- Three-Wheelers
- By Propulsion
- Internal Combustion Engine (ICE)
- Electric
- Hybrid
- By Service Model
- On-Demand (Point-to-Point)
- Scheduled / Shared Shuttle
- Subscription-based
- By End-User
- Individual Consumers
- Corporate & Institutional
- By Payment Method
- Cash
- Mobile Money
- Cards / Wallets
- By Platform Type
- App-based Aggregators
- Traditional Dispatch Services
- By Region
- North Africa
- Egypt
- Morocco
- Algeria
- Tunisia
- West Africa
- Nigeria
- Ghana
- Senegal
- Cote dIvoire
- East Africa
- Kenya
- Uganda
- Tanzania
- Ethiopia
- Central Africa
- Cameroon
- DR Congo
- Angola
- Southern Africa
- South Africa
- Botswana
- Namibia
- Zimbabwe
- North Africa
Detailed Research Methodology and Data Validation
Primary Research
Mordor analysts interviewed platform managers, driver-union leaders, transport economists, and fintech experts across East, West, and Southern Africa. Their insights confirmed adoption rates, commission rules, and electric-fleet timelines that open data left vague.
Desk Research
We began by pulling regulator statistics from the South African National Transport Department, Nigeria's National Bureau of Statistics, and Kenya's Communications Authority that spell out trip counts, smartphone adoption, and wallet volumes. Trade bodies such as the African Association of Public Transport, Volza customs records, Questel patent logs, and Dow Jones Factiva news archives then helped us map fleet additions, import flows, and operator revenues. These names illustrate, not exhaust, the reference stack we used.
Market-Sizing & Forecasting
We open with a top-down demand pool of urban population multiplied by annual trips per head and by median fare, then adjust it for payment mix, vehicle mix, and platform commission. Select bottom-up operator roll-ups pressure-test the totals. Key variables inside a multivariate regression with ARIMA overlays include smartphone penetration, mobile-money transactions, fuel prices, and electric two-wheeler imports, while peer ratios bridge country gaps when direct data are thin.
Data Validation & Update Cycle
Each quarter, our team benchmarks outputs against fresh ride disclosures, shipment data, and macro signals, rechecking any variance above three points. Results pass two layers of peer review, and every report refreshes annually or sooner if material events demand.
Why Mordor's Africa Ride-Hailing Baseline Commands Reliability
Published figures often differ because some publishers fold Middle East revenue, shift base years, or ignore cash rides.
Our disciplined scope, constant-currency reporting, and on-ground validation narrow those gaps.
Benchmark comparison
| Market Size | Anonymized source | Primary gap driver |
|---|---|---|
| USD 2.53 B (2025) | Mordor Intelligence | - |
| USD 2.85 B (2024) | Regional Consultancy A | Africa average used, scant field work |
| USD 1.60 B (2024, MEA) | Global Consultancy B | Wider region, cash fares omitted |
Together, the comparison shows that our live data audits and yearly refresh give decision-makers a balanced, transparent baseline they can trust.


Key Questions Answered in the Report
What is the current size of the Africa ride-hailing market?
The market is valued at USD 2.64 billion in 2026 and is projected to climb to about USD 3.25 billion by 2031.
Which vehicle type dominates Africa’s ride-hailing services?
Motorcycles hold 52.45% of 2025 revenue because they navigate congested city streets faster and cost less to operate than cars.
How fast is the electric segment growing in African ride-hailing?
Electric two-wheelers are advancing at an 11.45% CAGR for 2026-2031, supported by battery-swap corridors and supportive policy pilots.
Why is mobile money so important to ride-hailing growth?
Mobile money accounts for 62.10% of transactions, enabling cashless payments in regions where traditional card infrastructure is limited.
Which African sub-region is growing the fastest for ride-hailing services?
East Africa posts the highest growth, with a 6.18% CAGR forecast from 2026-2031 due to supportive e-mobility policies and strong mobile-money ecosystems.
Page last updated on:


