
Next Generation Biometric Market Size and Share
Market Overview
| Study Period | 2020 - 2031 |
|---|---|
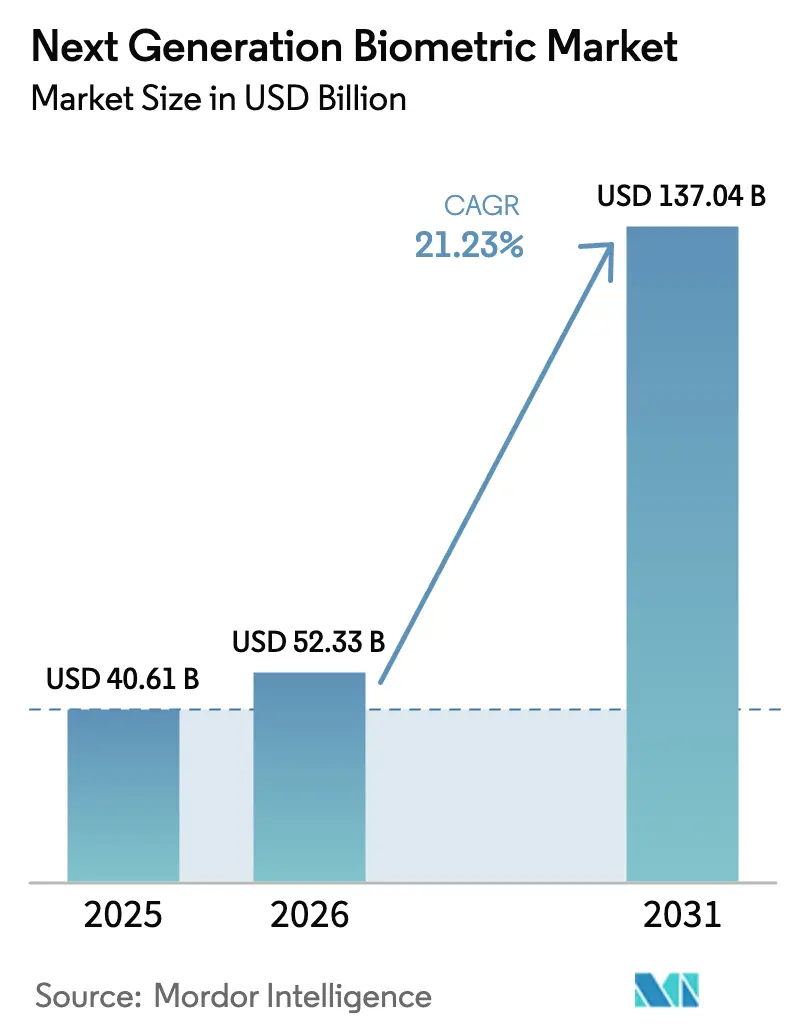
| Market Size (2026) | USD 52.33 Billion |
| Market Size (2031) | USD 137.04 Billion |
| Growth Rate (2026 - 2031) | 21.23 % |
| Fastest Growing Market | Middle East |
| Largest Market | Asia Pacific |
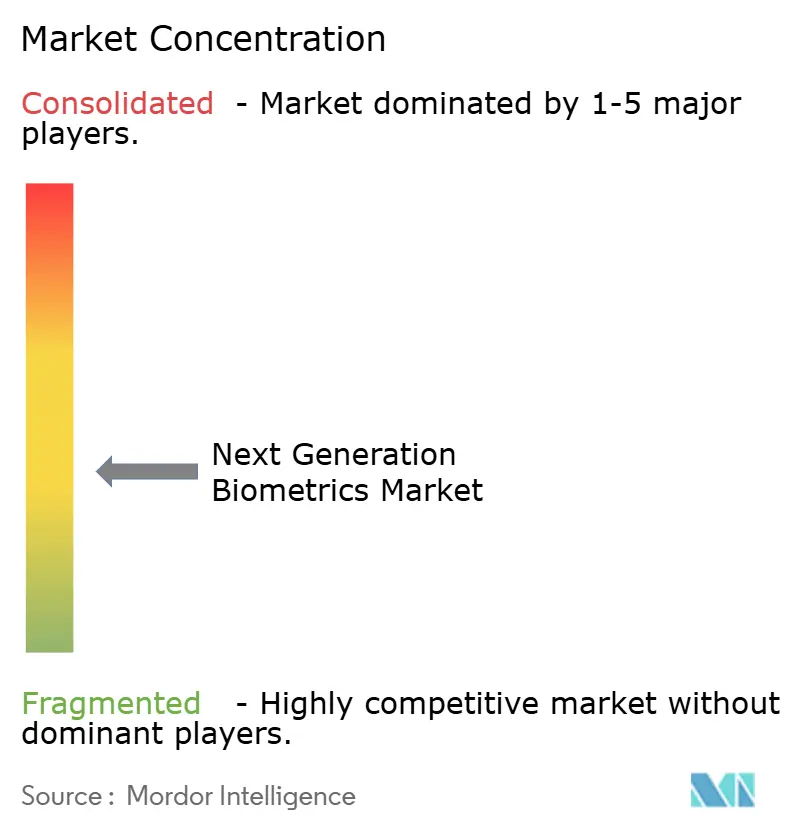
| Market Concentration | Medium |
Major Players *Disclaimer: Major Players sorted in no particular order Image © Mordor Intelligence. Reuse requires attribution under CC BY 4.0. | |
Next Generation Biometric Market Analysis by Mordor Intelligence
The next generation biometric market size is projected to be USD 40.61 billion in 2025, USD 52.33 billion in 2026, and reach USD 137.04 billion by 2031, growing at a CAGR of 21.23% from 2026 to 2031. Momentum stems from sovereign digital-identity mandates, smartphone integration, and contact-free modalities that reduce hygiene risks while enhancing security. Governments are accelerating procurement that was previously planned for later years, and enterprises are matching that pace to satisfy users who now expect tap-and-go authentication everywhere. Hardware commoditization is driving vendors toward service subscriptions, while competitive pressure is shifting algorithm processing from the cloud to the device edge. Finally, supply chain bottlenecks for near-infrared sensors and expanding litigation over algorithmic bias are compressing margins, yet simultaneously driving consolidation among vendors that can navigate regulatory and sourcing complexity.
Key Report Takeaways
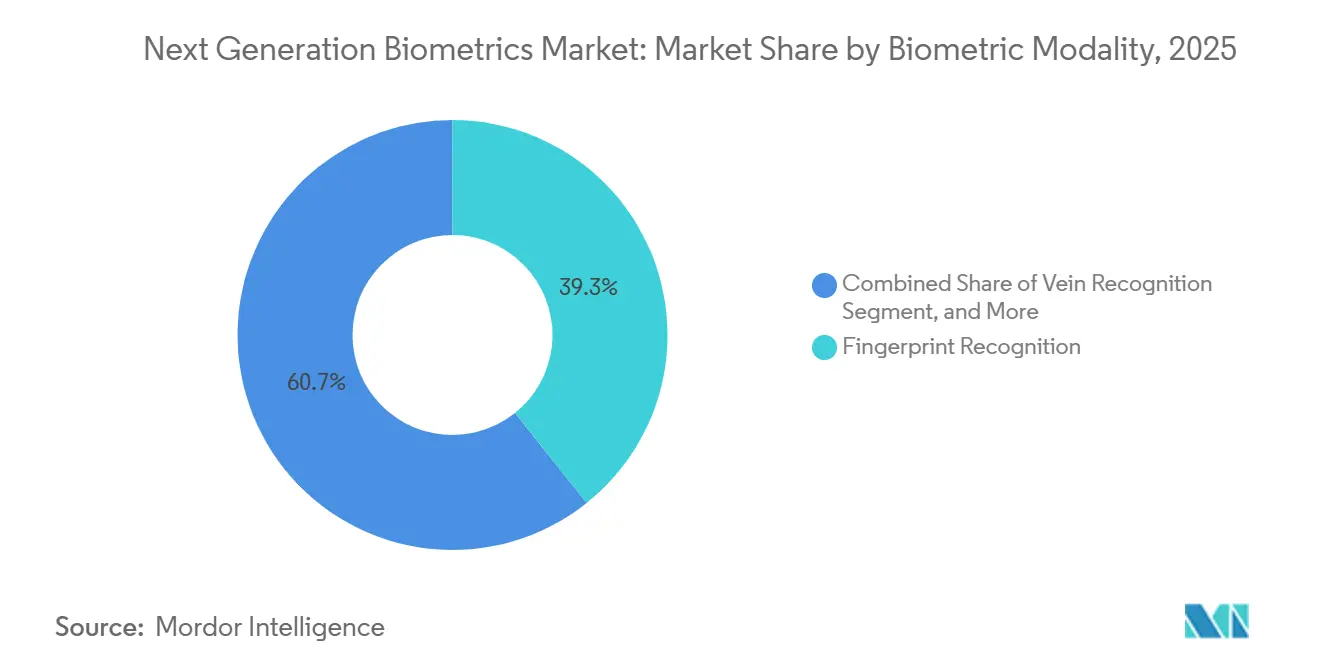
- By biometric modality, fingerprint recognition led with a 39.26% share of the next generation biometric market in 2025, while vein recognition is forecast to register a 22.83% CAGR through 2031.
- By component, hardware accounted for 63.78% of revenue in 2025, whereas services are expected to expand at a 21.77% CAGR through 2031.
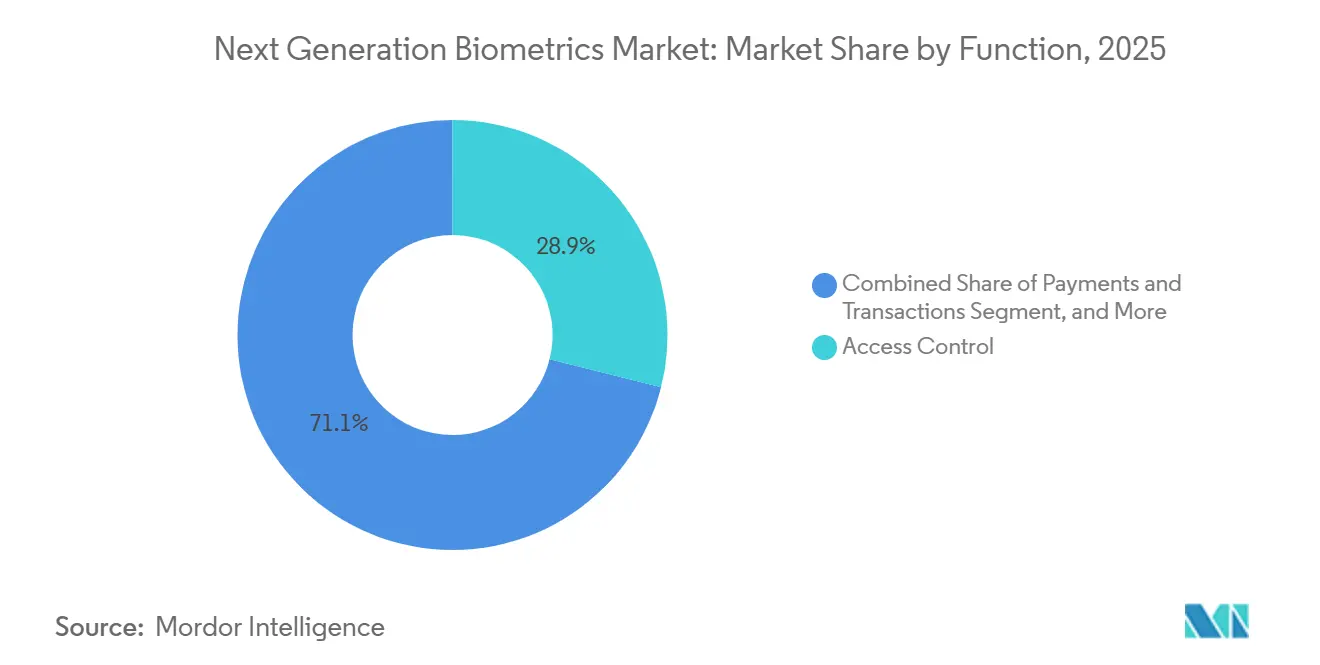
- By function, access control held a 28.91% share of the next generation biometric market size in 2025, and payments and transactions are expected to advance at a 22.67% CAGR through 2031.
- By end-user industry, the government accounted for a 32.83% share in 2025, and the healthcare sector is expanding at a 23.04% CAGR through 2031.
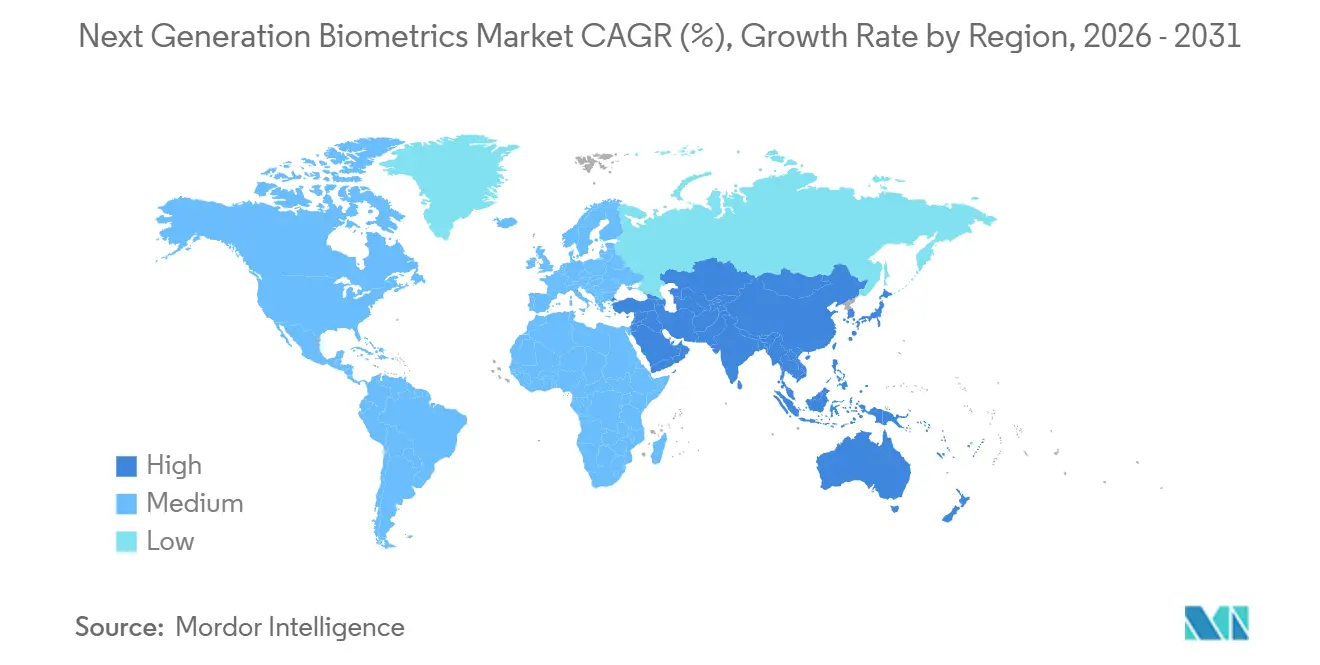
- By geography, Asia-Pacific accounted for 36.84% of revenue in 2025, while the Middle East is projected to grow at a 22.19% CAGR over the same period.
Note: Market size and forecast figures in this report are generated using Mordor Intelligence’s proprietary estimation framework, updated with the latest available data and insights as of January 2026.
Market Trends and Insights
Drivers Impact Analysis of Next Generation Biometric Market*
| Driver | (~) % Impact on CAGR Forecast | Geographic Relevance | Impact Timeline |
|---|---|---|---|
| Expansion of e-passport programs | +3.8% | Global, early adoption in Europe, Middle East, Asia-Pacific | Medium term (2-4 years) |
| Integration of biometrics in smartphones | +4.2% | Global, led by North America, Europe, Asia-Pacific | Short term (≤ 2 years) |
| Government-mandated national ID rollouts | +4.5% | Asia-Pacific core, Middle East, Africa, Latin America | Medium term (2-4 years) |
| Advancements in contactless 3D vein imaging | +2.1% | Asia-Pacific (Japan, South Korea), Europe | Long term (≥ 4 years) |
| Rise of decentralized blockchain identity | +1.9% | North America, Europe, pilot projects in Asia-Pacific | Long term (≥ 4 years) |
| Multimodal biometrics for remote work | +2.7% | Global, concentrated in North America and Europe | Short term (≤ 2 years) |
| Source: Mordor Intelligence | |||
Government-Mandated National ID Rollouts
National programs are transforming optional digital IDs into mandatory public infrastructure that buffers vendors from cyclical IT spending. India expanded face-based Aadhaar authentication to private entities in 2025, enabling fintech onboarding without the need for paper documents.[1]Unique Identification Authority of India, “Aadhaar Face Authentication,” uidai.gov.in The European Union aims to have interoperable biometric wallets for all citizens by 2026, shifting liability for breaches from states to certified wallet providers. Nigeria and Kenya are following similar paths, backed by multilateral funding, which creates guaranteed demand for fingerprint and iris sensors. These high-volume procurements shorten vendor payback periods and lift the overall next generation biometric market.
Integration of Biometrics in Smartphones
Mobile devices are setting new performance baselines that ripple into enterprise expectations. Samsung’s Galaxy S25 ultrasonic sensor achieves a false reject rate of less than 1% and meets EMVCo payment standards.[2]Samsung Electronics, “Galaxy S25 Ultrasonic Fingerprint Sensor,” samsung.com Qualcomm’s larger 3D Sonic Max allows two-finger verification, targeting high-value transactions. Apple’s Face ID keeps all processing within its Secure Enclave, aligning with GDPR data-minimization rules. As consumers unlock phones thousands of times a year, sectors such as banking and healthcare must match that frictionless experience, accelerating adoption across the next generation biometric market.
Advancements in Contactless 3D Vein Imaging
Vein recognition is overcoming hygiene and spoofing hurdles that linger around fingerprint and face systems. Fujitsu’s PalmSecure reached more than 80 Japanese banks by 2025 with a 0.00008% false-acceptance rate.[3]Fujitsu Limited, “PalmSecure Banking Deployments,” fujitsu.com Hitachi’s finger-vein device reads up to 10 centimeters away, making it ideal for use in infection-control zones. Academic work shows 3D vein reconstruction thwarts spoofing tools that fool 2D algorithms. With minimal privacy opposition and superior accuracy, vein solutions command premium prices, broadening the value pool inside the next generation biometric market.
Expansion of E-Passport Programs
The International Civil Aviation Organization has finalized Digital Travel Credential specifications that enable nations to embed face and iris templates in mobile passports. Member states plan to replace booklet checks with tap-to-verify smartphone tokens, pulling forward demand for multimodal readers at airports. The switch reduces traveler processing time and supports traffic growth without gate expansion, prompting airports to upgrade to biometric e-gates faster than originally budgeted.
Restraints Impact Analysis of Next Generation Biometric Market*
| Restraint | (~) % Impact on CAGR Forecast | Geographic Relevance | Impact Timeline |
|---|---|---|---|
| Privacy and civil-liberty concerns | -2.8% | Global, most acute in Europe and North America | Short term (≤ 2 years) |
| High upfront system costs | -2.3% | Africa, Latin America, Southeast Asia | Medium term (2-4 years) |
| Algorithmic bias driving stricter regulation | -1.9% | North America, Europe, spillover to Asia-Pacific | Medium term (2-4 years) |
| Supply-chain shortages of near-IR sensors | -1.6% | Global, concentrated impact in Asia-Pacific manufacturing | Short term (≤ 2 years) |
| Source: Mordor Intelligence | |||
Privacy and Civil-Liberty Concerns
Special-category status under the GDPR requires explicit consent and strict security measures, leading to multimillion-euro fines for non-compliance, as seen in the Clearview AI case. The EU AI Act now bans most real-time public face scans, and California residents can opt out of non-essential biometric use. Civil-rights groups continue to highlight disproportionate impact on minorities, prompting city-level bans. Vendors must therefore maintain country-specific software builds, which raises compliance costs and slows rollouts in the next generation biometric market.
Algorithmic Bias Driving Stricter Regulation
NIST tests still show error-rate gaps as high as 100-fold across demographics. Wrongful arrest lawsuits have increased legal exposure, prompting insurers to exclude biometric liabilities. The EU AI Act classifies border and law enforcement biometrics as high-risk, mandating third-party audits that can add up to 18 months before revenue can begin. Procurement teams now demand indemnification clauses, shifting liability to suppliers and discouraging smaller entrants, a drag on overall next generation biometric market growth.
*Our forecasts treat driver/restraint impacts as directional, not additive. The impact forecasts reflect baseline growth, mix effects, and variable interactions.
Next Generation Biometric Market Segment Analysis
By Biometric Modality:
Vein Recognition Gains Ground on Fingerprint DominanceFingerprint systems accounted for 39.26% of the next generation biometric market share in 2025, benefiting from long-established bases and low sensor prices. However, vein recognition is charting a 22.83% CAGR thanks to contactless capture and near-zero spoofing risk, positioning it to chip away at the entrenched modality. Fujitsu’s PalmSecure rollouts in Japanese banking and Hitachi’s hospital deployments illustrate real-world momentum. Face recognition remains ubiquitous in travel and smartphones, while iris recognition stays focused on defense and refugee management, where its low false-match rate justifies the higher costs. Palm-print, gait, voice, and behavioral systems each fill niche needs, and multimodal platforms are emerging to blend strengths and mask weaknesses. As enterprises evaluate upgrades, the next generation biometric market size for multimodal solutions is expected to widen, reflecting growing confidence in layered security.
Second-generation ultrasonic palm-print sensors, patented by Samsung, hint at a future convergence, allowing a single gesture to satisfy both hygiene and accuracy requirements. Voice recognition adoption is throttled by deepfake risks unless paired with liveness checks. Meanwhile, behavioral biometrics from firms such as BioCatch supply continuous authentication during a user session, reducing fraud in financial applications. Collectively, these advances are reallocating capital from legacy single-mode readers toward software-defined orchestration layers, an evolution that favors service revenue over hardware margins inside the next generation biometric market.



By Component:
Services Monetize Post-Hardware EraHardware still accounted for 63.78% of revenue in 2025; however, pricing pressure from sub-USD 50 fingerprint modules has diluted margins. Vendors now package algorithm updates, compliance reporting, and liveness-detection enhancements into cloud subscriptions that grow at a rate of 21.77% annually. IDEMIA’s pay-per-transaction API for identity verification captures deferred spend from customers who once balked at large capital layouts. At the same time, the next generation biometric market size for hardware is sustained by mandatory sensor refreshes in e-gates and national ID kiosks, ensuring a stable but lower-margin revenue floor.
System integrators are extracting value by stitching together access control, payments, and e-passport verification into unified dashboards. Software license income increases when clients opt to standardize on a single stack rather than managing disparate readers. Qualcomm’s premium 3D Sonic Max sensors underline a hardware differentiation strategy focused on larger capture zones and on-device processing. Yet, most vendors view service annuities as the clearest path to expanding lifetime value within the next generation biometric market.
By Function:
Payments Accelerate Past Traditional Access ControlAccess control captured 28.91% share of the next generation biometric market size in 2025, reflecting decades of installed readers guarding office doors and turnstiles. EMVCo and FIDO Alliance harmonization is, however, steering budgets toward payment and transaction authentication, which is growing at a 22.67% CAGR. Fingerprint-enabled payment cards from Thales and IDEMIA eliminate PIN friction and meet new strong customer authentication requirements, while smartphone-based biometric tokens reduce checkout abandonment for e-commerce.
Identification and verification use cases underpin government initiatives, whereas surveillance continues primarily in regions with fewer civil liberty barriers. Time and attendance systems are shifting toward smartphone selfie check-ins for remote staff, and forensic labs are incorporating rapid DNA alongside latent print matching to link suspects within hours. This functional diversification expands the addressable market for vendors, supporting long-term growth in the next generation biometric market.
By End-User Industry:
Healthcare Racing Ahead of Government BaseThe government held 32.83% of the 2025 revenue, driven by border control and national IDs that underpin public service delivery. Healthcare, however, is growing at 23.04% as hospitals deploy biometric patient matching to cut duplicate records and combat insurance fraud. RightPatient’s face recognition enrollment across 150 U.S. hospitals exemplifies the pivot to digital front-door verification. The FDA now recommends biometrics for confirming clinical-trial participants, cementing future demand. Banking leans on behavioral analytics for fraud prevention, defense seeks rugged sensors, and consumer electronics bundles biometrics into premium home security packages. These diverse pipelines ensure steady end-user pull across the next generation biometric market.
Retail has paused some facial recognition experiments following privacy backlash, while education faces student-privacy activism. Success in healthcare demonstrates how targeted mandates can quickly shift growth paths, showcasing the potential for similar dynamics in other regulated sectors. This trend is anticipated to play a significant role in driving the expansion of the broader next-generation biometrics industry, as sector-specific regulations continue to influence market trajectories.
Geography Analysis
APAC Next Generation Biometric Market
Asia-Pacific contributed 36.84% of 2025 revenue, anchored by China’s ubiquitous surveillance cameras and India’s Aadhaar platform. India’s 2025 decision to extend face authentication to the private sector opened fintech and telemedicine channels that accelerate local demand. China continues installing multimodal checkpoints linked to social-credit profiles, while Japan relies on NEC’s biometric e-gates across major airports. South Korea mandates biometric confirmation for mobile transactions exceeding KRW 300,000, thereby bolstering smartphone reader adoption. Australia processes almost all arrivals through SmartGate, showcasing automated border control at scale. Together, these developments maintain Asia-Pacific as the largest contributor to the next generation biometric market.
Middle East Next Generation Biometric Market
The Middle East is on a faster trajectory, with a 22.19% CAGR predicted through 2031. The UAE Pass now underpins more than 5,000 public and private digital services, and Saudi Arabia aims for 70% digital ID coverage by 2030. Qatar retained its iris-based airport system after the World Cup due to throughput gains, and Israel has issued biometric passports to more than 4 million citizens. These state-backed schemes provide firm order books for global and regional vendors, thereby expanding the next generation biometric market size in a geography that large integrators have historically overlooked.
The Americas, Europe and Africa Next Generation Biometric Market
North America and Europe face tighter regulation yet benefit from policy clarity. The EU Digital Identity Wallet will make cross-border credentialing mandatory by 2026, ensuring budget allocation even amid ongoing privacy debates. Germany’s Federal Office for Information Security now publishes technical guidelines aimed at reducing procurement uncertainty. In the United States, Customs and Border Protection has expanded facial-matching exit gates to 32 airports, scanning more than 100 million passengers annually. South American and African nations are still in the early stages of their journeys, but Nigeria’s and Kenya’s biometric ID programs, as well as Brazil’s and Argentina’s pilots, suggest that the next generation biometric market will eventually expand across emerging economies.

Regulatory Landscape
Biometric deployments are being pulled into tighter compliance regimes that pair interoperability expectations with risk-based rules for AI-enabled systems. In the European Union, Regulation (EU) 2024/1689 (AI Act) sets harmonized requirements for biometric identification, emotion recognition, and biometric categorization, with key prohibitions already applicable from February 2025 and full application from August 2026. This sequencing raises the bar for conformity assessments and auditability in high-risk public-sector and border use cases.
Technical standards are also being updated to fit newer modalities and operating models. NIST advanced biometric interchange specifications with the ANSI/NIST-ITL 1-2025 approval (January 2026) and publication of NIST SP 500-290e4 (March 2026), including updates for contactless friction ridge capture. ISO/IEC 19792:2025 (June 2025) provides requirements and guidance for security evaluation of biometric systems, with emphasis on recognition performance and presentation attack detection. Australia reinforced testing and security expectations for accredited digital ID participants with the Digital ID (Accreditation) Data Standards 2024 (enacted November 2024), which supports biometric binding and fraud controls.
Value Chain Analysis
The value chain begins with component suppliers, including near-infrared and imaging sensors, secure elements, MCUs/SoCs, and optics. It then moves to device OEMs and module makers (readers, e-gates, kiosks, mobile devices, and cards), followed by algorithm and platform providers that cover matching, liveness, and orchestration. System integrators and channel partners ultimately deliver solutions to governments, border agencies, banks, healthcare providers, and enterprises. Interoperability requirements increasingly influence upstream design choices, with NIST SP 500-290e4 (March 2026) shaping biometric data interchange for multi-vendor deployments and NIST SP 800-63A-4 (approved May 2025) tightening expectations around identity proofing and enrollment using automated biometric comparison.
Downstream, the value shift is from stand-alone sensors toward platforms and certified onboarding stacks that can be inserted into national and cross-border digital identity programs. Fingerprint Cards expanded its AllKey platform via distribution and integration moves (June 2026), underscoring a shift from component sales to solution-layer monetization. In parallel, India-linked supply localization efforts were reinforced as Mindgrove Technologies partnered with Pinetics to target biometric and identity modules using Indian-designed silicon (May 2026). In Europe, Implementing Regulation (EU) 2026/798 (April 2026) adds technical standards for remote onboarding into European Digital Identity Wallets at high assurance levels, increasing the importance of certified identity workflows and compliance tooling across the integration and services layers.
Competitive Landscape
Moderate concentration characterizes the space, with the top five vendors, IDEMIA, NEC, Thales, Fujitsu, and HID Global, holding a combined 40% revenue share in 2025. Thales leverages its 2019 Gemalto acquisition to bundle sensors with digital-identity software, winning border contracts that require turnkey stacks. IDEMIA’s ten-year United Kingdom e-passport deal secures recurring chip and software income and deters competitors from entering due to high switching hurdles. Patent filings reveal a shift toward on-device matching and federated learning that aligns with localization rules.
Smartphone giants Apple, Samsung, and Qualcomm threaten legacy access-control incumbents by embedding high-precision readers into mass-market devices. Apple’s Secure Enclave has more than 200 associated patents, creating a defensive perimeter competitors must navigate. Startups target behavioral biometrics and decentralized identity niches where physical sensor scale is less critical. BioCatch’s USD 145 million raise will fund the expansion of its typing-pattern analytics, while Innovatrics and IDEX supply low-cost card sensors to payment-card manufacturers.
Compliance is emerging as a moat. Vendors obtaining ISO/IEC 30107 liveness certification or meeting EU AI Act obligations enjoy a first-mover advantage in public tenders. Simultaneously, supply shortages of near-infrared components favor vertically integrated players that control their own manufacturing. All told, rivalry is intensifying, yet barriers to entry are also rising, likely nudging the next generation biometric market toward higher concentration over the forecast horizon.
Next Generation Biometric Industry Leaders
IDEMIA Identity & Security France SAS
NEC Corporation
Thales SA
Fujitsu Limited
HID Global Corporation
- *Disclaimer: Major Players sorted in no particular order
Next Generation Biometric Market Companies Covered in this Report
- IDEMIA Identity & Security France SAS
- NEC Corporation
- Thales SA
- Fujitsu Limited
- HID Global Corporation
- Fingerprint Cards AB
- Synaptics Incorporated
- Suprema Inc.
- Apple Inc.
- Samsung Electronics Co., Ltd.
- Qualcomm Incorporated
- Gemalto N.V.
- BioCatch Ltd.
- Aware, Inc.
- Cognitec Systems GmbH
- DERMALOG Identification Systems GmbH
- Vision-Box, S.A.
- Precise Biometrics AB
- IDEX Biometrics ASA
- Innovatrics, s.r.o.

Market Opportunities and Future Outlook
Border control and travel credentials continue to open budgeted programs for multimodal capture, matching, and backend orchestration. In the United States, a DHS final rule effective December 2025 requiring facial comparison biometrics for covered entries and departures at authorized points of departure supports sustained demand for airport and land-border biometric infrastructure. In parallel, the Secure America Act enacted in June 2026 appropriated USD 69.5 billion to DHS and explicitly included USD 3.45 billion covering border security technology and authorized biometric entry-exit systems. Together, these actions broaden the scope for vendors that can deliver high-throughput capture, watchlist matching, and audited identity workflows aligned to government requirements.
Enterprise authentication is also moving beyond point-in-time unlock toward privacy-preserving and standards-based identity services, creating whitespace for vendors that package biometric assurance into platform offerings. Ping Identity completed its acquisition of Keyless in January 2026 to add Zero-Knowledge Biometrics into its identity platform, aligning with demand for biometric signals that reduce centralized biometric template exposure. Payments and device ecosystems add another layer of opportunity through standards alignment and new form factors: ISO/IEC 30108-1:2026 (published January 2026) defines biometric services for identity attribute verification, and Visa expanded payment passkeys through issuer rollouts in Asia Pacific with live agentic payment trials in Europe (July 2026). On the hardware side, Next Biometrics partnering with Giantplus Technology to prototype anywhere-on-display fingerprint authentication (January 2026) highlights new consumer-device integration surfaces that could later expand into regulated onboarding and secure access workflows.
Recent Industry Developments in Next Generation Biometric Market
- June 2026: IDEMIA Public Security partnered with Nevetal to integrate biometric and identity management into digital cruise passenger journeys. The partnership extends biometrics beyond airports into adjacent travel corridors, adding throughput-driven deployments for enrollment, verification, and passenger processing systems.
- November 2025: NEC secured a USD 120 million contract to upgrade biometric immigration gates across 14 Japanese airports, integrating face and fingerprint verification for sub-10-second traveler processing. The award strengthens NECs installed base in high-traffic border environments where performance, interoperability, and lifecycle services support recurring revenue.
- October 2024: Australia enacted the Digital ID (Accreditation) Data Standards 2024, adding testing and security requirements for accredited digital ID entities that use biometric binding and fraud controls. This tightened accreditation framework raises compliance thresholds for solution providers and increases demand for validated biometric security and assurance capabilities.


Next Generation Biometric Market Report Scope and Research Methodology
Market Definition and Coverage
This market covers revenue generated from next generation biometric solutions used to identify or authenticate people using advanced modalities, delivered as hardware, software, and related services across major end users and regions.
Scope exclusions: We exclude non-biometric identity checks that do not use biometric traits (for example, password-only or card-only authentication with no biometric layer).
Segments Covered in This Report
- By Biometric Modality
- Face Recognition
- Fingerprint Recognition
- Iris Recognition
- Palm-print Recognition
- Voice Recognition
- Vein Recognition
- Gait and Behavioral Biometrics
- Multimodal Biometrics
- By Component
- Hardware
- Software
- Services
- By Function
- Access Control
- Identification and Verification
- Payments and Transactions
- Surveillance and Monitoring
- Time and Attendance
- Forensics
- Other Functions
- By End-user Industry
- Government
- Defense and Public Safety
- Travel and Immigration
- Banking and Financial Services
- Healthcare
- Consumer Electronics and Home Security
- Retail and E-commerce
- Education
- Other End-user Industries
- By Geography
- North America
- United States
- Canada
- Mexico
- Europe
- Germany
- United Kingdom
- France
- Russia
- Rest of Europe
- Asia-Pacific
- China
- Japan
- India
- South Korea
- Australia
- Rest of Asia-Pacific
- Middle East and Africa
- Middle East
- Saudi Arabia
- United Arab Emirates
- Rest of Middle East
- Africa
- South Africa
- Egypt
- Rest of Africa
- Middle East
- South America
- Brazil
- Argentina
- Rest of South America
- North America
Data Sources, Market Sizing, and Validation
Desk Research
Desk work was used to set the market boundaries, build the first demand map, and pick the right indicators that can be tracked consistently each year. We relied on public sources such as NIST evaluations and test reports, ISO and IEC standards references, IATA and ICAO guidance related to digital identity and travel, and government procurement portals and budget documents that show program direction.
We also used company annual reports, earnings notes, product brochures, and reputable press coverage to understand which modalities are being commercialized and how deployments are packaged (hardware, software, and services). In a few places, paid subscriptions for company financials, patent tracking, and shipment-level trade signals were used to cross-check trend direction and avoid missing fast-moving launches. The desk sources listed here are illustrative only, and many other public documents and datasets were reviewed for clarification and validation.
Primary Interviews and Surveys
Primary calls and surveys were completed with a mix of solution providers, system integrators, component suppliers, and end-user teams that run identity or access programs, so the assumptions could be stress-tested against real buying situations. To make the view global, our outreach covered demand patterns and regulatory realities across APAC, EMEA, and the Americas, followed by re-contacts when a variable showed unusual movement versus prior years.
Distribution of primary research fieldwork respondents
| Company type | Respondent position | Region |
|---|---|---|
| Top tier: 27% | CXOs: 13% | APAC: 45% |
| Mid tier: 55% | Functional/Unit leaders: 39% | EMEA: 30% |
| Smaller Players: 18% | Managers: 48% | Americas: 25% |
Market-Sizing & Forecasting
Sizing started from a top-down reconstruction where adoption is tied to identifiable deployment pools, and then filtered through modality mix and delivery type (hardware, software, services) to land on revenue totals. Once the market shape was built, it was checked using selective bottom-up approximations, such as sampled deal sizes for access control and forensics projects, plus a sanity check on implied units and average selling price movement.
Key inputs used in the model included rollout intensity in border control and travel identity programs, device and sensor upgrade cycles, software and services attach rates in enterprise deployments, pricing differences between single-modal and multimodal systems, and the pace of regulatory or standards-driven acceptance. Where direct inputs were thin for smaller countries, proxy indicators were applied and then adjusted using interview feedback, so those gaps did not distort the regional totals.
For forecasting, we used scenario analysis supported by variable-level expectations gathered in interviews, which are then translated into year-by-year changes in penetration, pricing, and mix. This keeps the forecast explainable on a call, because each move in the curve can be traced to a specific driver rather than a single growth-rate assumption.
Data Validation & Update Cycle
Outputs were validated by comparing the final totals against independent signals, such as program announcements, procurement patterns, and the implied spend intensity per deployment type, and then the biggest variances were reviewed line by line. If a region or modality showed an unexpected jump, the assumptions were revisited and experts were re-contacted to confirm whether the change was real or timing related.
Before sign-off, the model goes through a multi-step analyst review where definitions, currency handling, and year alignment are checked, followed by a final consistency pass across components and end users. Reports are refreshed annually, with interim updates when a material policy, standards, or demand event changes the market direction, and then one more update is done right before delivery to keep the view current.
Mordor Intelligence's Next Generation Biometric Market Market Size Measured Against Other Published Estimates
Published market sizes for next generation biometrics can look far apart because firms do not always count the same revenue lines, or they choose different base years and conversion timings. The table helps make the differences easy to spot, since each number usually reflects a distinct view on what qualifies as next generation and how quickly pricing shifts are assumed.
Key gaps often come from scope choices around whether legacy biometric deployments are blended with next generation upgrades, plus how services are treated when they are bundled into broader security contracts. Some publishers also lean on a single growth curve without checking it against deployment indicators, and currency conversion year choice can widen spreads when regions grow at different speeds.
Benchmark comparison
| Source | Market Size | Gaps in Research Methodology |
|---|---|---|
| Mordor Intelligence | USD 40.61 B (2025) | |
| Global Consultancy A | USD 53.96 B (2024) | Uses an earlier base year and a broader framing that can pull in adjacent biometric spending, so the starting point is higher before modality and component boundaries are tightened. |
| Regional Consultancy B | USD 56.35 B (2024) | Leans more on application-level demand statements with limited visibility on component splits, which can overstate totals when hardware, software, and services are not separated cleanly. |
The table shows that the spread is driven mostly by the base-year choice and what gets counted as qualifying revenue. In Mordor Intelligence's model, totals are tied to revenue that is explicitly attributable to next generation modalities across hardware, software, and services, which reduces double counting when biometrics sits inside a larger security or identity program. With the same drivers tracked year to year, the final estimate stays traceable to clear variables and can be repeated when new data arrives.


Key Questions Answered in the Report
How fast will the Next Generation Biometrics market grow through 2031?
It is projected to advance at a 21.23% CAGR, expanding from USD 52.33 billion in 2026 to USD 137.04 billion by 2031.
Which modality is expected to see the steepest growth?
Vein recognition is forecast to post a 22.83% CAGR because of contactless hygiene benefits and high spoof-resistance.
What is driving healthcare adoption of biometrics?
Hospitals deploy face and vein scanners for accurate patient matching, cutting duplicate records and fraud, which propels a 23.04% CAGR in the segment.
Why are payments a breakout function for biometrics?
EMVCo and FIDO standards enable fingerprint-enabled cards and phone authentication, replacing PINs and speeding checkout, leading to a 22.67% CAGR for payment use cases.
Which region offers the fastest growth opportunity after Asia-Pacific?
The Middle East is projected to grow at a 22.19% CAGR, spurred by UAE Pass and Saudi Vision 2030 digital-identity programs.
How are privacy regulations affecting market expansion?
GDPR special-category status and the EU AI Act impose consent, liveness, and audit requirements that raise compliance costs and slow deployments in Europe and North America.
Page last updated on:





