
Mobile Biometrics Market Size and Share
Market Overview
| Study Period | 2020 - 2031 |
|---|---|
| Market Size (2026) | USD 53.77 Billion |
| Market Size (2031) | USD 145.12 Billion |
| Growth Rate (2026 - 2031) | 21.95 % |
| Fastest Growing Market | Middle East and Africa |
| Largest Market | Asia Pacific |
| Market Concentration | Medium |
Major Players *Disclaimer: Major Players sorted in no particular order Image © Mordor Intelligence. Reuse requires attribution under CC BY 4.0. | |
Mobile Biometrics Market Analysis by Mordor Intelligence
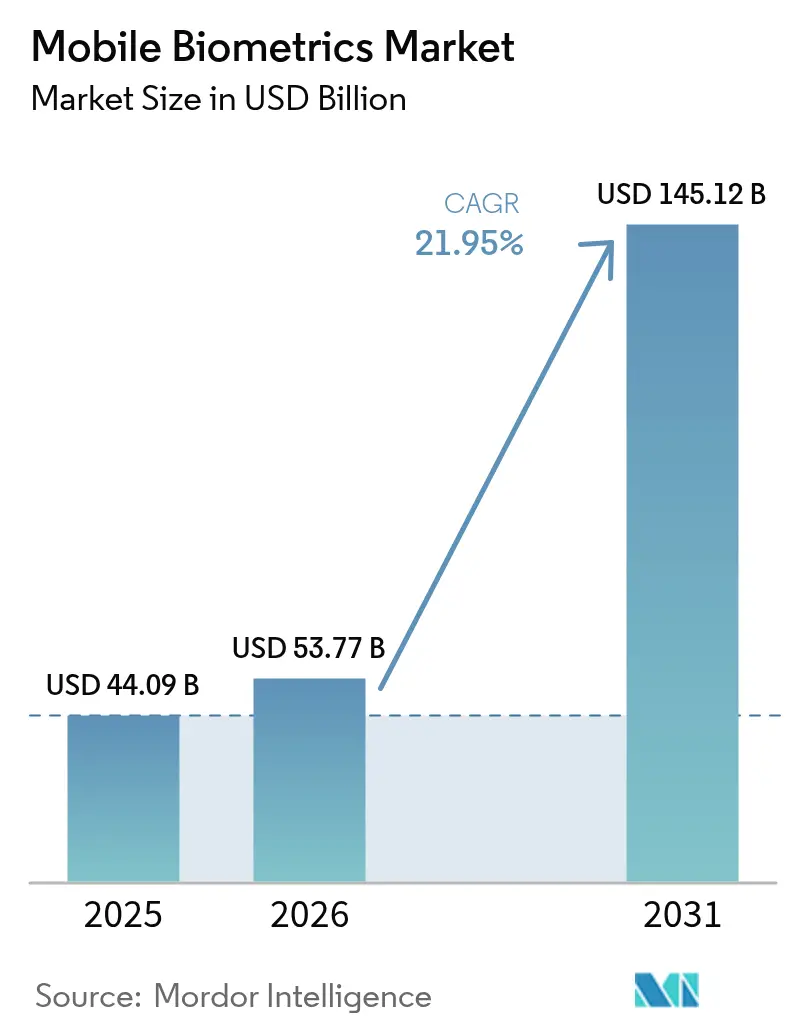
The mobile biometric market size was valued at USD 44.09 billion in 2025 and estimated to grow from USD 53.77 billion in 2026 to reach USD 145.12 billion by 2031, at a CAGR of 21.95% during the forecast period (2026-2031). Momentum stems from the convergence of 5G connectivity, on-device AI processing, and tighter digital-identity mandates across emerging economies. Continuous behavioral monitoring is gaining favor over static checks as presentation-attack attempts on entry-level Android phones escalate. Component trends is giving way to services that are advancing as organizations migrate toward cloud-based biometric platforms. Fingerprint sensors illustrating a maturing core and an innovation frontier in new modalities. Device demand is dominated by smartphones, but smart wearables are setting the pace, signaling a pivot toward ambient, always-on authentication environments.
Key Report Takeaways
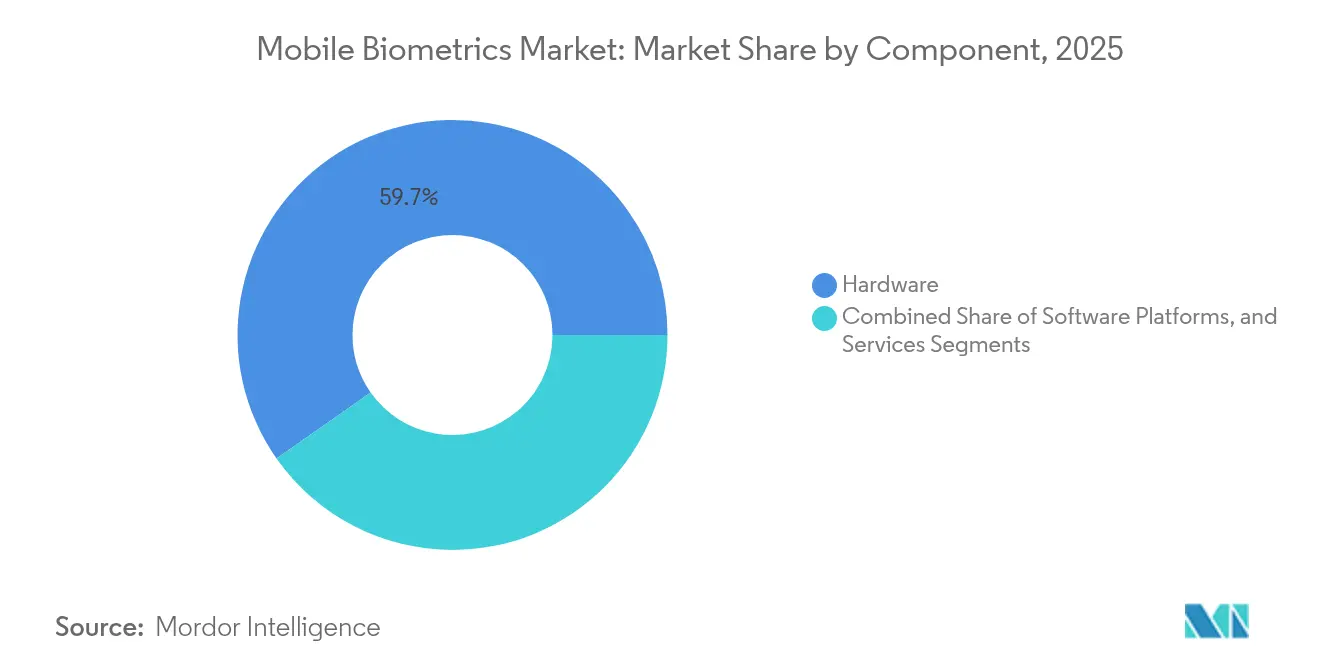
- By component, hardware commanded 59.74% of the mobile biometric market share in 2025; services are projected to compound at a 22.8% CAGR to 2031.
- By authentication mode, single-factor methods held 70.85% revenue in 2025, while multi-factor approaches are poised for 23.9% CAGR through 2031.
- By technology, fingerprint recognition accounted for 38.25% of the mobile biometric market size in 2025; voice recognition is forecast to surge at 23.5% CAGR to 2031.
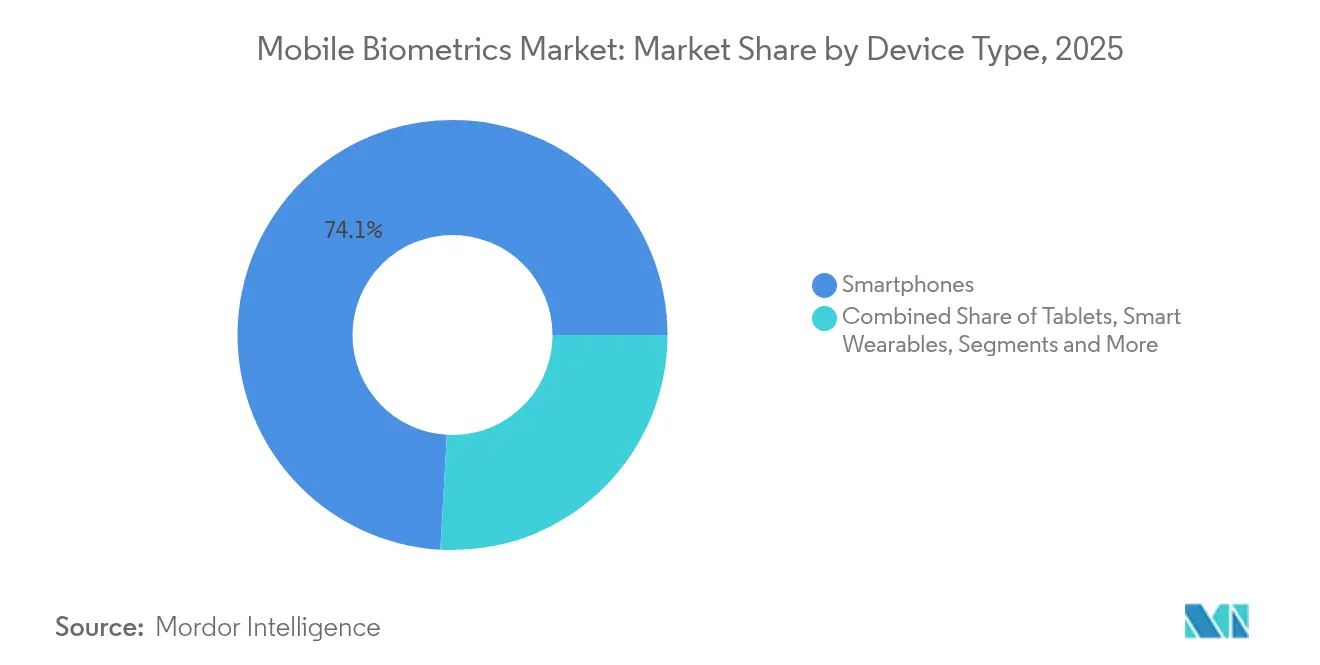
- By device type, smartphones generated 74.10% of 2025 revenue, yet smart wearables are set to expand at 25.6% CAGR over the forecast horizon.
- By industry vertical, BFSI led with 28.85% revenue share in 2025; healthcare is projected to grow at 22.9% CAGR through 2031.
- By geography, Asia-Pacific captured 44.35% of 2025 revenue; the Middle East is on track for a 23.6% CAGR to 2031.
Note: Market size and forecast figures in this report are generated using Mordor Intelligence’s proprietary estimation framework, updated with the latest available data and insights as of 2026.
Market Trends and Insights
Drivers Impact Analysis of Mobile Biometrics Market*
| Driver | (~) % Impact on CAGR Forecast | Geographic Relevance | Impact Timeline |
|---|---|---|---|
| Bi-modal authentication surge in India's Unified Payments Interface (UPI) ecosystem | +3.8% | India, with spillover to Southeast Asia | Medium term (2-4 years) |
| 5G-enabled on-device AI improving spoof detection in Chinese OEM smartphones | +4.2% | Global, led by China and Asia Pacific | Short term (≤ 2 years) |
| e-KYC mandates for mobile banking in Nigeria, Brazil and Indonesia | +2.9% | Emerging markets in Africa and Latin America | Medium term (2-4 years) |
| Deployment of mobile biometric voter enrollment kits across Sub-Saharan Africa | +1.7% | Sub-Saharan Africa | Long term (≥ 4 years) |
| European Digital Identity Wallet regulation accelerating biometric passport use on phones | +3.1% | European Union | Medium term (2-4 years) |
| OEM shift toward under-display ultrasonic sensors in premium segment | +4.6% | Global, concentrated in premium smartphone markets | Short term (≤ 2 years) |
| Source: Mordor Intelligence | |||
Bi-modal authentication surge in India’s UPI ecosystem
India’s Unified Payments Interface is enabling fingerprint or facial recognition in lieu of PINs, cutting fraud and speeding micro-transactions. The model is already influencing wallet providers across Southeast Asia and could lift mobile biometric market adoption among unbanked consumers. Banks benefit from reduced chargeback costs, yet privacy regulators continue to scrutinize Aadhaar-linked storage practices.
5G-enabled on-device AI improving spoof detection in Chinese OEM smartphones
Chinese handset makers have embedded AI models that detect deep-fake attempts locally, a timely response after a 40% jump in biometric fraud in 2024. The hardware-software bundle raises the bar for global competitors and underpins premium positioning while preserving battery life.
e-KYC mandates for mobile banking in Nigeria and Brazil
New regulations compel banks to integrate biometric scans during onboarding, trimming account-opening time and materially lowering fraudulent applications. For vendors, compliance deadlines translate into accelerated services revenue, particularly in cloud-hosted verification platforms.
European Digital Identity Wallet regulation accelerating biometric passports on phones
Ten EU members have begun pilots that let citizens store national IDs and travel documents in mobile wallets secured by biometrics.[1]European Commission Press Corner, “Commission proposes digital passports and ID cards for easier travel,” commission.europa.eu Harmonized standards drive cross-border demand for multimodal SDKs and create a unified addressable market for vendors.
Restraints Impact Analysis of Mobile Biometrics Market*
| Restraint | (~) % Impact on CAGR Forecast | Geographic Relevance | Impact Timeline |
|---|---|---|---|
| High presentation-attack rates on low-cost Android devices | -2.8% | Global, concentrated in emerging markets | Short term (≤ 2 years) |
| Restrictive data-sovereignty laws limiting cloud-based voice biometrics in EU | -1.9% | European Union, with global implications | Medium term (2-4 years) |
| Battery-drain concerns for continuous behavioral authentication | -1.4% | Global | Short term (≤ 2 years) |
| Absence of universal mobile biometric performance benchmarks | -1.1% | Global | Long term (≥ 4 years) |
| Source: Mordor Intelligence | |||
High presentation-attack rates on low-cost Android devices
Budget phones often lack robust liveness checks, allowing deep-fake audio or masks to bypass sensors 99% of the time in six attempts. The gap erodes user trust and forces banks in Africa to add physical ID reviews, dampening scale in price-sensitive segments.
Restrictive data-sovereignty laws limiting cloud voice biometrics in the EU
The EDPS warns of repurposing risks when biometric voiceprints reside in third-country clouds.[2]European Data Protection Supervisor, “Biometric Continuous Authentication,” edps.europa.euVendors must fund local data centers or shift to on-device processing, raising the total cost of ownership and slowing rollouts.
*Our forecasts treat driver/restraint impacts as directional, not additive. The impact forecasts reflect baseline growth, mix effects, and variable interactions.
Mobile Biometrics Market Segment Analysis
By Component:
Services Accelerate Cloud MigrationThe mobile biometric market size for hardware stood at USD 26.35 billion in 2025, equal to 59.74% revenue share. Sensor makers invested in under-display ultrasonic modules to defend margins as commoditization sets. AI-optimized chips compress latency, ensuring usability in low-light and wet-finger scenarios. Services, though smaller, are compounding at 22.8% CAGR on the back of identity-as-a-service subscriptions purchased by banks and hospitals. Providers bundle orchestration dashboards, fraud-risk analytics, and compliance reporting, shifting capital expense to operating outlays.
Demand for managed services is most pronounced in healthcare, where hospitals outsource biometric patient enrollment to avoid running data centers. Leading IaaS players co-market biometric APIs, broadening reach. Meanwhile, software platforms that unify fingerprint, voice, and behavioral signals hold strategic ground as integrators of record for multicloud deployments. Collectively, these forces reinforce a services flywheel that drives stickier annual recurring revenue across the mobile biometric market.



By Authentication Mode:
Multi-Factor Gains Despite Single-Factor DominanceSingle-factor techniques generated USD 31.23 billion in 2025, underscoring user preference for one-touch unlock flows embedded natively in iOS and Android. However, regulators and insurers now pressure banks to shrink residual fraud, steering new budget line items toward multi-factor deployments that mix biometrics with device-based cryptographic keys.
Android 15’s passkey integration proves critical; by caching FIDO credentials in the hardware enclave, Google enables face or fingerprint to act as a second factor invisibly to users. Enterprises gain defense-in-depth without abandonment mobile checkout flows. Expect board-level risk committees to prioritize such layered controls as phishing kits that weaponize generative AI.
By Technology/Modality:
Voice Recognition Disrupts Fingerprint LeadershipDespite accounting for 38.25% revenue in 2025, fingerprint scanners face margin pressure as under-display modules spread to mid-tier phones. Conversely, voice recognition benefits from smart-speaker proliferation and call-center modernization. The mobile biometric market share for fingerprint sensors remains substantial, yet the voice segment’s 23.5% CAGR implies a changing topography through 2031.
Financial institutions such as the Bank of Ireland earmarked EUR 34 million (USD 37 million) for voiceprint deployment, targeting a 50% call-time reduction and lower ATO fraud. Multi-spectral vein or iris systems remain niche but lucrative in defense and border control, while behavioral biometrics secure continuous authentication in background mode, mitigating battery-drain concerns.
By Device Type:
Smart Wearables Challenge Smartphone DominanceSmartphones captured a 74.10% share in 2025, yet their share edges downward over time as wearables hold the largest CAGR of 25.6% through 2031, as mainstream biometric unlock for payments, ticketing, and enterprise SSO. Smart-ring pioneers bundle photoplethysmography and capacitive sensors, enabling passive gait matching with negligible power draw.
Edge-AI firmware now handles liveness detection locally on fitness bands, satisfying privacy regulations by minimizing raw-data egress. Rugged handhelds with FIPS-certified readers thrive in law enforcement and warehouse environments, sustaining a profitable though smaller sub-segment.
By Industry Vertical:
Healthcare Momentum Challenges BFSI LeadershipBFSI represented USD 12.72 billion in 2025. Compliance with PSD2, CCPA, and similar frameworks positions banks as perennial spenders on biometric risk engines. Yet the healthcare vertical is tracking 22.9% CAGR, aided by contactless patient-check-in pilots and pharmacy e-prescription mandates. NYU Langone’s palm-scanning rollout signals mainstream acceptance and is projected to cut duplicate-record errors by 20%.
Government demand is cyclical but sizable, underpinned by voter-ID and border-control budgets. Retailers experiment with biometric POS to eliminate PIN entry, while telecom operators embed subscriber ID verification to counter SIM-swap fraud. The mobile biometric industry thus sees cross-vertical synergies as cloud vendors package sector-specific compliance templates.
Geography Analysis
APAC and Middle East Mobile Biometrics Market
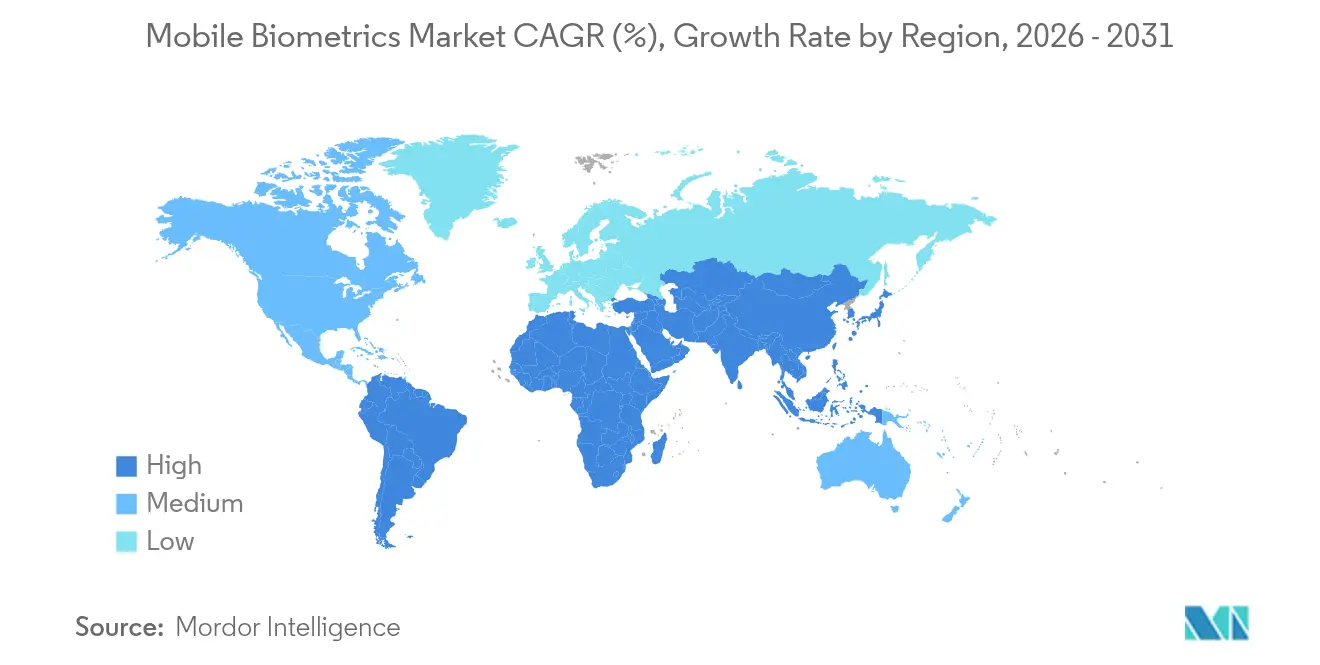
Asia-Pacific generated USD 19.55 billion in 2025, equating to 44.35% of global revenue. Rapid smartphone penetration, proliferating fintech apps, and government-backed digital ID programs sustain region-leading scale. Chinese OEMs’ embrace of ultrasonic in-display sensors has rippled across supply chains, lowering BOM costs and seeding mass adoption. India continues to iterate on Aadhaar-linked rails, with bi-modal UPI transactions expanding merchant acceptance beyond metro centers. The Middle East, at USD 3.06 billion in 2025, is the fastest-growing pocket with a 23.6% CAGR. UAE’s replacement of physical Emirates IDs with mobile credentials exemplifies a top-down policy play that accelerates nationwide interoperability. Kuwait’s Vision 2035 ties biometric enrollment to e-government service access, lifting demand for multimodal kits. Dubai’s infrastructure boom, including transit megaprojects, compels contractors to adopt biometric access control, further lifting regional outlays.
North America, Europe and Africa Mobile Biometrics Market
North America maintains steady but slower growth as enterprises modernize IAM stacks and consumer banking shifts toward password-free sign-in. JPMorgan Chase’s biometric checkout pilots hint at a coming inflection in card-less retail payments. Europe remains structurally attractive but navigates stringent GDPR and AI Act requirements. The EU Digital Identity Wallet harmonizes standards across 10 nations, catalyzing vendor certification pipelines. Sub-Saharan Africa, while smaller in dollar terms, drives volume in mobile voter-registration kits, underscoring latent demand for portable enrollment hardware.

Regulatory Landscape
Mobile biometrics deployments are increasingly shaped by identity, AI, and privacy rules that translate into specific technical and documentation requirements. In the European Union, the EU AI Act (Regulation (EU) 2024/1689) classifies certain biometric identification uses as high-risk, increasing the bar for conformity assessment and technical documentation, with key high-risk obligations scheduled to apply from 2 August 2026. Separately, EU Implementing Regulation 2025/1566 adopts ETSI TS 119 461 V2.1.1 (2025-02) for identity verification, pushing vendors and integrators toward harmonized onboarding and verification practices across member states.
Outside the EU, regulatory anchors are tightening interoperability and performance expectations. In the United States, ANSI/NIST-ITL 1-2025 was approved on 15 January 2026, updating technical specifications for biometric data interchange (notably fingerprint and face), which informs government-grade mobile enrollment and verification workflows. Australia’s Digital ID Act 2024, supported by the Digital ID Accreditation Data Standards, also raises requirements around biometric matching and presentation attack detection, increasing the compliance burden on mobile biometric stacks that combine sensors, liveness checks, and identity proofing.
Value Chain Analysis
The mobile biometrics value chain spans sensor and secure-element components (fingerprint, camera/IR depth, and microphone arrays), on-device processing (SoCs/AI accelerators and secure enclaves), algorithm and SDK providers (matching and liveness/PAD), and platform and orchestration layers (identity verification and risk analytics). Downstream channels include OEMs, wallet/payment players, system integrators, and government and enterprise buyers. Industry programs such as the FIDO Alliance Biometric Component Certification Program influence how biometric components are specified and validated, tying supplier selection to performance metrics and certification readiness rather than bill-of-materials cost alone.
Upstream supply remains sensitive to semiconductor and module-integration capacity, with sensor die fabrication dependent on specialized foundry capacity and assembly concentrated in Asian electronics clusters. Practical bottlenecks include constrained 8-inch fabrication availability for certain sensor types, limited access to specialized calibration equipment, and long, resource-intensive certification cycles for security-critical use cases. Strategic positioning in the chain is also shifting through consolidation and portfolio moves, including a proposed merger of equals between Precise Biometrics and Fingerprint Cards (announced March 2026), and prior actions by Fingerprint Cards that signaled a shift away from parts of its mobile-focused operations via patent and asset licensing arrangements with Egis Technology (June 2024).
Competitive Landscape
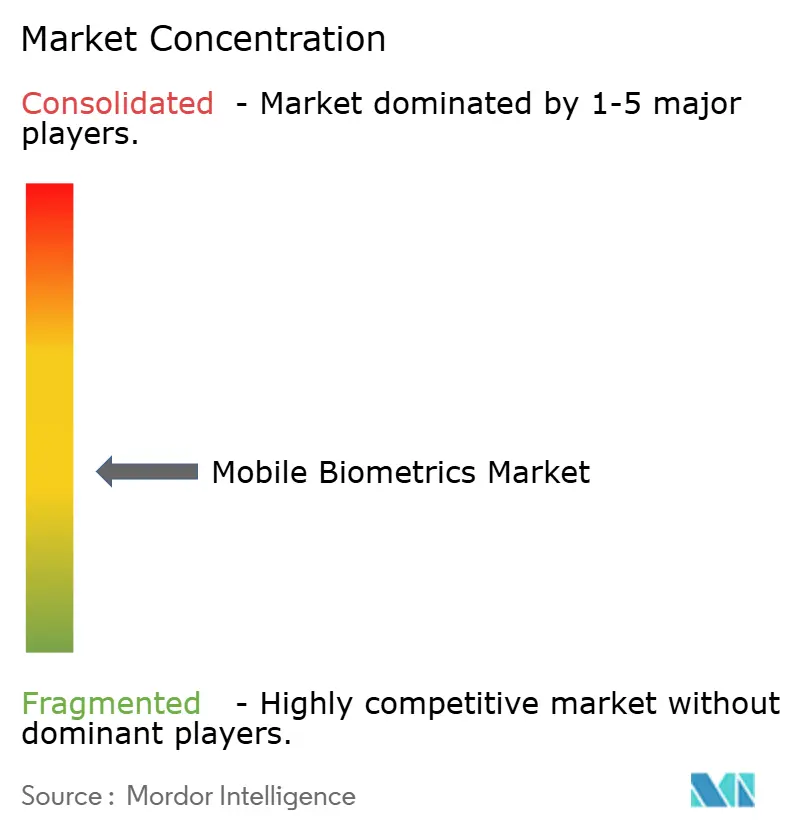
Competition is moderately fragmented. Traditional fingerprint-sensor incumbents compete with voice-biometric specialists and AI-native behavioral analytics startups. Strategic thrusts coalesce around platform orchestration—owning the entire stack from sensor silicon to cloud ID verification APIs.
Apple continues to build moats via patents on under-display optics, reinforcing vertical integration and future-proofing the iPhone premium tier. Infineon’s SECORA Pay Bio card module illustrates horizontal expansion into payments to capture the adjacent TAM. Cloud-native challengers pursue land-and-expand motions, offering SDKs that abstract modality specifics, then upsell analytics. M&A activity (Entrust–Onfido, LexisNexis–IDVerse) signals consolidation aimed at amassing training-data reservoirs and meeting banks’ preference for single-throat-to-choke procurement.
Startups differentiate through privacy-preserving federated learning and edge inference that curtails data-sovereignty headaches. Meanwhile, Tier-1 integrators bundle biometric IAM with zero-trust network offerings, appealing to CISOs seeking unified policy automation. Pricing dynamics trend toward subscription OPEX, reducing upfront friction for mid-market adopters.
Mobile Biometrics Industry Leaders
Qualcomm Technologies Inc.
IDEMIA (Safran Identity & Security)
NEC Corporation
Thales Group (Gemalto)
Fingerprint Cards AB
- *Disclaimer: Major Players sorted in no particular order
Mobile Biometrics Market Companies Covered in this Report
- Apple Inc.
- Samsung Electronics Co. Ltd.
- Qualcomm Technologies Inc.
- IDEMIA (Safran Identity and Security)
- NEC Corporation
- Thales Group (Gemalto)
- Fingerprint Cards AB
- Goodix Technology Co. Ltd.
- Synaptics Incorporated
- Precise Biometrics AB
- Nuance Communications Inc.
- Aware Inc.
- Daon Inc.
- M2SYS Technology
- Veridium Ltd.
- FaceTec Inc.
- Mobbeel Solutions SLL
- VoiceVault Inc.
- ValidSoft Ltd.
- Tech5 SA
- HYPR Corp.
- Suprema Inc.
- ID RandD Inc.
- ImageWare Systems Inc.

Market Opportunities and Future Outlook
Standardization and compliance-driven interoperability create whitespace for vendors that can package biometric performance descriptors, testing evidence, and integration tooling across devices and verticals. FIDO Alliance updates to its metadata statement requirements (January 2026) tighten how authenticators disclose accuracy and presentation-attack related descriptors, supporting more consistent procurement and integration decisions for banks, enterprises, and device makers seeking cross-platform authentication without bespoke validation for each deployment.
Field and government use cases continue to pull demand toward ruggedized, modular, and multimodal mobile capture and verification, where solution completeness and certification posture can matter as much as unit price. Recent product and platform activity points in this direction, including Integrated Biometrics and SIC Biometrics unveiling mobile biometric solutions built around an FBI-certified fingerprint scanner (June 2026), and BioRugged launching an ICAO-compliant facial portrait capture camera platform aimed at European system integrators (June 2026). At the same time, privacy and AI governance pressures reinforce architectures that minimize raw biometric data movement, supporting designs that keep matching and liveness decisions on-device while exporting only scores, templates, or signed assertions for downstream identity workflows.
Recent Industry Developments in Mobile Biometrics Market
- July 2026: Precise Biometrics and Fingerprint Cards AB received Swedish regulator approval for their merger, with consolidation targeted around late July 2026. The combination links sensor heritage with software and identity offerings, strengthening bargaining leverage with OEMs and system integrators that prefer fewer vendors for multimodal stacks.
- May 2026: Leidos and IDEMIA Public Security announced work to advance biometric-enabled checkpoint modernization at U.S. airports, including biometric eGates and CAT-2 credential authentication systems. The move connects identity verification hardware, software, and operational deployment capabilities in a high-throughput environment that can pull adjacent demand for mobile enrollment and verification tooling.
- June 2024: Fingerprint Cards AB entered an exclusive partnership with Egis Technology to license mobile-related patents and assets, reflecting a restructuring of how mobile fingerprint IP and commercialization are managed. The deal reshaped supplier options for OEMs and shifted parts of the value chain from component sales toward licensing-led monetization.


Mobile Biometrics Market Report Scope and Research Methodology
Market Definition and Coverage
This market covers the revenues linked to biometric authentication done on mobile endpoints, including embedded sensors and the software layer that enables fingerprint, face, voice, iris, and behavioral checks on devices and mobile apps.
Scope exclusions: Desktop-only and fixed access-control biometrics that are not used through a mobile device are excluded from this sizing.
Segments Covered in This Report
- By Component
- Hardware
- Software Platforms
- Services
- By Authentication Mode
- Single-Factor Authentication
- Multi-Factor Authentication
- By Technology / Modality
- Fingerprint Recognition
- Facial Recognition
- Voice Recognition
- Iris Recognition
- Vein and Vascular Pattern Recognition
- Behavioral Biometrics (Gait, Keystroke)
- Other Modalities
- By Device Type
- Smartphones
- Tablets
- Smart Wearables
- IoT / Edge Devices
- Rugged Handhelds and Scanners
- By Industry Vertical
- BFSI
- Government and Public Sector
- Healthcare
- Retail and E-commerce
- IT and Telecom
- Defense and Security
- Education
- Other Verticals
- By Geography
- North America
- United States
- Canada
- Mexico
- South America
- Brazil
- Argentina
- Rest of South America
- Europe
- United Kingdom
- Germany
- France
- Italy
- Spain
- Nordics
- Rest of Europe
- Asia Pacific
- China
- Japan
- South Korea
- India
- Australia
- New Zealand
- Rest of Asia Pacific
- Middle East and Africa
- Middle East
- GCC
- Turkey
- Rest of Middle East
- Africa
- South Africa
- Nigeria
- Kenya
- Rest of Africa
- Middle East
- North America
Data Sources, Market Sizing, and Validation
Desk Research
Desk work starts by mapping what is being sold in mobile biometrics, and then aligning demand to a value-based market model in USD. For device and connectivity indicators, we use public sources such as the International Telecommunication Union, and for macro and income signals we reference the World Bank. For biometric test approaches and terminology that show up across vendors, we use the US National Institute of Standards and Technology. We also review guidance and statistics from regulators and standards bodies such as the European Union Agency for Cybersecurity and ISO/IEC publications that describe how mobile identity and authentication are implemented.
To anchor adoption and pricing logic, we read company annual reports, 10-K style filings, investor decks, product documentation, and credible press coverage tied to sensor shipments, secure enclave style hardware, and mobile authentication rollouts in sectors like BFSI and government. When needed, paid subscriptions are used only for company financials and patent databases, and for a shipment-level import and export view to sanity-check hardware flows into key regions. The desk sources listed here are illustrative, and additional public documents were used to build the dataset, validate assumptions, and refine the final model.
Primary Interviews and Surveys
Primary work is used to pressure-test what we built from public information, especially around attach rates, pricing movement, and the split between on-device and service-led deployments. We speak with a mix of device ecosystem participants, software and platform specialists, and enterprise buyers across APAC, EMEA, and the Americas so gaps from desk inputs can be filled and then reconciled into one consistent view.
Distribution of primary research fieldwork respondents
| Company type | Respondent position | Region |
|---|---|---|
| Top tier: 38% | CXOs: 13% | APAC: 43% |
| Mid tier: 42% | Functional/Unit leaders: 35% | EMEA: 35% |
| Smaller Players: 20% | Managers: 52% | Americas: 22% |
Market-Sizing & Forecasting
Sizing is built using a top-down demand pool reconstructed from smartphone and smart wearable shipments, biometrics-enabled device penetration, and the share of devices using each modality. The totals are converted into value using blended pricing for hardware, software platforms, and services. To keep results grounded, we cross-check against selective bottom-up approximations such as sampled ASP times volume for key components, channel feedback on licensing and service fees, and a limited supplier roll-up when public financial disclosures allow it.
In the model, a few practical inputs drive most of the output, including active smartphone base growth, MFA adoption in regulated digital journeys, the shift from single-factor to multi-factor authentication, refresh cycles for devices and sensors, and the mix shift toward face and behavioral use cases for frictionless login. Forecasts come from scenario analysis, where base assumptions for device growth, security policy tightening, and pricing trends are reviewed with experts and stress-tested for upside and downside. Where bottom-up coverage is thin, we use conservative ranges and then normalize the final values back to observable device and subscription signals so the end number stays traceable.
Data Validation & Update Cycle
Outputs are validated through step-by-step checks that compare implied revenue per device against known price bands, and then compare regional totals against independent indicators such as smartphone shipment trends, digital banking usage growth, and public cybersecurity program activity. Outliers are flagged and revisited, and follow-up calls are triggered when primary feedback conflicts with desk assumptions or when a variable moves sharply.
Before sign-off, the model is reviewed by a second analyst for arithmetic consistency, unit handling, and logic alignment to the defined scope. A final pass is completed close to publication so recent changes are reflected. Reports are refreshed annually, and interim updates are made when material changes occur, such as major regulatory actions, large device-cycle shifts, or step-changes in authentication deployment patterns.
Mordor Intelligence's Mobile Biometrics Market Estimate Compared With Other Published Estimates
Published market sizes for mobile biometrics can differ a lot, even when the topic sounds aligned, because included components, device boundaries, and year assumptions are not uniform across sources. Differences also come from how analysts treat pricing changes for sensors and software, and how frequently underlying adoption rates are refreshed.
Fixed, non-mobile biometric access-control systems sit outside Mordor Intelligence's scope, which is one reason the 2025 value can be lower than figures that roll adjacent enterprise biometrics into the same total. Other gaps usually come from how multi-factor authentication is counted, whether services are treated as recurring platform revenue or as one-time integration, and whether currency conversion and inflation handling stay consistent across regions.
Benchmark comparison
| Source | Market Size | Gaps in Research Methodology |
|---|---|---|
| Mordor Intelligence | USD 44.09 B (2025) | |
| Industry Research Publisher A | USD 54.63 B (2025) | Often broadens the definition to include a wider set of non-handset biometric revenues and may apply higher service revenue intensity per device, which lifts the 2025 total. |
| Global Research Publisher B | USD 51.17 B (2025) | Common differences come from counting a larger share of enterprise deployments as mobile biometrics and using more aggressive adoption ramp assumptions for MFA in regulated digital use cases. |
The comparison shows that most of the spread is explained by what gets counted as truly mobile and how recurring software and services are attached to the device base. By keeping inputs tied to device shipment and installed-base signals, and then reconciling them with interview-led adoption and pricing checks, the model stays easy to audit and repeat year to year.


Key Questions Answered in the Report
What is the current size of the mobile biometric market?
The mobile biometric market is worth USD 53.77 billion in 2026 and is projected to reach USD 145.12 billion by 2031 at a 21.95% CAGR.
Which region holds the largest share of mobile biometric revenue?
Asia-Pacific leads with 44.35% 2025 revenue share, driven by India’s UPI ecosystem and Chinese smartphone OEM innovation.
Which segment is growing fastest within the mobile biometric market?
Smart wearables are expanding at a 25.6% CAGR as continuous, ambient authentication gains traction.
Why are services outpacing hardware growth?
Enterprises are shifting to identity-as-a-service models that bundle cloud orchestration and compliance reporting, propelling the services segment at 22.8% CAGR.
How are regulations influencing adoption?
Mandates such as e-KYC in emerging markets and the EU Digital Identity Wallet are compelling financial institutions and governments to deploy multimodal biometric solutions.
What is driving the rise of voice biometrics?
Advances in AI speech modeling and large-scale call-center deployments are accelerating voice recognition at a 23.5% CAGR, challenging fingerprint’s long-standing dominance.
Page last updated on:


 Your data is secure and never sold or shared.


