
Extended Reality (XR) Market Size and Share
Extended Reality (XR) Market Analysis by Mordor Intelligence
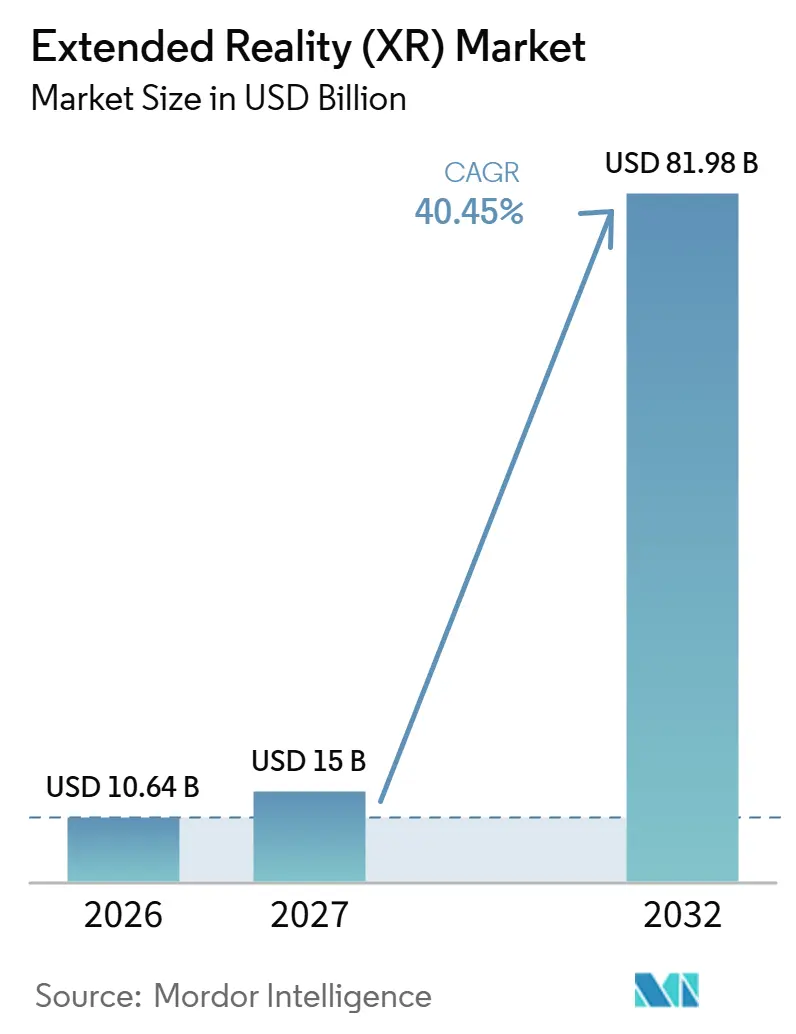
The extended reality (XR) market size is estimated at USD 10.64 billion in 2026 and is projected to be USD 15 billion in 2027, reaching USD 81.98 billion by 2032, growing at a CAGR of 40.45% from 2027 to 2032.
Industrial digital twins and collaborative training connect immersive interfaces to operating tasks, creating demand for application development and deployment support. In the United States, virtual reality (VR) training ties headset installations to institutional instruction across operating locations. Phone-based augmented reality (AR) broadens access through qualified devices, creating a parallel path for applications that do not require wearable displays. Equipment costs and prolonged-session discomfort can slow headset adoption, giving suppliers a commercial opening in implementation and training bundled with systems that address specific operating tasks.
Key Report Takeaways
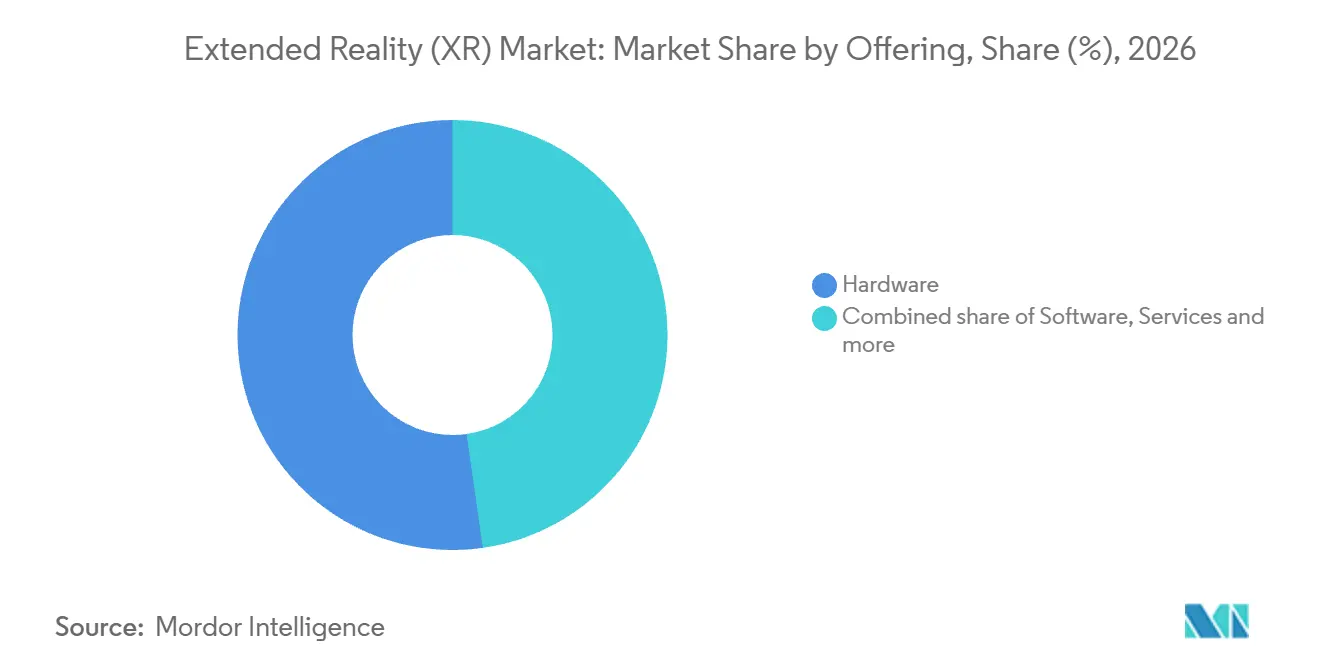
- By offering, hardware led with a 52.25% extended reality (XR) market share in 2026, while services are forecast to grow fastest at a CAGR of 40.9% from 2027 to 2032.
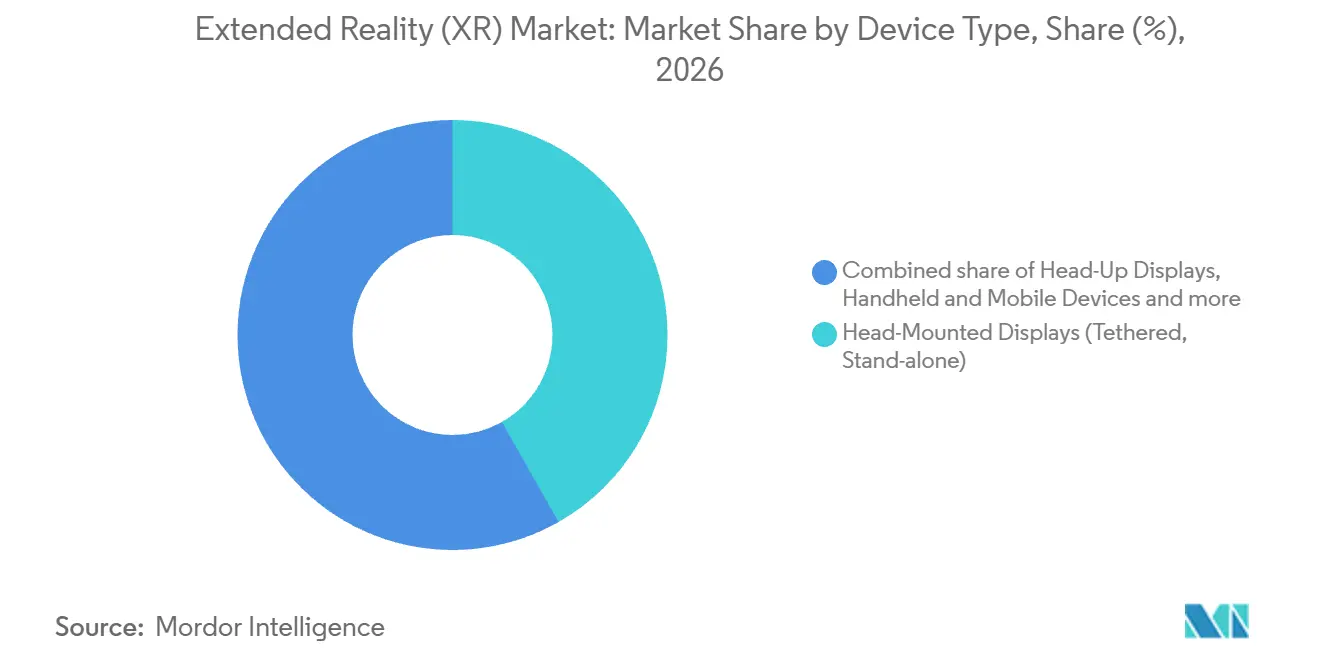
- Among device types, head-mounted displays (tethered, stand-alone) held the largest share, at 41.78% of XR revenue in 2026, and other devices are projected to be the fastest-growing segment at a CAGR of 41.7% from 2027 to 2032.
- Across technologies, augmented reality (AR) led with a 42.77% share of the extended reality (XR) market size in 2026 and is forecast to grow fastest at a CAGR of 41.2% from 2027 to 2032.
- Within end-user industries, gaming and entertainment led with 38.21% of XR revenue in 2026, while healthcare and life sciences are forecast to grow fastest at a CAGR of 40.7% from 2027 to 2032.
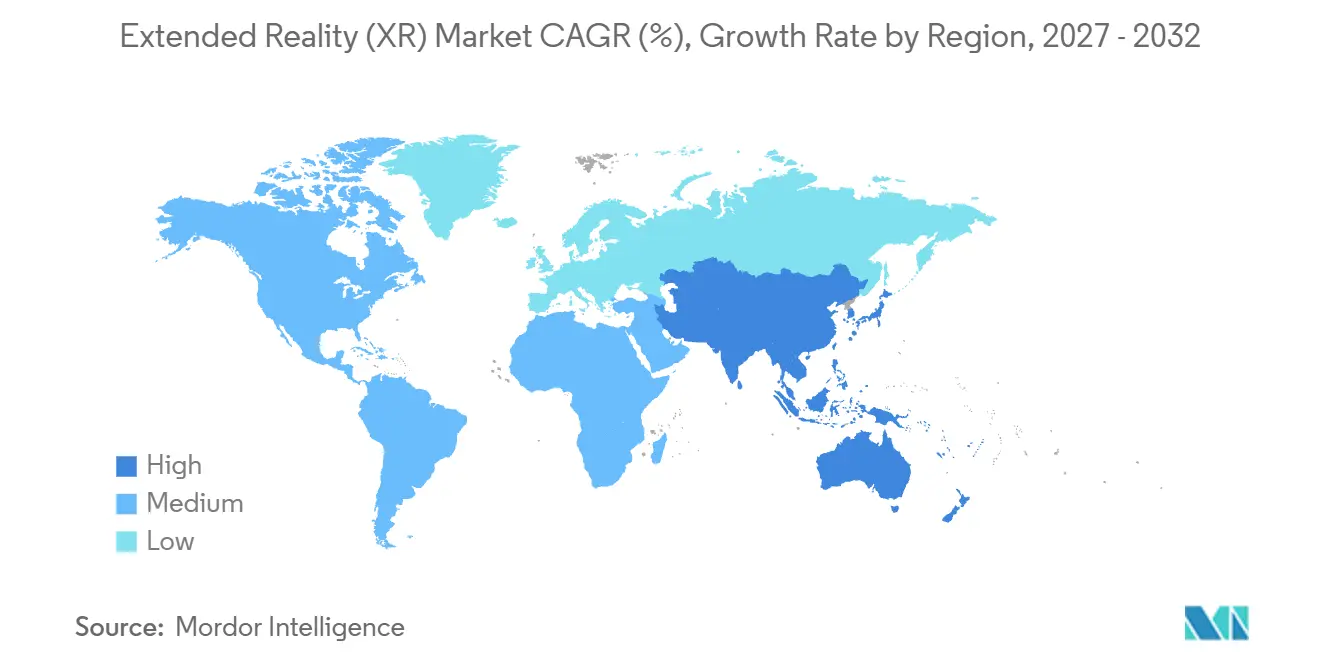
- Across regions, North America was the largest region with 36.37% of XR revenue in 2026, whereas Asia-Pacific is projected to grow fastest at a CAGR of 41% from 2027 to 2032.
Note: Market numbers in this report are based on Mordor Intelligence's proprietary estimation framework, which combines nine months of actuals with Q4 projections for base year 2026.
Market Trends and Insights
Drivers Impact Analysis of Extended Reality (XR) Market*
| Driver | (~) % Impact on CAGR Forecast | Geographic Relevance | Impact Timeline |
|---|---|---|---|
| Expanding 5G coverage and edge computing synergy | +10% | Europe, Asia-Pacific and the Americas | Medium term (2-4 years) |
| Increased integration of XR into digital twin and Industry 4.0 frameworks | +12% | United States of America | Medium term (2-4 years) |
| Rising enterprise demand for immersive remote-training | +11% | United States of America | Short term (≤ 2 years) |
| Mass-market smartphone integration of spatial sensors | +9% | North America, Europe and Asia-Pacific | Short term (≤ 2 years) |
| Government funding for metaverse-related R&D | +5% | European Union member states | Long term (≥ 4 years) |
| Adoption of open XR standards lowering vendor lock-in | +4% | United States, United Kingdom and Japan | Medium term (2-4 years) |
| Source: Mordor Intelligence | |||
Expanding 5G coverage and edge computing synergy
Network reach broadens the potential audience for XR services that can share processing between a device and the network. ITU reported that 5G coverage reached 55% of the world's population in 2025. 3GPP's 2025 technical report describes how XR applications may benefit from edge processing, including scene generation and rendering. ITU put 5G coverage at 74% of the population in Europe, 70% in Asia-Pacific, and 60% in the Americas in 2025. That network reach provides a delivery base for edge-assisted rendering where applications adopt the proposed architecture.
Increased integration of XR into digital twin and Industry 4.0 frameworks
Factory planning creates demand for immersive interfaces that help engineers find problems before production begins. In May 2025, Stellantis reported that its VR deployment had identified and resolved potential assembly-line issues before production. The automaker's VR lab also integrated digital twins. The reported result establishes a preproduction use for VR, while digital twins form another capability within the lab. Suppliers selling into factory planning meet the buyer at the engineering stage, when assembly problems can be addressed before a line enters production.
Rising enterprise demand for immersive remote-training
Shared rehearsal makes immersive remote training a way to develop team practice alongside individual instruction. Varjo's 2026 report on XR in simulation training identified multi-user or joint training as a priority among its simulation-training industry respondents. Separately, Vertex Solutions completed fielding 25 T-38 mixed-reality training devices across 4 U.S. Air Force pilot-training bases in 2026. Deployment at multiple sites establishes a physical base for immersive instruction, while the respondent priorities identify a separate need for joint exercises. Because Varjo found immersive training most effective when it complements traditional simulators and live exercises, the commercial opening for simulation suppliers lies in fitting joint-exercise content into those established training flows rather than replacing them.
Mass-market smartphone integration of spatial sensors
Phone-based AR expands the potential distribution channel for immersive content beyond dedicated headsets. Google's ARCore uses phone cameras and inertial sensors to track position and understand surroundings on a wide variety of qualified Android phones. This gives developers a spatial interface built around the capabilities of supported phones. Separately, Snap reported more than 9 billion daily AR Lens uses in the Snapchat camera on average in Q1 2026.[1] That camera-based activity demonstrates the scale accessible AR experiences can reach, while phone tracking supplies a mechanism for spatial applications. Wearable suppliers face a specific differentiation task when camera-based AR already reaches users through phones.
Restraints Impact Analysis of Extended Reality (XR) Market*
| Restraint | (~) % Impact on CAGR Forecast | Geographic Relevance | Impact Timeline |
|---|---|---|---|
| High upfront costs of high-fidelity optics and processors | -4.5% | North America, Europe and Asia-Pacific | Short term (≤ 2 years) |
| User motion-sickness and ergonomic limitations | -3% | North America, Europe and Asia-Pacific | Medium term (2-4 years) |
| Data-privacy gaps in eye- and hand-tracking analytics | -2% | United States of America | Medium term (2-4 years) |
| Fragmented content-authoring tool ecosystem | -1% | European Union member states | Short term (≤ 2 years) |
| Source: Mordor Intelligence | |||
High upfront costs of high-fidelity optics and processors
Upfront hardware spending makes immersive retail an access decision as well as a content decision. Expert interviews reported in a 2025 study identified VR equipment acquisition costs and upfront headset purchases as obstacles for retailers considering VR shopping.[2] In early 2025 interviews, the vast majority of experts called headset costs a major adoption challenge, and one interviewee said Apple Vision Pro's USD 3,499 price could deter potential buyers. In-store experiences require retailers to equip the installation, while at-home VR access depends on customers having headsets. That divides the commercial burden between the business providing equipment and the shopper expected to own it. Moving VR shopping out of the store transfers the headset requirement to customers rather than eliminating the adoption cost.
User motion-sickness and ergonomic limitations
Prolonged XR sessions make physical tolerance part of the commercial case for sustained immersive applications. In applications requiring prolonged use, headset weight, balance, and virtual-image content can cause physical and visual discomfort, muscle strain, and nausea. This limits how confidently an operator can treat additional headset time as additional usable instruction. Content requiring continuous immersion therefore faces a different adoption hurdle from an experience users can readily interrupt. On October 15, 2025, Apple introduced an upgraded Vision Pro with a counterweighted Dual Knit Band intended to improve comfort, balance, and stability. Weight balance alone cannot establish suitability for prolonged use when virtual imagery can also cause discomfort.
*Our forecasts treat driver/restraint impacts as directional, not additive. The impact forecasts reflect baseline growth, mix effects, and variable interactions.
Extended Reality (XR) Market Segment Analysis
By Offering:
Hardware Scale and Service CommitmentsHardware accounted for a 52.25% share of the extended reality (XR) market size in 2026. In Q4 2025, Vuzix received and fulfilled nearly USD 1 million in follow-on orders for custom M400 AR smart-glasses kits from a large online retailer. In Q2 2026, it also expanded M400 deployments across Amazon fulfillment centers. The follow-on orders and Amazon's expanded deployments make additional purchases within established warehouse operations a concrete source of hardware business.
Services are forecast to be the fastest-growing segment, with a CAGR of 40.9% from 2027 to 2032. On August 7, 2025, the Texas Department of Public Safety awarded Operator XR LLC, xReality Group Limited's wholly owned U.S. subsidiary, a contract for OP-2 licenses and VR training systems. The award included implementation, training, and 2 years of support.[3] A further 3 years of support were optional, with the option exercisable in fiscal 2028 according to the supplier's fiscal 2026 results update. Implementation secures the initial engagement, while the optional support term leaves later service revenue dependent on the buyer's renewal decision.

By Device Type:
Headsets Lead as Specialized Interaction ExpandsHead-mounted displays (tethered, stand-alone) represented a 41.78% extended reality (XR) market share in 2026. Meta said its Quest ecosystem reached a record number of unique users in 2025. Existing ecosystem participation gives application providers an audience already using the device format, which can support content developed around its interaction model.
Other devices are forecast to be the fastest-growing segment, with a CAGR of 41.7% from 2027 to 2032. Virtuix Holdings Inc. reported that new Omni One system orders increased 72% in the quarter ended June 30, 2026, compared with the year-earlier quarter. Its omnidirectional treadmills support walking and running within VR applications, adding locomotion to immersive interaction. Head-up displays serve vehicle applications, with Jiangsu New Vision Automotive Electronics reporting sales of 180,000 CyberVision AR-HUD units in 2025.
By Technology:
AR Demand Meets Manufacturing ExecutionAugmented reality (AR) was the largest segment with 42.77% of revenue in 2026 and is forecast to be the fastest-growing segment, with a CAGR of 41.2% from 2027 to 2032. Rokid reported 300,000 orders in 2025 for Rokid Glasses, its AI and AR smart-glasses product. It said 30% to 40% of orders were deferred to 2026 because production capacity was insufficient, placing part of the commercial opportunity behind a manufacturing constraint.
Virtual reality (VR) supports employers distributing immersive instruction across their own operations. By February 28, 2025, Jotun had sent 70 VR sets from its Norway head office to production facilities and regional offices worldwide for training in basic employee routines. Where sites teach the same routine, training content can be reused across locations, increasing its potential audience without requiring a different application for every headset.
By End-user Industry:
Content Earnings and Clinical Practice Shape AdoptionGaming and entertainment was the largest segment, accounting for 38.21% of revenue in 2026. Meta's games director reported that more than 100 titles on its store generated over USD 1 million in gross revenue in 2025. The game types reaching that threshold were diverse, according to Meta. This gives developers a commercial reference point at the title level, where differentiation can come from selecting an experience and audience within the same device ecosystem. Meta also said Horizon Store gross revenue rose only very slightly in 2025 from 2024, a new-headset year, placing those title receipts within a slowly growing store.
Healthcare and life sciences are forecast to be the fastest-growing segment, with a CAGR of 40.7% from 2027 to 2032. In June 2026, Bergen New Bridge Medical Center in Paramus, New Jersey, launched Osso VR nurse training for onboarding and procedural practice, including IV insertion and central-line dressing changes. The Princess Alexandra Hospital NHS Trust also signed a one-year Oxford Medical Simulation Limited platform-access contract for a foundation school training requirement, covering August 12, 2025, to August 11, 2026. Both applications link XR to defined medical instruction, giving suppliers an application anchored in skills practice and structured access. The one-year Princess Alexandra term ended on August 11, 2026, leaving repeat platform revenue dependent on another access agreement.
Geography Analysis
North America Extended Reality (XR) Market
North America accounted for 36.37% of the extended reality (XR) market size in 2026, making it the largest geography. In spring 2025, the U.S. Air Force ordered 31 enhanced immersive training devices for Fighter Bomber Fundamentals, intended to support high-fidelity instruction for 500 students annually. The Defense Innovation Unit transitioned Vertex Solutions and Metrea Simulations to production contracts for that training requirement. Because the order was sized to stated annual student throughput, suppliers face a production-delivery requirement attached to a defined training program.
Asia-Pacific Extended Reality (XR) Market
Asia-Pacific is forecast to be the fastest-growing geography, with a CAGR of 41% from 2027 to 2032. China's National Film Administration supported public VR film screenings in cinemas and other permanent buildings meeting national safety standards through its 2025 notice. Cinemas may file with their approving film authority, other qualifying venues may apply for a film-screening business license, and venues holding or applying for that license must connect to the national film ticketing system. Content, terminals, playback software, and venues must meet national technical standards. The commercial opening pairs venue operation with compliant content and playback integration, allowing equipment suppliers to compete for the screening installation as a system.
South America, Europe, and the Middle East and Africa show different institutional uses, ranging from industrial routines to formal pilot training and clinical rehearsal. Nestlé launched its VR- and AI-enabled NesVerso platform at Caçapava in Brazil in April 2025, with autonomous maintenance as the first course. Switzerland's BRUNNER Elektronik gained June 2025 qualification to European Union Aviation Safety Agency standards for Varjo-powered NOVASIM MR DA42, a Flight and Navigation Procedures Trainer II replicating Diamond DA42 for recognized civilian training hours. Saudi Arabia's King Faisal Specialist Hospital & Research Centre reported in June 2025 that its Academic & Training Affairs division was deploying VR for clinician rehearsal from emergency care to surgical planning. European qualification links MR to recognized training credit, while the factory and hospital examples emphasize task-specific rehearsal, creating different content and implementation requirements.
Regulatory Framework and Outlook
Selected jurisdictions are compared from the perspective of suppliers commercializing connected XR hardware and associated software. The United States provides conditional 6 GHz operating paths, while Brazil and Germany apply equipment frameworks to covered products. China's recommended handheld AR standard and XR haptics guidance provide product-specific technical benchmarks. China also requires manufacturers or importers of radio transmission equipment intended for domestic sale or use to apply for type approval, except for micro-power short-distance equipment.
Regulatory Table of Extended Reality (XR) Market
| Decision factor | United States | Brazil | Germany | China |
|---|---|---|---|---|
| Primary authority | Federal Communications Commission | Agência Nacional de Telecomunicações (Anatel) | Bundesnetzagentur | National Standards Administration of China |
| Key instruments or direction | FCC 24-125; FCC 26-1, effective April 27, 2026 | Resolution 715/2019 as amended by Resolution 780/2025 | FuAG and EMVG; applicable AI Act provisions | Recommended GB/T 45286-2025; guidance GB/Z 202-2026 |
| Commercial effect | 6 GHz access for covered very-low-power or geofenced variable-power devices, subject to class-specific conditions | Homologation before use or sales of covered telecom products; pre-import approval where procedures require it | Radio and electromagnetic-compatibility conformity; AI duties where the system falls within scope | Technical references for handheld AR and model-based XR haptics |
| Current policy attractiveness | High | Medium | Medium | Medium |
| Future direction of policy attractiveness | Easing | No change | Hardening | No change |
| Source: Mordor Intelligence | ||||
United States attractiveness benefits from the April 27, 2026 permission for geofenced variable-power operation in U-NII-5 and U-NII-7, adding a design route under geofencing and interference-protection requirements. Brazil's amendments under Resolution 780/2025 took effect in December 2025, making sellers and digital platforms involved in covered telecom sales jointly liable, including for homologation-code disclosure and verification, and Anatel's pre-import homologation procedure under Ato 18.086/2025 took effect May 25, 2026, so both changes are already operative and Anatel records its review of Resolution 715 as closed, supporting a No change reading. Germany's conditional AI Act phases apply on December 2, 2027, for specified Annex III high-risk systems and on August 2, 2028, for high-risk AI embedded in regulated products covered by Annex I. China's Medium rating reflects conditional radio approval, while the August 1, 2025 ultra-wideband (UWB) transition permits previously approved equipment to be sold and used until retirement, supporting No change for suppliers retaining those designs.
Value Chain Stages
The value chain compares device supply, application development, and deployment services, with different stages capturing earnings through equipment sales, software access, and contracted support. Unity sells paid Pro subscriptions that include tools for building 3D spatial apps for Apple Vision Pro. Operator XR LLC, xReality Group Limited's wholly owned U.S. subsidiary, bundles implementation, training, and support with VR training systems.
Value Chain Analysis Table of Extended Reality (XR) Market
| Primary activity | Key participants | Value capture | Bottleneck | Resilience response |
|---|---|---|---|---|
| Device supply | Headset brands such as Meta Platforms Inc. (Reality Labs) and Samsung Electronics Co. Ltd. | Headset sales | Coordinating the device and platform configuration | Validate platform configurations before application rollout |
| XR application development | XR software providers such as Unity Technologies Inc. and PTC | Paid development-tool subscriptions such as Unity Pro | Validation effort across target devices | Reuse core content and test device-specific interactions |
| Deployment and support | XR system suppliers such as Operator XR LLC, xReality Group Limited's wholly owned U.S. subsidiary | Contract payments for bundled implementation, training, and support | Application-specific setup and user training | Arrange implementation and train users before handover |
| Source: Mordor Intelligence | ||||
Software-tool subscriptions and bundled implementation contracts monetize different capabilities around the XR deployment process. Development tools cover multiple target platforms, while implementation and training address a customer's operating use. When implementation and support are included in a system award, deployment expertise becomes part of what suppliers sell, so product availability alone does not complete the commercial offering.
Competitive Landscape
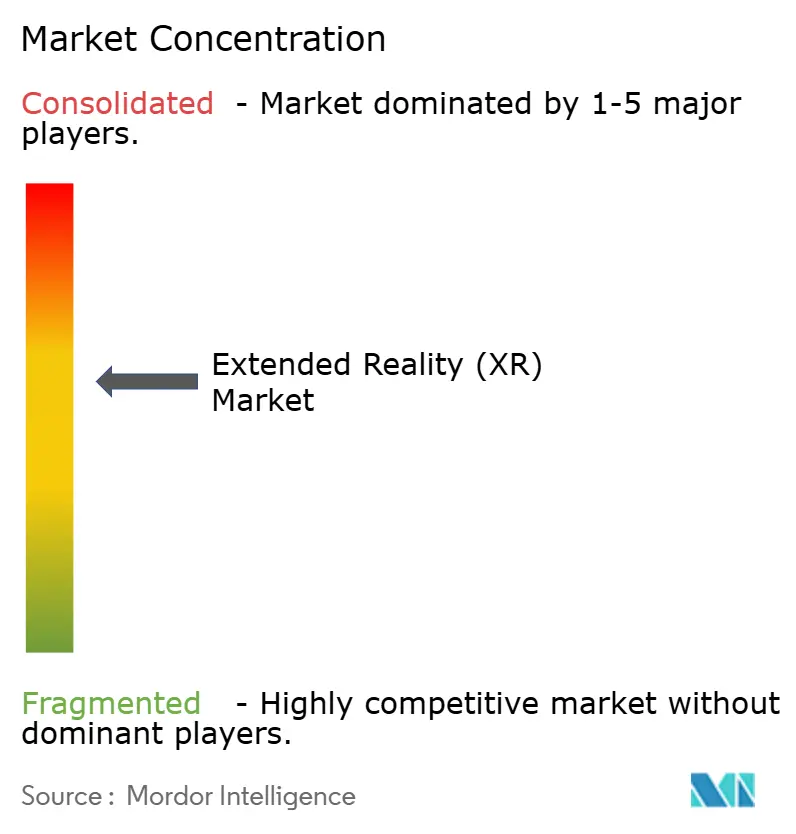
Competition is moderately concentrated at the platform level, with large technology companies spanning processing, headsets, and software. Qualcomm Technologies Inc. supplies the XR processor platform for Galaxy XR, and Meta Platforms Inc. (Reality Labs) sells Quest headsets. Sony Group Corp. participates through Sony Interactive Entertainment's PlayStation VR2, while Microsoft Corp. provides immersive collaboration software and Apple Inc. supplies Vision Pro and visionOS. Meta announced a May 20, 2025 start for Quest 3 and Quest 3S sales in Mexico, its first Latin American market for the Quest 3 family. Opening national sales channels can extend the buyer base for an existing platform, making distribution reach a competitive asset alongside processors and devices.
Price actions give headset brands a way to widen access while retaining an established device proposition. In February 2025, Sony Interactive Entertainment announced a PlayStation VR2 recommended-price reduction starting in March, with local start dates and bundle availability varying by country or region. On April 15, 2026, Sony Electronics said its XYN spatial-capture software suite for creating 3D assets from real-world spaces was expected to become available to U.S. professional customers starting in summer 2026. The announced software suite extends Sony's competitive direction from consumer headset pricing to professional content production. Those initiatives address different buyers, with affordability influencing player access and spatial capture supporting creators' asset-generation work.
Software lifetimes and deployment eligibility also shape the competitive direction for enterprise XR. By February 2025, Microsoft reported that HoloLens 2 was no longer manufactured and was out of stock in all geographies. Commercially licensed organizers, co-organizers, and attendees can use Teams Immersive on PC, Mac, and Meta Quest until its scheduled April 2, 2027 retirement, with support continuing until then. Microsoft's GCC, GCCH, sovereign-cloud, and EDU environments are excluded. Supported environments and service lifetimes become separate tests for compliance-sensitive XR projects, each capable of ruling out an otherwise attractive hardware and software combination.
Extended Reality (XR) Industry Leaders
-
Qualcomm Technologies Inc.
-
Meta Platforms Inc. (Reality Labs)
-
Sony Group Corp.
-
Microsoft Corp.
-
Apple Inc.
- *Disclaimer: Major Players sorted in no particular order
Extended Reality (XR) Market Companies Covered in this Report
- Meta Platforms Inc. (Reality Labs)
- Sony Group Corp.
- Microsoft Corp.
- Apple Inc.
- HTC Corp. (Vive)
- Qualcomm Technologies Inc.
- Samsung Electronics Co. Ltd.
- Alphabet Inc. (Google XR)
- Pico Interactive Inc. (ByteDance)
- Varjo Technologies Oyj
- Magic Leap Inc.
- Nvidia Corp.
- Unity Technologies Inc.
- Vuzix Corp.
- Lenovo Group Ltd.
- Snap Inc.
- Niantic Spatial Inc.
- Ultraleap Ltd.
- HP Inc.
- Immersion Corp.
Key Opportunities for Market Participants
These opportunities compare managed device services, dedicated enterprise applications, and additional flight-training capacity as routes to XR revenue. On April 8, 2026, Samsung Electronics added Android Enterprise support to Galaxy XR for fully managed and dedicated corporate-owned deployments. Fully managed and dedicated-device modes separate fleet administration from the design of a specific XR application.
Market Opportunities Table of Extended Reality (XR) Market
| Opportunity | Why now | Buyer / lead segment | Recommended play | Main barrier | Likely beneficiaries |
|---|---|---|---|---|---|
| XR fleet implementation and support | Galaxy XR corporate-owned fleet controls | Enterprise training and technology teams | Package setup, application deployment, and support | Integrating fleet controls with the training application | Samsung Electronics Co. Ltd.; XR deployment providers |
| Dedicated industrial XR stations | Galaxy XR dedicated-device support | Manufacturing engineering and training teams | Build task-specific applications for shared workstations | Task-specific content and workflow integration | Samsung Electronics Co. Ltd.; industrial XR developers |
| Additional immersive flight-training systems | Demand for high-fidelity pilot-training capacity | Military aviation training organizations | Adapt simulator packages to defined aircraft-training requirements | Platform-specific simulation and training acceptance | Vertex Solutions; Metrea Simulations |
| Source: Mordor Intelligence | |||||
The documented management modes concern corporate-owned devices, placing their immediate opportunity with institutional fleets and shared workstations. For flight-training suppliers, the opportunity centers on systems adapted to a defined instructional requirement. Across the opportunities, the central opening is a repeatable application package that combines content, configuration, and support for an identified buyer task.
Recent Industry Developments in Extended Reality (XR) Market
- Sep 2026: Meta opened Meta Ray-Ban Display online ordering in the United States, Canada, and the United Kingdom, and announced progressive preorders in France, Italy, and Germany, naming October 13 as the planned retail start.
- Sep 2026: Snap introduced SPECS Intelligence for its SPECS AR glasses and opened a U.S. iOS preview for users aged 18 and older.
- Apr 2026: Samsung Electronics Co. Ltd. added Android Enterprise support to Galaxy XR, including fully managed and dedicated-device use cases for corporate-owned deployments.
Extended Reality (XR) Market Report Scope and Research Methodology
Market Definition and Coverage
The extended reality (XR) market measures annual spending worldwide on hardware, software, and services that deliver or support virtual, augmented, or mixed reality experiences for consumer and enterprise use. It includes XR offerings sold across all regions.
Scope exclusions: Standalone content that is not designed for AR, VR, or MR usage and non-XR 2D display-only solutions are excluded.
Segments Covered in This Report
- By Offering
- Hardware
- Software
- Services
- By Device Type
- Head-Mounted Displays (Tethered, Stand-alone)
- Head-Up Displays
- Handheld and Mobile Devices
- Others
- By Technology
- Virtual Reality (VR)
- Augmented Reality (AR)
- Mixed Reality (MR)
- By End-user Industry
- Gaming and Entertainment
- Healthcare and Life Sciences
- Industrial and Manufacturing
- Retail and E-commerce
- Education and Training
- Aerospace and Defense
- Architecture, Engineering and Construction
- Others
- By Geography
- North America
- United States
- Canada
- Mexico
- South America
- Brazil
- Argentina
- Rest of South America
- Europe
- United Kingdom
- Germany
- France
- Italy
- Spain
- Rest of Europe
- Asia-Pacific
- China
- Japan
- South Korea
- India
- Australia
- Rest of Asia-Pacific
- Middle East and Africa
- Middle East
- Saudi Arabia
- United Arab Emirates
- Turkey
- Rest of Middle East
- Africa
- South Africa
- Nigeria
- Egypt
- Rest of Africa
- Middle East
- North America
Data Sources, Market Sizing, and Validation
Desk Research
Public sources such as International Telecommunication Union data, 3GPP technical work, Google for Developers' ARCore documentation, and the Khronos Group's OpenXR materials provide indicators on connectivity, rendering architecture, device capability, and software interoperability. Analysts use those indicators to assess infrastructure readiness and interoperability across regions and device types.
Company filings, investor disclosures, product information, deployment releases, and reputable press can add evidence on supplier activity, pricing, launches, procurement, and use cases. Analysts compare those signals with public technical sources and the market boundary. The named sources are not exhaustive, and further sources inform collection, validation, and clarification.
Primary Interviews and Surveys
Interviews and structured surveys would include XR hardware, software, and service suppliers, channel participants, and consumer and enterprise buyers across APAC, EMEA, and the Americas. Functional and unit leaders can validate secondary findings on selling prices, deployment timing, use by end-user industry, and offering mix, while CXOs and managers can clarify growth assumptions and commercial constraints. Analysts would investigate conflicting evidence through targeted follow-up, record unresolved gaps for sensitivity treatment, and triangulate responses against public disclosures and sampled supplier or channel evidence.
Distribution of primary research fieldwork respondents
| Company type | Respondent position | Region |
|---|---|---|
| Top tier: 35% | CXOs: 20% | APAC: 40% |
| Mid tier: 40% | Functional/Unit leaders: 30% | EMEA: 32% |
| Smaller Players: 25% | Managers: 50% | Americas: 28% |
Market-Sizing & Forecasting
The analyst anchors a top-down estimate in global spending on XR offerings and reconciles it with selective supplier roll-ups, channel checks, and sampled average selling price multiplied by unit volume for devices. Evidence on headset and smart-glasses shipments and prices, enterprise deployment and training activity, mobile and 5G coverage, and disclosed software and service activity helps build annual value estimates and segment shares across offering, device type, technology, end-user industry, and region. A multivariate regression can relate those indicators to market value, with scenario analysis testing different adoption and price paths. Primary interviews challenge variable assumptions and help reconcile conflicting inputs. Where supplier or channel data are incomplete, the analyst bounds sampled estimates with public shipment, price, and company evidence, then tests affected assumptions in scenarios rather than treating them as fully observed totals.
Data Validation & Update Cycle
Analysts triangulate supplier disclosures, shipment and price indicators, technology and connectivity evidence, and buyer or channel signals, then investigate anomalies and variances against prior periods and related indicators before sign-off. They document the resolution, re-contact respondents when definitions, timing, or reported values conflict materially, refresh the model annually, reassess it after material market events, and complete a fresh pre-delivery review.
Mordor Intelligence's Extended Reality Xr Market Size Measured Against Other Published Estimates
Published estimates can differ in the transactions and products they count and the inputs used to model demand. The extended reality (XR) market measures annual spending worldwide on hardware, software, and services that deliver or support virtual, augmented, or mixed reality experiences for consumer and enterprise use.
Key Gap Drivers include the study's defined coverage and market-specific modeling choices. A multivariate regression can relate those indicators to market value, with scenario analysis testing different adoption and price paths.
Benchmark comparison
| Source | Market Size | Gaps in Research Methodology |
|---|---|---|
| Mordor Intelligence | USD 15 B (2027) | |
| Market Research Firm A | USD 8.26 B (2025) | At its 2025 base, this estimate is 44.9% below this report's 2027 value of USD 15 B, 2 years later. Its published rising forecast makes a lower earlier-year value directionally consistent with a later-year market measure. |
| Market Research Firm B | USD 264.4 B (2025) | At its 2025 base, this estimate is 1662.7% above this report's 2027 value of USD 15 B, 2 years later. The source associates XR with general monitor, projector, television-reception, and electronic-component classifications beyond XR-specific offering sales. |
Mordor Intelligence's analysts triangulate supplier disclosures, shipment and price indicators, technology and connectivity evidence, and buyer or channel signals, then investigate anomalies and variances against prior periods and related indicators before sign-off.
Key Questions Answered in the Report
What is the Extended Reality (XR) market size and projected growth?
It is projected to grow from USD 15 billion in 2027 to USD 81.98 billion by 2032, at a CAGR of 40.45% from 2027 to 2032.
What is driving adoption of XR products and services?
Industrial digital twins, immersive training, and phone-based AR support adoption. In 2026, Vertex Solutions completed fielding 25 T-38 mixed-reality training devices across 4 U.S. Air Force pilot-training bases.
Which XR offering has the largest revenue share?
Hardware accounted for 52.25% of XR revenue in 2026, while services are forecast to grow fastest at a CAGR of 40.9% from 2027 to 2032.
Which companies compete in the XR industry?
The competitive field includes Qualcomm Technologies Inc., Meta Platforms Inc. (Reality Labs), Sony Group Corp., Microsoft Corp., and Apple Inc., spanning XR processing, headsets, and software.
What could limit wider use of immersive XR systems?
Equipment costs and prolonged-use discomfort can constrain adoption. One expert interviewed in early 2025 cited Apple Vision Pro's USD 3,499 price as a potential purchase deterrent in VR shopping.
Which region leads XR spending and which is forecast to grow fastest?
North America held 36.37% of XR revenue in 2026. Asia-Pacific is forecast to grow fastest, at a CAGR of 41% from 2027 to 2032.