Mixed Reality Market Size and Share
Market Overview
| Study Period | 2020 - 2031 |
|---|---|
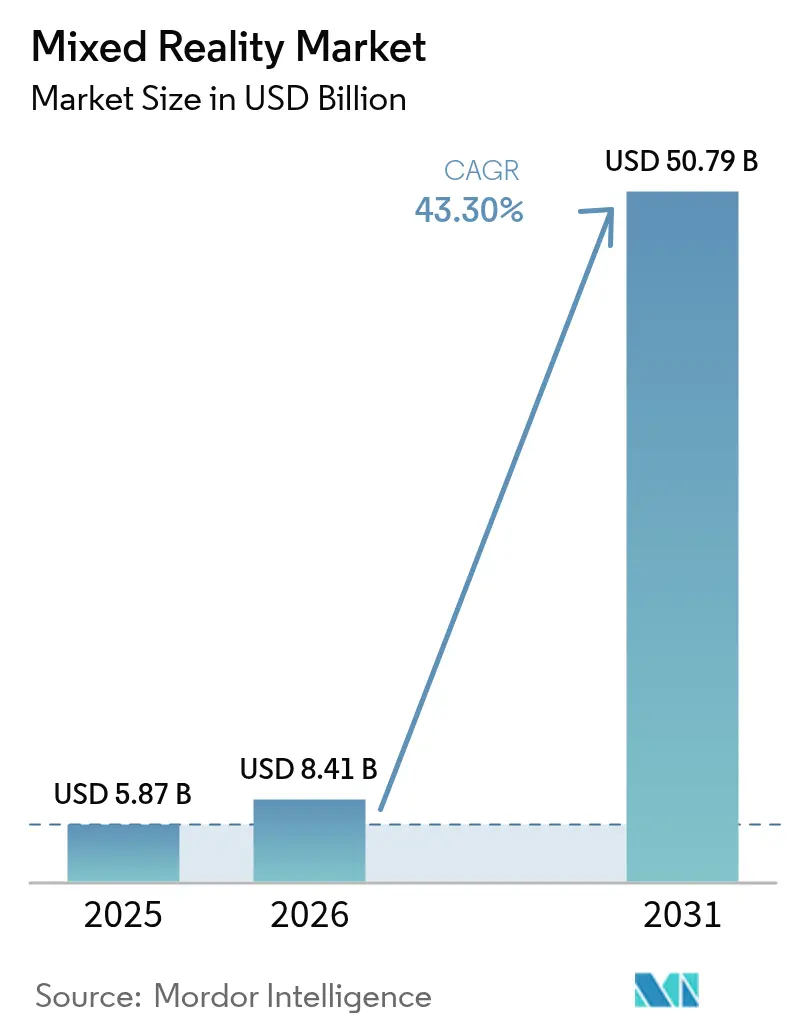
| Market Size (2026) | USD 8.41 Billion |
| Market Size (2031) | USD 50.79 Billion |
| Growth Rate (2026 - 2031) | 43.30% CAGR |
| Fastest Growing Market | Asia Pacific |
| Largest Market | North America |
| Market Concentration | Medium |
Major Players *Disclaimer: Major Players sorted in no particular order Image © Mordor Intelligence. Reuse requires attribution under CC BY 4.0. | |
Mixed Reality Market Analysis by Mordor Intelligence
The mixed reality market size is expected to grow from USD 5.87 billion in 2025 to USD 8.41 billion in 2026 and is forecast to reach USD 50.79 billion by 2031 at 43.3% CAGR over 2026-2031. Accelerated enterprise uptake of immersive training platforms, regulatory clearance for medical visualization systems, and the rollout of 5G-enabled edge networks underpin this steep growth path. Enterprise projects now document training cost reductions of as much as 90% versus legacy classroom methods. Hardware vendors are capitalizing on demand for self-contained headsets, while software producers increasingly embed large language models that streamline object manipulation tasks. The mixed reality market continues to benefit from broad capital inflows; a USD 3 billion funding round for Infinite Reality in January 2025 exemplifies escalating investor confidence.[1]OpenTools.ai, “Infinite Reality Makes Waves with $3 Billion Funding Round,” opentools.ai Despite momentum, high device pricing and battery-life constraints still limit outdoor workflows, yet passthrough-first architectures cut cybersickness by 44%, easing a key adoption barrier.
Key Report Takeaways
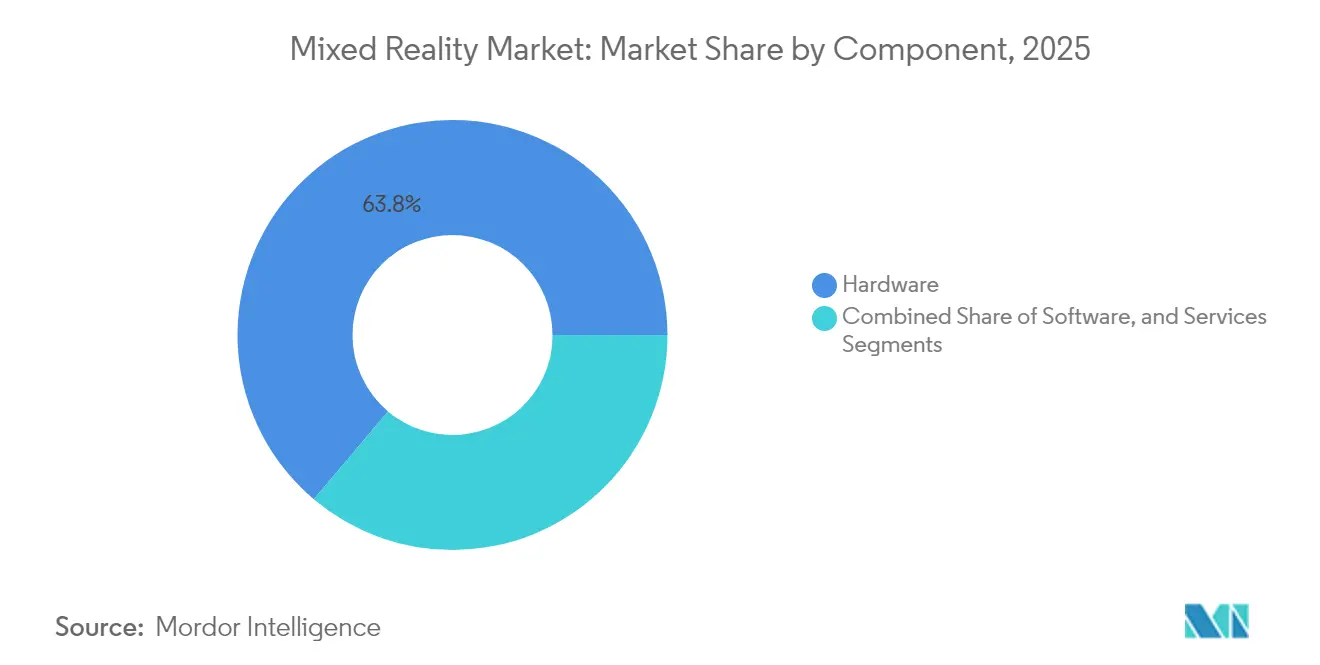
- By component, hardware led with 63.84% of mixed reality market share in 2025, whereas services are slated to post a 44.57% CAGR through 2031.
- By device type, standalone headsets captured 52.10% revenue share in 2025 in the mixed reality market, and the same category is projected to grow at a 44.25% CAGR to 2031.
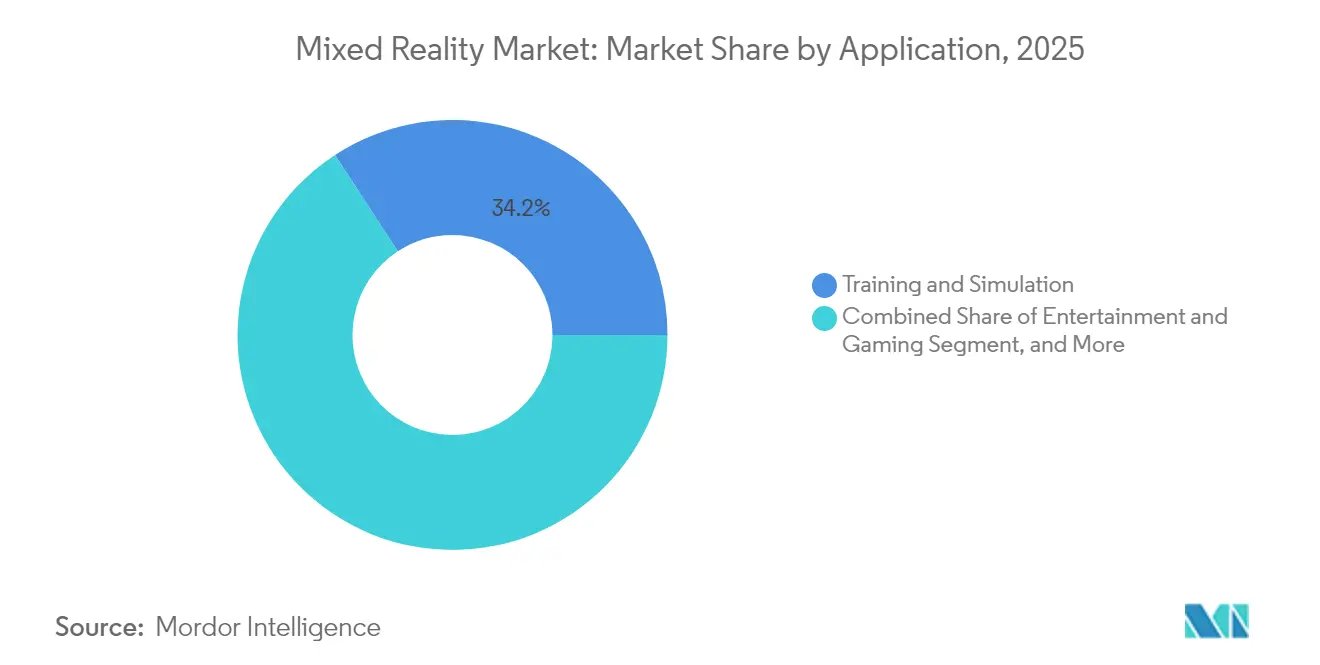
- By application, training and simulation held 34.20% of 2025 revenues in the mixed reality market, while surgical planning and visualization is forecast to advance at a 44.10% CAGR through 2031.
- By end-user industry, manufacturing commanded 28.10% share in 2025 in the mixed reality market, while healthcare is poised for the fastest 43.95% CAGR over the next five years.
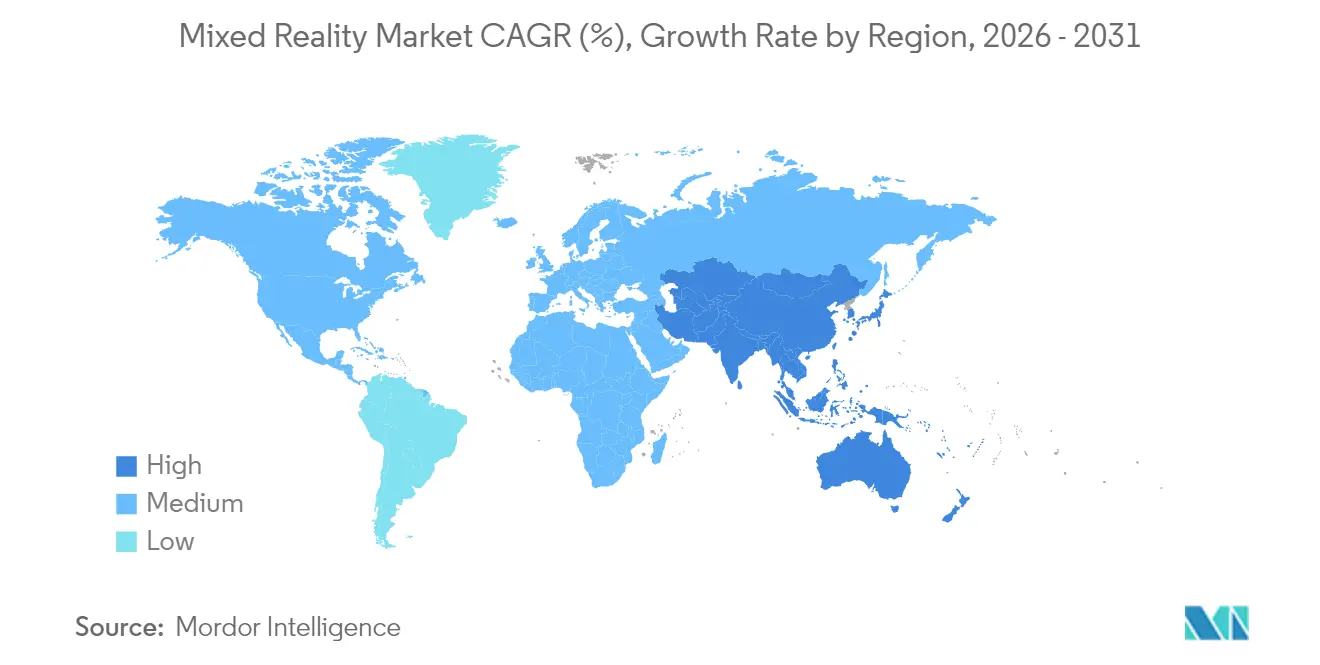
- By geography, North America accounted for 38.05% of 2025 spending in the mixed reality market, whereas Asia Pacific is expected to register a 44.80% CAGR to 2031.
Note: Market size and forecast figures in this report are generated using Mordor Intelligence’s proprietary estimation framework, updated with the latest available data and insights as of 2026.
Global Mixed Reality Market Trends and Insights
Drivers Impact Analysis*
| Driver | (~) % Impact on CAGR Forecast | Geographic Relevance | Impact Timeline |
|---|---|---|---|
| Enterprise training and collaboration demand surge | +12.8% | Global, with early gains in North America and Europe | Medium term (2-4 years) |
| 5G and edge-computing enabled low-latency MR | +10.5% | APAC core, spill-over to North America | Short term (≤ 2 years) |
| Big-Tech investment wave in MR ecosystem | +8.7% | Global, concentrated in US and China | Long term (≥ 4 years) |
| Aging-workforce push for spatial expert guidance | +6.9% | North America and EU, expanding to APAC | Medium term (2-4 years) |
| Regulatory nods for MR-assisted surgery | +4.2% | North America and EU primarily | Short term (≤ 2 years) |
| Passthrough-first consumer devices reduce cybersickness | +3.1% | Global consumer markets | Medium term (2-4 years) |
| Source: Mordor Intelligence | |||
Enterprise Training and Collaboration Demand Surge
Mixed reality training programs now slash instruction time by 75% and raise knowledge retention to 90% at firms such as Boeing, demonstrating hard savings that drive board-level sponsorship. A continued shift toward hybrid work increases the value of immersive, multi-user digital workspaces that allow 3D model co-editing, real-time annotation, and spatial whiteboarding. Industrial assemblers embed headset-based guidance for aging technicians, cutting assembly errors while preserving institutional expertise. Because these deployments operate over secure cloud links, companies can pool specialist knowledge globally without incurring travel delays. Artificial intelligence modules dynamically adapt task difficulty to a trainee’s performance, fostering individualized learning curves that reduce time to competency.
5G and Edge-Computing Enabled Low-Latency MR
Commercial 5G rollouts and dense edge nodes now cut round-trip latency to below 20 ms, enabling lifelike interaction with photorealistic 3D assets.[2]IEEE, “Mixed Reality-Based Outdoor Training System to Improve Football Player Performance,” ieeexplore.ieee.org Field engineers livestream on-site video to remote experts who overlay spatial annotations that guide repairs in real time. Compute off-loading to the network edge keeps headset form factors light and extends battery cycles, a crucial benefit for shift-length industrial usage. APAC operators spearhead network slicing pilots that guarantee bandwidth for high-priority mixed reality sessions even during peak traffic windows. As coverage spreads across manufacturing corridors, latency-sensitive tasks such as robotic tele-operation and surgical tele-mentoring become technically feasible.
Big-Tech Investment Wave in MR Ecosystem
A surge of headline-scale financing accelerates platform maturity; Magic Leap raised USD 590 million in 2024, and Infinite Reality closed USD 3 billion in 2025 to fund AI-driven spatial computing research. Capital inflows bankroll breakthroughs in retina-class displays, multi-modal hand-eye tracking, and ultra-low-power chipsets. Cloud hyperscalers integrate headset APIs into their enterprise collaboration suites, collapsing hardware, software, and infrastructure into unified licensing bundles. Competition between incumbent tech giants and specialist startups stimulates rapid feature rollouts such as gaze-based menu navigation and haptic feedback. Cross-industry consortia pursuing OpenXR 1.1 standards further lower developer barriers and broaden application portability.
Aging-Workforce Push for Spatial Expert Guidance
Retirement waves in industrialized economies risk erasing decades of tacit knowledge, prompting factories to archive best-practice procedures as spatial walkthroughs accessible on demand. Mixed reality remote-assist platforms let veteran technicians annotate live video feeds atop physical machinery, transferring expertise without travel expenses or safety risks. Captured sessions become reusable 3D tutorials that accelerate onboarding for junior staff. Firms deploying these systems report fewer production stoppages and greater process consistency as novices follow step-by-step holographic cues. The approach aligns with broader corporate digitization drives, making knowledge captured once available indefinitely
Restraints Impact Analysis*
| Restraint | (~) % Impact on CAGR Forecast | Geographic Relevance | Impact Timeline |
|---|---|---|---|
| High upfront hardware cost | -8.4% | Global, particularly price-sensitive markets | Short term (≤ 2 years) |
| Data-privacy and security concerns | -5.7% | EU and North America primarily | Medium term (2-4 years) |
| Limited battery life for outdoor workflows | -4.1% | Global field operations | Short term (≤ 2 years) |
| Fragmented hand/eye-tracking standards | -2.8% | Global development ecosystem | Long term (≥ 4 years) |
| Source: Mordor Intelligence | |||
High Upfront Hardware Cost
Enterprise-grade head-mounted displays list from USD 3,299 to USD 4,999, straining IT budgets, especially in sectors with narrow margins. Consumer uptake mirrors the issue; surveys show 65% of prospects cite price as the primary deterrent. Vendors experiment with leasing models and per-seat subscriptions to smooth cash burdens, but optical-grade waveguides and custom silicon keep bill-of-materials high. Component commoditization is slow because demand for premium image quality and low latency locks manufacturers into specialized supply chains. Sub-USD 200 companion devices such as XREAL Beam Pro hint at a low-cost on-ramp, yet the broader mixed reality market still contends with sticker shock.
Limited Battery Life for Outdoor Workflows
Outdoor field technicians require full-shift operation, yet most all-in-one headsets offer 3–4 hours of continuous use, extending to 8–12 hours only under optimal conditions.[3]Argenie.ai, “Industrial AR Glasses for Manufacturing, Maintenance & Operations in 2025,” argenie.ai Auxiliary battery packs add weight and reduce mobility. Edge off-loading and new low-power displays modestly prolong runtime, but thermal constraints remain. Energy-dense solid-state cells under development promise relief, yet commercialization is several years off. For now, swappable battery designs and high-capacity belt holsters partially mitigate downtime but complicate ergonomic considerations.
*Our forecasts treat driver/restraint impacts as directional, not additive. The impact forecasts reflect baseline growth, mix effects, and variable interactions.
Segment Analysis
By Component: Services Drive Integration Complexity
The services segment is forecast to grow at a 44.57% CAGR, reflecting rising demand for system design, application development, and lifecycle support as enterprises scale deployments. Hardware still constituted 63.84% of mixed reality market size in 2025, cementing its role as the baseline revenue driver. Vendors bundle managed services into multi-year contracts, stabilizing income streams beyond one-time device sales. Post-implementation support becomes critical as firmware updates, spatial map management, and security patches are required to keep fleets compliant and performant.
Professional services teams now tackle complex middleware integration, linking headset telemetry to MES, ERP, or PACS platforms. This added value justifies premium hourly rates and deepens customer lock-in. Cloud-native delivery models simplify patch distribution and analytics dashboards, yet they push organizations to secure new budget lines for consumption-based fees. As platforms mature, a shift toward low-code authoring tools could eventually temper services growth, but the window remains at least three years wide where expert consultancies capture sizable wallet share.


By Device Type: Standalone Systems Capture Market Leadership
Standalone headsets represented 52.10% of the 2025 mixed reality market share and are projected for a 44.25% CAGR through 2031. Untethered form factors find favor in manufacturing lines and healthcare wards where cable-free movement boosts safety and productivity. Integrated Snapdragon and Apple silicon chipsets now deliver console-grade graphics at sustainable thermals, eliminating the need for backpack PCs. Forward-looking roadmaps add metasurface antennas to improve 5G reception without bulk.
Tethered rigs retain a niche among design engineers who require workstation-class rendering for high-polygon prototypes. Meanwhile, smartphone-enabled kits carve out a cost-sensitive consumer segment, riding on global handset penetration levels. Projection-based solutions target architecture studios that value room-scale visualization without goggles. Device makers increasingly converge on inside-out 6-DoF tracking, reducing setup friction and expanding addressable use cases across public venues.
By Application: Healthcare Drives Surgical Innovation
Training and simulation produced the largest 34.20% revenue slice in 2025, demonstrating the strongest early-stage product-market fit. Surgical planning and visualization sits at the vanguard of growth with a 44.10% CAGR, buoyed by clinical validations. Hospitals overlay CT and MRI scans as holograms directly onto patients, enhancing incision accuracy and confidence. Remote assistance scenarios allow off-site specialists to consult live during procedures, broadening access to scarce expertise.
Product design and prototyping adopt mixed reality to collapse iteration cycles; 3D concepts are manipulated at full scale, reducing physical mock-up costs. Entertainment remains cyclical yet promises higher margins once blockbuster titles showcase the medium’s unique storytelling vocabulary. Education institutions integrate headsets to create immersive labs that engage students through tangible, spatial problem solving. Adaptive AI tutors analyze gaze and gesture patterns, modulating task complexity on the fly.
By End-user Industry: Manufacturing Leads Enterprise Adoption
Manufacturing accounted for 28.10% of 2025 revenue, leveraging headsets for assembly guidance, inline quality inspections, and predictive maintenance. Digital work instructions displayed in a technician’s field of view shave downtime and enforce standard operating procedures. Healthcare, by contrast, is poised for the sharpest 43.95% CAGR as MR gains regulatory and clinical traction. Anatomy visualization tools enrich medical curriculums while intra-operative overlays improve surgeon precision.
Architecture, engineering, and construction professionals benefit from clash detection and site visualization that reduce rework and cost overruns. Defense agencies deploy realistic mission rehearsals within secure simulation domes, minimizing live-fire training expenditures. Retailers pilot virtual try-on kiosks that lift conversion rates and lower return logistics. As more verticals build specialized content libraries, cumulative application breadth strengthens vendor bargaining power.
Geography Analysis
North America led with 38.05% of 2025 spending, anchored by early enterprise pilots and dense 5G coverage grids. The region houses most top-tier platform vendors, facilitating faster proof-of-concept cycles. Asia Pacific, however, is set to outpace all peers at a 44.80% CAGR, catalyzed by robust consumer electronics supply chains and ambitious state-sponsored digital agendas. China’s domestic shipments reached 262,000 AR units in 2023, a 154.4% annual jump that signals maturing demand.
India’s extended reality outlays surged from below USD 2 billion in 2020 to beyond USD 6.5 billion by 2022, revealing an appetite for enterprise and entertainment platforms alike. Europe shows steady gains as strict data-privacy regulation nudges vendors toward secure on-premises deployments tailored to industrial firms. Latin America and the Middle East exhibit sporadic adoption, mainly in the oil & gas and telecom sectors that possess capex flexibility. Africa lags but may leapfrog via mobile-first solutions as affordable devices proliferate.

Competitive Landscape
The mixed reality market exhibits moderate fragmentation, with no single vendor controlling more than one-third of shipments. Meta, Apple, and Samsung contend with niche specialists such as RealWear and Vuzix that tailor ruggedized models for harsh environments. Apple’s Vision Pro, released in 2025, integrates high-precision hand tracking and enterprise API extensions to court commercial users. Meta’s Quest Pro downshift repositioned toward corporate collaboration after lukewarm consumer adoption.
Microsoft’s exit from HoloLens manufacturing creates white-space for emerging hardware providers that pledge long-term support roadmaps. Qualcomm leverages vertical integration, aligning chipsets with reference designs in collaboration with Samsung and Google. Chinese entrants like ByteDance’s Pico 4 Ultra iterate rapidly, shortening product cycles to under 18 months and compressing price brackets. Standardization via OpenXR erodes lock-in, shifting competition toward display optics, battery life, and AI-powered interaction models.
Strategic moves increasingly center on vertical specialization: RealWear’s Navigator series integrates noise-canceling microphones for loud factory floors, while surgical device makers partner with software ISVs for FDA-cleared navigation suites. Cloud providers bundle spatial-computing resources with consumption-based GPU tiers, tying customers into broader IaaS ecosystems. As intellectual property around waveguides and micro-LED fabrication matures, economies of scale could eventually tip the balance toward a handful of dominant hardware vendors.
Mixed Reality Industry Leaders
Microsoft Corporation
Meta Platforms, Inc.
Dell Technologies Inc.
Hewlett Packard Enterprise Company
AsusTek Computer Inc.
- *Disclaimer: Major Players sorted in no particular order


Recent Industry Developments
- March 2025: Apple released iOS 18.4 with upgraded spatial-computing frameworks that refine Vision Pro hand-tracking fidelity.
- January 2025: Infinite Reality secured USD 3 billion in funding at a USD 12.25 billion valuation to accelerate AI-integrated MR cloud services.
- September 2024: ByteDance launched Pico 4 Ultra in China, adding advanced mixed reality features to compete with global incumbents.
- August 2024: XREAL debuted Beam Pro, a USD 199 Android spatial-computing terminal compatible with smart glasses.


Global Mixed Reality Market Report Scope
Mixed reality combines the aspects of the virtual world with those of the real world. It enables users to interact with two worlds. The scope of the study focuses on a global market analysis of Mixed reality products. Market sizing encompasses the revenue generated through mixed reality products across the globe sold by various market players. The study also tracks the key market parameters, underlying growth influencers, and major vendors operating in the industry, which supports the market estimations and growth rates over the forecast period. The study further analyzes the overall impact of Covid-19 on the ecosystem. The report's scope encompasses market sizing and forecast for end-user verticals and geography.
The Global Mixed Reality Market is segmented by End-user Verticals (Education, Engineering, Entertainment, Healthcare) and by Geography.
| Hardware | Head-Mounted Displays | Optical See-Through HMDs |
| Video See-Through HMDs | ||
| Sensors and Tracking Systems | ||
| Processors and Memory | ||
| Software | SDKs and Platforms | |
| Visualization Software | ||
| Services | Integration and Deployment | |
| Support and Maintenance |
| Standalone MR Headsets |
| Tethered MR Headsets |
| Smartphone-Enabled MR Devices |
| Projection-Based MR Systems |
| Training and Simulation |
| Product Design and Prototyping |
| Remote Assistance and Collaboration |
| Surgical Planning and Visualization |
| Entertainment and Gaming |
| Education and Cultural Experience |
| Other Applications |
| Healthcare |
| Manufacturing and Industrial |
| Architecture, Engineering and Construction |
| Education |
| Media and Entertainment |
| Defense and Aerospace |
| Retail and E-commerce |
| Other End-user Industries |
| North America | United States | |
| Canada | ||
| South America | Brazil | |
| Argentina | ||
| Rest of South America | ||
| Europe | Germany | |
| United Kingdom | ||
| France | ||
| Italy | ||
| Spain | ||
| Russia | ||
| Rest of Europe | ||
| Asia Pacific | China | |
| Japan | ||
| India | ||
| South Korea | ||
| Australia and New Zealand | ||
| Rest of Asia Pacific | ||
| Middle East and Africa | Middle East | United Arab Emirates |
| Saudi Arabia | ||
| Turkey | ||
| Rest of Middle East | ||
| Africa | South Africa | |
| Nigeria | ||
| Rest of Africa | ||
| By Component | Hardware | Head-Mounted Displays | Optical See-Through HMDs |
| Video See-Through HMDs | |||
| Sensors and Tracking Systems | |||
| Processors and Memory | |||
| Software | SDKs and Platforms | ||
| Visualization Software | |||
| Services | Integration and Deployment | ||
| Support and Maintenance | |||
| By Device Type | Standalone MR Headsets | ||
| Tethered MR Headsets | |||
| Smartphone-Enabled MR Devices | |||
| Projection-Based MR Systems | |||
| By Application | Training and Simulation | ||
| Product Design and Prototyping | |||
| Remote Assistance and Collaboration | |||
| Surgical Planning and Visualization | |||
| Entertainment and Gaming | |||
| Education and Cultural Experience | |||
| Other Applications | |||
| By End-user Industry | Healthcare | ||
| Manufacturing and Industrial | |||
| Architecture, Engineering and Construction | |||
| Education | |||
| Media and Entertainment | |||
| Defense and Aerospace | |||
| Retail and E-commerce | |||
| Other End-user Industries | |||
| By Geography | North America | United States | |
| Canada | |||
| South America | Brazil | ||
| Argentina | |||
| Rest of South America | |||
| Europe | Germany | ||
| United Kingdom | |||
| France | |||
| Italy | |||
| Spain | |||
| Russia | |||
| Rest of Europe | |||
| Asia Pacific | China | ||
| Japan | |||
| India | |||
| South Korea | |||
| Australia and New Zealand | |||
| Rest of Asia Pacific | |||
| Middle East and Africa | Middle East | United Arab Emirates | |
| Saudi Arabia | |||
| Turkey | |||
| Rest of Middle East | |||
| Africa | South Africa | ||
| Nigeria | |||
| Rest of Africa | |||


Key Questions Answered in the Report
How fast is spending on mixed reality expected to grow to 2031?
Global expenditures are projected to rise from USD 5.87 billion in 2025 to USD 50.79 billion in 2031, equating to a 43.3% CAGR.
Which region is expanding the quickest?
Asia Pacific is on track for a 44.80% CAGR, propelled by strong electronics supply chains and proactive 5G rollouts.
What is the leading enterprise use case today?
Training and simulation commands 34.20% of current spending due to measurable gains in productivity and retention.
Why are services outpacing hardware growth?
Organizations need integration, customization, and ongoing support, driving a 44.57% CAGR for services through 2031.
Which end-user sector shows the highest upside?
Healthcare is forecast for a 43.95% CAGR as surgical visualization platforms receive regulatory clearance and clinical buy-in.
Page last updated on:


