
Cone Crusher Market Size and Share
Market Overview
| Study Period | 2020 - 2031 |
|---|---|
| Market Size (2026) | USD 2.05 Billion |
| Market Size (2031) | USD 2.62 Billion |
| Growth Rate (2026 - 2031) | 5.03 % |
| Fastest Growing Market | Asia Pacific |
| Largest Market | North America |
| Market Concentration | Medium |
Major Players *Disclaimer: Major Players sorted in no particular order Image © Mordor Intelligence. Reuse requires attribution under CC BY 4.0. | |
Cone Crusher Market Analysis by Mordor Intelligence
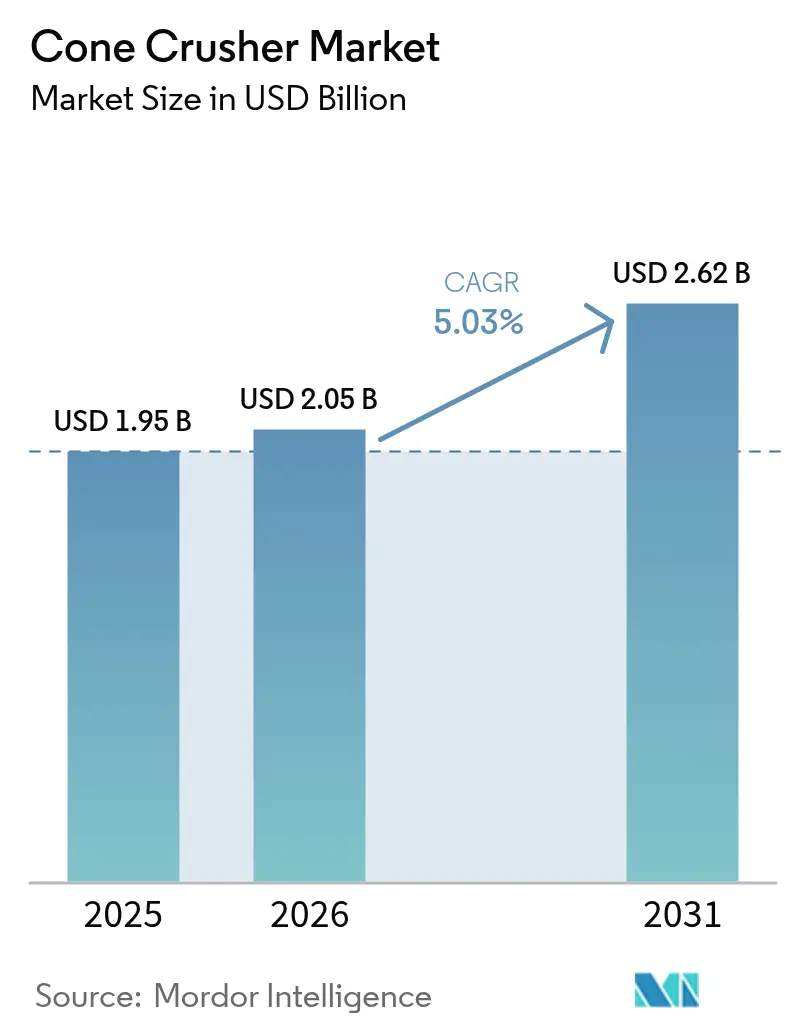
The cone crusher market size is expected to grow from USD 1.95 billion in 2025 to USD 2.05 billion in 2026 and is forecast to reach USD 2.62 billion by 2031 at 5.03% CAGR over 2026-2031. Expanding infrastructure pipelines, widening minerals extraction in emerging economies, and the preference for automated secondary-and-tertiary crushing solutions continue to anchor demand. Operators in mining, construction, and recycling are migrating toward mobile, hydraulically controlled equipment that lowers hauling costs, speeds commissioning, and supports predictive-maintenance workflows. Sustainability mandates are also steering power-source choices, with electrically driven plants gaining prominence where grid access exists. Competitive rivalry is moderate but intensifying as leaders differentiate on digitalization, wear resistance, and service scope.
Key Report Takeaways
- By type, hydraulic cone crushers accounted for 45.12% of global revenue in 2025 in the cone crusher market, while the same segment is forecast to log the fastest 6.51% CAGR through 2031.
- By offering, mobile crushers held 58.05% share in 2025 in the cone crusher market, and the category is expected to expand at a 6.74% CAGR to 2031.
- By power source, electric connection systems commanded 63.05% of 2025 sales in the cone crusher market and will deliver the highest 6.97% CAGR during the outlook period.
- By application, mining and metallurgy remained the largest end-user at 57.20% in 2025 in the cone crusher market, whereas demolition and recycling is poised for the quickest 6.62% CAGR to 2031.
- By geography, North America led with 38.60% revenue share in 2025 in the cone crusher market, while Asia-Pacific is on track for a 6.55% CAGR through 2031.
Note: Market size and forecast figures in this report are generated using Mordor Intelligence’s proprietary estimation framework, updated with the latest available data and insights as of 2026.
Market Trends and Insights
Drivers Impact Analysis of Cone Crusher Market*
| Driver | (~) % Impact on CAGR Forecast | Geographic Relevance | Impact Timeline |
|---|---|---|---|
| Rising demand from mining sector in emerging economies | +1.2% | Asia-Pacific core, spill-over to Latin America | Medium term (2-4 years) |
| Growth of global infrastructure and construction activities | +1.0% | Global, with concentration in APAC and MEA | Long term (≥ 4 years) |
| Rapid adoption of automated and digitalised cone crushers | +0.8% | North America and EU, expanding to APAC | Short term (≤ 2 years) |
| Increasing shift toward mobile crushing solutions | +0.7% | Global, particularly strong in North America and Europe | Medium term (2-4 years) |
| Surge in recycled-aggregate demand (circular-economy push) | +0.6% | EU and North America leading, APAC following | Long term (≥ 4 years) |
| Remote monitoring and predictive-maintenance integration | +0.4% | Developed markets first, emerging markets adoption | Medium term (2-4 years) |
| Source: Mordor Intelligence | |||
Rising Demand from Mining Sector in Emerging Economies
Brazil plans USD 64 billion of mining investment for 2024-2028, including USD 15.38 billion for strategic minerals such as lithium and nickel.[1] Indonesia’s alumina output reached 8.5 million t in 2025 on the back of domestic-processing mandates that favor localized crushing capacity. India operates more than 80 aluminum mines and is approaching a USD 1 trillion construction spend, together necessitating consistent secondary crushing throughput. These developments underpin sustained uptake of cone crushers that can maintain precise product sizing, minimize downtime, and integrate with downstream beneficiation. The cone crusher market therefore benefits directly from policy-driven beneficiation initiatives, as refined ores require tight feed gradations that only modern hydraulic units reliably deliver.
Growth of Global Infrastructure and Construction Activities
Seven nations, China, the United States, India, Indonesia, Russia, Canada, and Mexico, are projected to generate 72% of global construction growth through 2025.[2] China and India alone need 270 million new homes by 2025, while Asia’s urbanization rate will exceed 55% by 2030, elevating aggregate demand. Beyond housing, Brazil earmarked USD 10.36 billion to modernize railways, ports, and roads, reinforcing bulk-material requirements. Kenya’s quarry sector processed 45 million t of aggregates in 2023, of which 60% came from mobile crushers. The surge in large-scale, multi-site projects favors mobile cone crushers that can relocate quickly and conform to project-specific specifications, propelling the cone crusher market.
Rapid Adoption of Automated and Digitalized Cone Crushers
IoT-enabled cone crushers are delivering 30-35% output gains and 15-20% lower environmental footprints. Sandvik’s CH800i series provides continuous liner-wear measurement and auto-compensation through the My Sandvik portal, coupled with shafts 65% stronger than previous model. Metso’s cloud analytics predict component failures based on real-time wear profiles, reducing unplanned downtime. Variable Frequency Drives match motor speed to ore hardness, trimming energy use up to 25%. Digital twins, currently in early deployment, simulate crushing circuits in real time and promise double-digit efficiency gains once mainstream. These advances keep the cone crusher market on an accelerating automation trajectory.
Increasing Shift Toward Mobile Crushing Solutions
Avoiding each 100 miles of ore haul can save USD 18,000, and mobile units typically slash transport distances by 60%. Mobile plants require 20-30% lower upfront outlay versus permanent installations and can be rented to cut capital exposure by up to 80% on short contracts. Hybrid drive trains reduce diesel use 30%; idle-shutdown logic alone saves 200-300 L daily. An electric three-stage mobile train draws roughly 302 kW base demand with peaks at 542 kW, delivering a 4-6-year payback where grid tariffs are favorable. The cone crusher market gains traction as project owners view mobility as both a cost and schedule hedge.
Restraints Impact Analysis of Cone Crusher Market*
| Restraint | (~) % Impact on CAGR Forecast | Geographic Relevance | Impact Timeline |
|---|---|---|---|
| Stringent emission and noise regulations | -0.8% | EU and North America primarily, expanding globally | Short term (≤ 2 years) |
| High capital and maintenance costs | -0.6% | Global, particularly impacting smaller operators | Medium term (2-4 years) |
| Manganese-steel supply-chain volatility | -0.4% | Global, with highest impact in Asia-Pacific manufacturing hubs | Medium term (2-4 years) |
| Competition from energy-efficient alternative comminution | -0.3% | North America and EU leading adoption, APAC following | Long term (≥ 4 years) |
| Source: Mordor Intelligence | |||
Stringent Emission and Noise Regulations
EPA NSPS Subpart OOO tightens particulate limits to 0.032 g/dscm for plants built after April 2008 and reduces allowable fugitive opacity to 12%.[3] Compliance often requires baghouses that add 16-19% to a plant’s energy draw. Texas mandates 200-ft setbacks for temporary crushers and caps throughput between 125-250 t/h depending on classification. Initial performance tests using EPA Methods 5, 17, and 9 must be completed within 180 days of start-up and repeated every five years, imposing administrative and financial burdens that moderate the cone crusher market’s near-term expansion.
High Capital and Maintenance Costs
Tracked mobile cone crushers range from USD 500,000 to USD 2 million, reflecting advanced hydraulics, telematics, and dust-control packages. Wear parts fashioned from high-manganese steels face price volatility, and frequent liner changes drive operating costs. Innovations such as Metso’s MX composite liners claim to double lifespan yet command premium prices. Smaller contractors often lack the capital and technical staff for condition-monitoring systems, limiting adoption rates and tempering overall cone crusher market growth.
*Our forecasts treat driver/restraint impacts as directional, not additive. The impact forecasts reflect baseline growth, mix effects, and variable interactions.
Cone Crusher Market Segment Analysis
By Type:
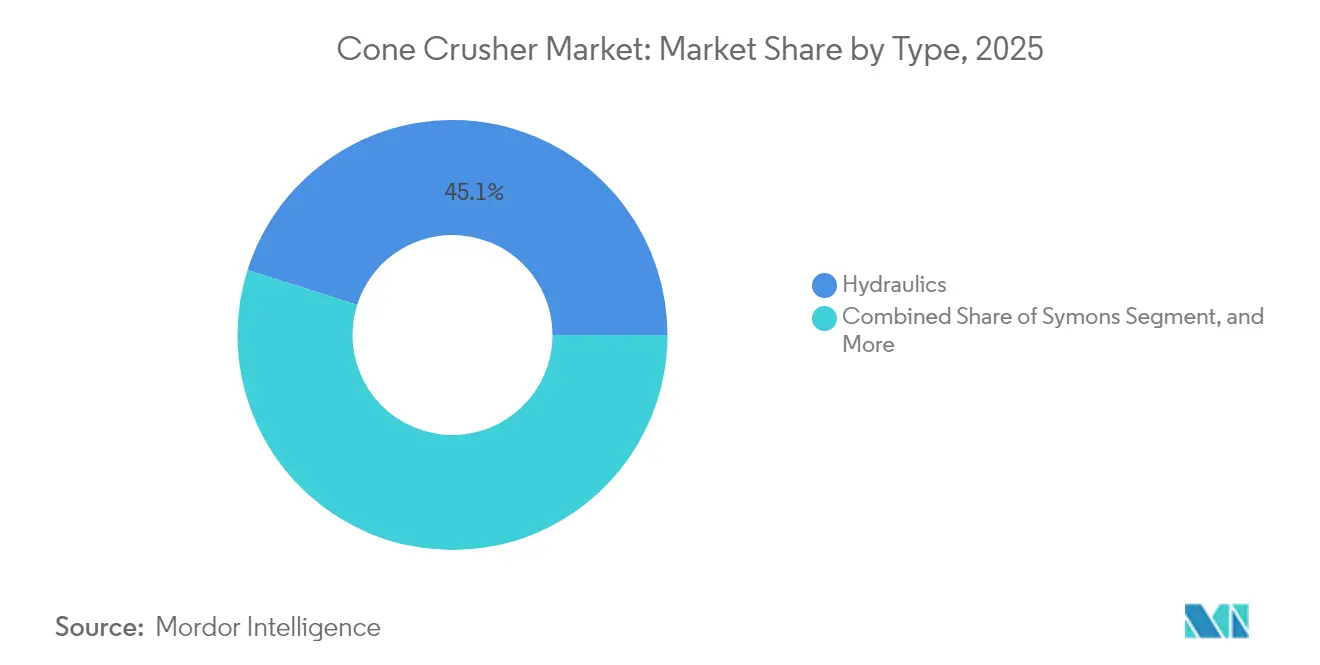
Hydraulic Systems Enable Superior ControlHydraulic models captured 45.12% of 2025 revenue and are projected to post a 6.51% CAGR, outperforming all other categories. The hydraulic platform’s automatic setting regulation and cavity-clearing cut downtime during tramp events, preserving product consistency. Traditional Symons-style spring machines retain niche demand in cost-sensitive operations but lack advanced control logic. Continuous-duty gyratory crushers serve ultra-high-throughput primary positions, while nascent vibration-driven concepts remain experimental. The cone crusher market benefits from OEM investments such as Metso’s next-generation Nordberg HPe, which embeds reinforced hydraulics and digital sensors for mining and aggregates duty.
The rising use of remote-operation centers in large mines amplifies hydraulic adoption. Operators can tweak CSS settings in seconds, improving circuit stability and grinding-mill throughput. These capabilities reinforce the competitive advantage of hydraulic designs and enlarge their share of cone crusher market size forecasts through 2031.

By Offering:
Mobile Solutions Transform OperationsMobile crushers represented 58.05% of global sales in 2025 and are tracking a 6.74% CAGR. Contractors favor the ability to fold up, relocate, and recommission plants in under 48 hours, sidestepping haul-road costs and environmental permitting tied to fixed sites. Wheeled portable units fill intermediate needs, offering lower capital costs but requiring external generators or line power. Permanent installations still dominate extremely high-volume quarries where economies of scale prevail, yet even these deployments adopt modular skids to shorten civil works.
Electrification sweetens the mobile value proposition. Kleemann’s MOBICONE MCO 110 PRO integrates on-board power storage so the entire train can run via a single cable feed, cutting onsite emissions to zero when the grid is green. Such innovations sustain the mobile segment’s leadership within the cone crusher market.
By Power Source:
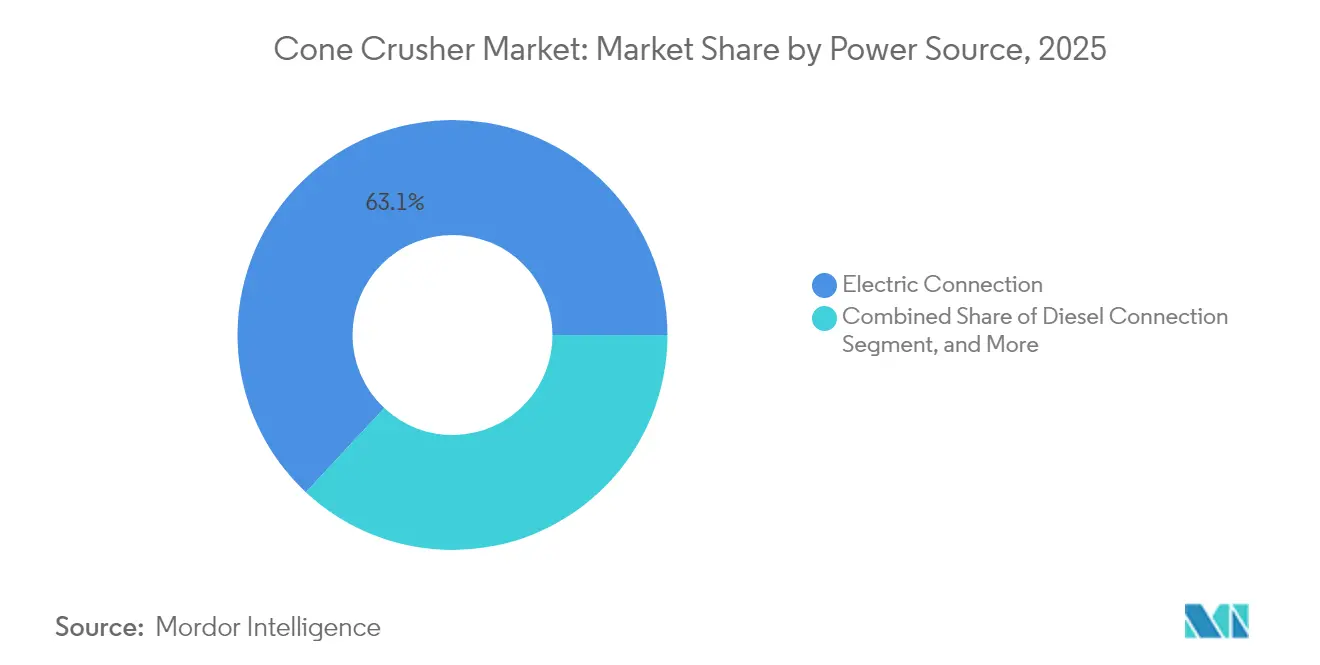
Electrification Accelerates AdoptionElectric-connected plants accounted for 63.05% of 2025 shipments and will post a 6.97% CAGR, the steepest among all power configurations. Grid-powered installations feature lower energy costs, near-silent operation, and simplified maintenance compared with diesel engines. Diesel-hydraulic systems remain indispensable for remote or off-grid projects, but hybrid inverters now enable quick switching should utility supply be unreliable. Dual-connection architectures, combining electric drives with onboard diesel gensets, record the highest growth inside the power segment, reflecting user demand for flexibility during brownfield upgrades.
Falling battery prices and renewable penetration support pilots where mobile crushing spreads run on solar arrays feeding central battery banks. Supply Post documents case studies in which payback periods for fully electric trains shortened to four years under favorable tariff structures. Such economics fortify the role of electrification in driving cone crusher market share gains over diesel alternatives.
By End-user Application:
Mining Drives DemandMining and metallurgy commanded 57.20% of value in 2025 on the back of expansionary budgets for copper, nickel, and lithium. Secondary and tertiary crushers ensure uniform mill feed that elevates recovery rates. Construction accounts for consistent volume, tethered to road-building and housing projects. The recycling and demolition niche, while only a modest fraction today, is forecast at a 6.62% CAGR, the highest of any application. Mobile cone plants stationed at demolition sites reclaim concrete and asphalt into sub-base within hours, aligning with urban sustainability frameworks.
Industrial users, ranging from chemical intermediates to environmental remediation, require tightly graded feedstocks for process stability. Although smaller in value, these specialized niches often specify premium crushers equipped with abrasion-resistant components, lifting the average selling price across the cone crusher market.
Geography Analysis
North America Cone Crusher Market
North America held 38.60% of global turnover in 2025, anchored by mature mining sectors in Arizona, Ontario, and Chihuahua and by rigorous EPA particulate limits that steer buyers toward enclosed, automated plants. U.S. infrastructure renewal, from bridge replacements to battery-factory build-outs, provides a steady base for aggregates output, underpinning cone crusher market demand. Canadian hard-rock mines favor rugged hydraulic machines capable of remote winter operation, whereas Mexico’s construction corridor stretches from Monterrey to the Gulf, absorbing mobile fleets that bypass border logistics.
APAC, EMEA and South America Cone Crusher Market
Asia-Pacific logs the swiftest growth at 6.55% CAGR through 2031 as China, India, and Indonesia collectively channel multi-trillion-dollar funding into housing, transport, and energy. Indonesia’s construction outlay alone is rising 7.5% annually, driven by the new Nusantara capital and trans-island highways. Policy mandates pushing ore beneficiation within national borders create outsized demand for crush-grind circuits. Europe presents a stable, regulation-driven arena where circular-economy statutes compel C&D recycling. Urban job sites in Germany and the Netherlands impose 70 dB noise caps, favoring electric or hybrid crushers. The Middle East and Africa record moderate, project-linked uptake tied to copper, gold, and infrastructure corridors, though political risk can stall tenders. South America receives impetus from Brazil’s USD 64 billion mining roadmap, with ancillary momentum in Chilean lithium and Peruvian copper.

Regulatory Landscape
Cone crusher deployments are shaped by workplace safety requirements for machinery, site operating permits for quarries and mines, and environmental limits for dust and noise. In the United States, EPA NSPS 40 CFR Part 60 Subpart OOO remains an operational anchor for crushing and screening plants, tightening particulate and opacity limits and requiring initial and periodic performance testing, which pushes owners toward enclosed, dust-suppressed, and increasingly monitored plants.
For market access in Europe, the EU Machinery Regulation (EU) 2023/1230 updates health and safety requirements for machinery, replacing the earlier Machinery Directive framework. Quarry and mineral-processing equipment commonly aligns to standards such as EN 1009-3 for crushing and milling machinery safety. Trade policy also affects equipment pricing and sourcing for mobile cone crushers: in June 2026, U.S. Proclamation 11032 adjusted Section 232 tariff treatment for certain mobile industrial equipment and introduced a tariff pathway tied to high U.S. steel or aluminum content by weight, influencing procurement and localization decisions for OEMs and fleet owners through the end-2027 window.
Value Chain Analysis
The cone crusher value chain starts with upstream inputs such as castings and forgings (frames, heads, and shafts), high-manganese steels and composite alloys for wear parts (mantles and concaves), hydraulic components, motors and VFDs, and sensors plus control hardware. OEMs and specialist foundries convert these into finished crushers and modules, then integrate them into mobile, portable, or stationary plants with feeders, screens, conveyors, dust suppression, and power systems. Manufacturing stage differentiation is increasing as OEMs bundle proprietary automation and diagnostics into core builds, as seen in Superior Industries Vantage Automation, Sandvik ACS-c 5/ASRi and Optik, and Metso IC70C and MCP.
Downstream, distribution and commissioning are handled through direct OEM sales for large mining accounts and through dealer networks for aggregates and rental fleets, with remote monitoring portals and condition-based service contracts taking on a larger role. Aftermarket parts and service represent a key profit pool, covering wear parts, hydraulic power units, rebuilds, field service, and software updates that keep connected fleets current. Recent product actions such as Sandvik's electric tracked QH443E and Metso's Nordberg HPe series position electrification, modular serviceability, and connected controls as end-to-end differentiators rather than add-on options.
Competitive Landscape
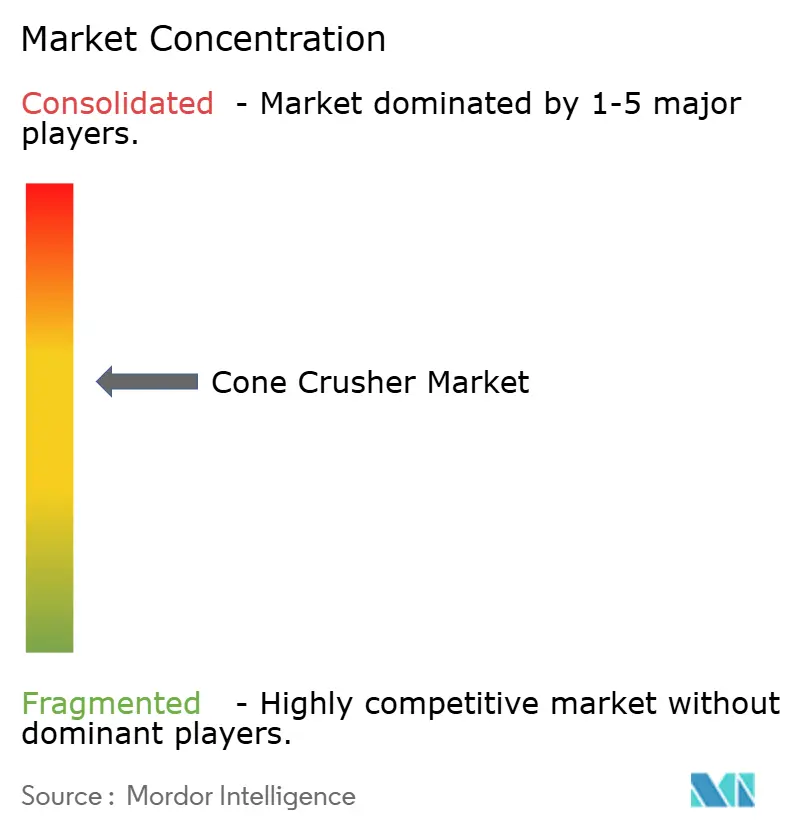
Metso, Sandvik, and Terex collectively control 30-35% of global revenue, underscoring a moderately concentrated structure. Product roadmaps orbit around automation ecosystems, Metso’s Metrics, Sandvik’s Smart Cone, and Terex’s OMNIX, to lock customers into proprietary analytics. Wear-part innovation also serves as a moat; titanium-carbide infused mantles from Unicast can triple service life in high-abrasion ores.
Scale economics permit these leaders to absorb R&D and regulator-compliance costs, while mid-tier entrants target regional customers with cost-optimized packages. Electrification stands out as white space: only 15-20% of installed mobile fleets feature grid-connect capability, granting innovators headroom. Compliance with EPA Subpart OOO and analogous EU rules forces OEMs to integrate dampeners, baghouses, and inline monitoring, raising barriers for new entrants and sustaining current market structure.
Strategic activity through 2025 centers on acquisition and alliance. Metso’s purchase of Diamond Z and Screen Machine augments its North American mobile portfolio. FLSmidth’s supply pact with Wirtgen Group opens cross-selling pathways into construction recycling. Sandvik extended distribution with Retec to ensure aftermarket continuity in the U.K. and Ireland. These moves consolidate service footprints and reinforce brand presence, steering customer choices within the cone crusher market.
Cone Crusher Industry Leaders
-
Terex Corporation
-
Metso Corporation
-
Thyssenkrupp AG
-
Sandvik AB
-
McCloskey International Ltd.
- *Disclaimer: Major Players sorted in no particular order
Cone Crusher Market Companies Covered in this Report
- Metso Corporation
- Sandvik AB
- Terex Corporation
- Astec Industries Inc.
- Thyssenkrupp AG
- FLSmidth and Co. A/S
- McCloskey International Ltd.
- WESTPRO Machinery Inc.
- Puzzolana Machinery Fabricators LLP
- Keestrack NV
- Tesab Engineering Ltd.
- The Weir Group PLC
- Wirtgen Group (GmbH)
- KPI-JCI and Astec Mobile Screens Inc.
- Sepro Mineral Systems Corp.
- Minyu Machinery Corp.
- Zhejiang MP Mining Equipment Co., Ltd.
- Nanchang Mineral Systems Co., Ltd.
- Superior Industries Inc.
- Shanghai Zenith Mineral Co., Ltd.
- Propel Industries Pvt Ltd.
- Tesab Engineering Ltd.
Market Opportunities and Future Outlook
Electrification and connected automation create clear whitespace in mobile and retrofit segments, particularly where compliance pressure on dust, noise, and idling intersects with higher adoption of digital maintenance practices. Electric-connected systems accounted for 63.05% of 2025 sales, and OEM activity during 2026 points to continued product and reference-site momentum. Sandvik introduced new CH442 and CH662 cone crushers with ACS-c 5 ASRi automation and connectivity to its digital services, and a grid-capable electric tracked QH443E has been commissioned in quarry operations through distributor channels. Together, these developments support opportunities in low-emission mobile trains, cable-fed site layouts, and upgrades that extend CSS control, wear tracking, and fleet monitoring across mixed-age crusher populations.
Mining-driven circuit upgrades and brownfield modernization also open opportunities for higher-force, higher-capacity cone crushers, along with bundled wear-part technology supported by performance guarantees. In July 2026, Metso booked a EUR 20 million order from Grupo Mexico for additional Nordberg MP800 cone crushers at the La Caridad copper concentrator, underscoring ongoing capital allocation where secondary and tertiary crushing performance is tied to concentrator throughput and reliability. At the same time, demand is building for simplified maintenance architectures and modular power units, as operators look for shorter changeouts and safer service routines alongside productivity gains. This supports OEMs that package hardware, digital controls, and aftermarket coverage into a single operating model.
Recent Industry Developments in Cone Crusher Market
- July 2026: Metso strengthened a partnership with a major mining customer in South America through new technology development focused on crusher wear parts. The move emphasizes performance-led aftermarket innovation aimed at improving uptime and cost-per-ton outcomes in high-abrasion duties. It also reinforces long-cycle customer lock-in around OEM parts and services.
- March 2026: Sandvik launched the CH442 and CH662 cone crushers at CONEXPO 2026, featuring ACS-c 5 ASRi automation for setting regulation and monitoring. This launch expands Sandvik's installed base for connected cone crushing and supports fleet-level optimization programs that combine hardware upgrades with digital services.
- October 2024: Metso expanded its MX wear-parts range to large cone crusher models, targeting extended liner life in demanding applications. Broadening availability of premium wear solutions supports total-cost-of-ownership selling and gives operators another route to productivity gains without full plant replacement.
Cone Crusher Market Report Scope and Research Methodology
Market Definition and Coverage
For this methodology, the cone crusher market covers revenue generated from cone crusher equipment sold for crushing and size reduction across mining, aggregates, and related heavy material-handling uses, including mobile, portable, and stationary configurations.
Scope exclusions: Excludes aftermarket wear parts, routine maintenance services, and standalone screening or conveying equipment that can be purchased without a cone crusher.
Segments Covered in This Report
- By Type
- Symons
- Hydraulics
- Gyratory
- Other Types
- By Offering
- Mobile Crushers
- Portable Crushers
- Stationary Crushers
- By Power Source
- Electric Connection
- Diesel Connection
- Dual Connection
- By End-user Application
- Mining and Metallurgy
- Construction
- Aggregate Processing
- Demolition
- Other End-user Applications
- By Geography
- North America
- United States
- Canada
- Mexico
- South America
- Brazil
- Argentina
- Chile
- Rest of South America
- Europe
- Germany
- United Kingdom
- France
- Italy
- Netherlands
- Rest of Europe
- Asia-Pacific
- China
- India
- Japan
- South Korea
- Rest of Asia-Pacific
- Middle East and Africa
- Middle East
- Saudi Arabia
- United Arab Emirates
- Turkey
- Rest of Middle East
- Africa
- South Africa
- Nigeria
- Rest of Africa
- Middle East
- North America
Data Sources, Market Sizing, and Validation
Desk Research
Desk research began by mapping where cone crushers are typically purchased and used, then linking that demand to mining output and construction activity. Public sources such as USGS mineral commodity statistics, World Bank and IMF macro series, UN Comtrade trade data, and IEA energy indicators were used to anchor the demand backdrop and the timing of investment cycles.
To keep inputs realistic, we also reviewed national geological agencies, and infrastructure and transport ministry pipeline information where available. Peer-reviewed mining and mineral processing journals were used to confirm operating context and typical crushing stage practices. Company annual reports, investor presentations, and reputable trade press helped cross-check product mix shifts, pricing direction, and order visibility in major regions. In a few places, paid subscriptions for company financials, patent tracking, and shipment-level import-export analytics were used to reduce gaps where disclosures were limited. The sources listed above are illustrative, and other references were also used to collect, validate, and clarify data.
Primary Interviews and Surveys
Primary interviews and surveys were used to test sizing assumptions that desk sources cannot fully confirm, especially around mobile versus stationary demand, typical replacement cycles, and how buyers select power sources. We spoke with manufacturers, distributors, quarry operators, mining site teams, and contractor-side stakeholders across APAC, EMEA, and the Americas, so pricing bands, utilization patterns, and mix splits could be checked against on-the-ground inputs.
We then used the feedback to refine model variables and re-check outliers where regional totals did not match procurement activity and equipment availability.
Distribution of primary research fieldwork respondents
| Company type | Respondent position | Region |
|---|---|---|
| Top tier: 26% | CXOs: 15% | APAC: 40% |
| Mid tier: 55% | Functional/Unit leaders: 37% | EMEA: 37% |
| Smaller Players: 19% | Managers: 48% | Americas: 23% |
Market-Sizing & Forecasting
Sizing started with a top-down build where mining output signals, quarrying and aggregates activity, and infrastructure spending cycles were translated into an addressable demand pool for crushing stages where cone crushers are commonly used. That demand pool was then adjusted with practical filters, including mobile versus stationary mix, typical replacement and upgrade timing, and the share of projects moving from planning into procurement.
After the total was formed, selective bottom-up approximations were used as checks, including sampled ASP-by-capacity ranges multiplied by unit movement proxies, followed by channel checks on annual sales direction in key consuming regions. Key inputs used in the model included metal and mineral production trends, construction and infrastructure capex direction, quarry output indicators, diesel versus electric preference shifts, and average selling price movement by configuration and capacity class. Where local unit visibility was incomplete, gaps were handled through regional share mapping tied to trade flows and activity indicators, then corrected using feedback from dealers and site operators.
For forecasting, scenario analysis was used because demand can swing with commodity cycles and the timing of large projects. Scenarios were anchored to expert views on capex pipelines and price progression, and then compared back to macro indicators so the year-by-year path stayed consistent.
Data Validation & Update Cycle
Model outputs were checked against independent signals, including construction equipment momentum, mining capex direction, and trade-based movement of related heavy equipment categories. Results were then reviewed across regions to spot unusual jumps. When variance appeared, assumptions behind mix, ASP, and demand conversion were revisited, followed by a second review before sign-off.
Reports are refreshed annually, and interim updates are made when material events occur, such as sharp commodity price moves, large project delays, or policy shifts affecting mining and infrastructure activity. Before delivery, an analyst performs a fresh pass on recent public data releases and market developments so clients receive the latest updated view.
Mordor Intelligence's Cone Crusher Market Sizing Compared With Other Published Estimates
Published market sizes for cone crushers can differ even when the topic name looks similar, because each publisher may count different revenue components, use different year cutoffs, and apply different price progression assumptions. The spread becomes easier to explain once you line up what is treated as equipment revenue, how mobile and stationary units are counted, and whether the forecast path is conservative or aggressive.
Aftermarket wear parts and service contracts sit outside Mordor Intelligence's scope for this market, which is a common driver of higher totals in estimates that bundle lifetime consumables and service revenue into the same number.
Benchmark comparison
| Source | Market Size | Gaps in Research Methodology |
|---|---|---|
| Mordor Intelligence | USD 2.05 B (2026) | |
| Industry Publisher A | USD 1.84 B (2024) | Uses an earlier base year and appears to apply a narrower demand capture in faster-growing regions, which can understate equipment revenue after recent project and capex recovery. |
| Industry Publisher B | USD 3.09 B (2024) | Likely applies broader value coverage and a steeper price curve, which can raise the total when equipment sales are not separated cleanly from adjacent revenue streams. |
Overall, the differences mainly come from what is included as revenue, the year used for the starting point, and how pricing is assumed to change for mobile and higher-capacity units. By keeping the count tied to observable equipment sales and stress-checking mix and ASP inputs with field feedback, the final number stays traceable to clear drivers and repeatable review steps.
Key Questions Answered in the Report
What is the current value of the global cone crusher market?
The global cone crusher market is valued at USD 2.05 billion in 2026, with a forecast to reach USD 2.62 billion by 2031.
Which segment leads by type?
Hydraulic cone crushers lead, holding 45.12% of revenue in 2025 and poised for a 6.51% CAGR through 2031.
How fast is Asia-Pacific growing?
Asia-Pacific is the fastest-growing region, projected at a 6.55% CAGR on the back of large infrastructure and mining investments.
Why are mobile cone crushers gaining popularity?
Mobile units cut haulage costs by up to USD 18,000 per 100 miles avoided, lower upfront spending by 20-30%, and enable quick site moves.
How do emission regulations impact equipment choices?
EPA and EU particulate limits compel buyers to adopt enclosed, dust-suppressed, often electrically driven crushers to comply with stricter thresholds.