
Smoke Detector Market Size and Share
Market Overview
| Study Period | 2020 - 2031 |
|---|---|
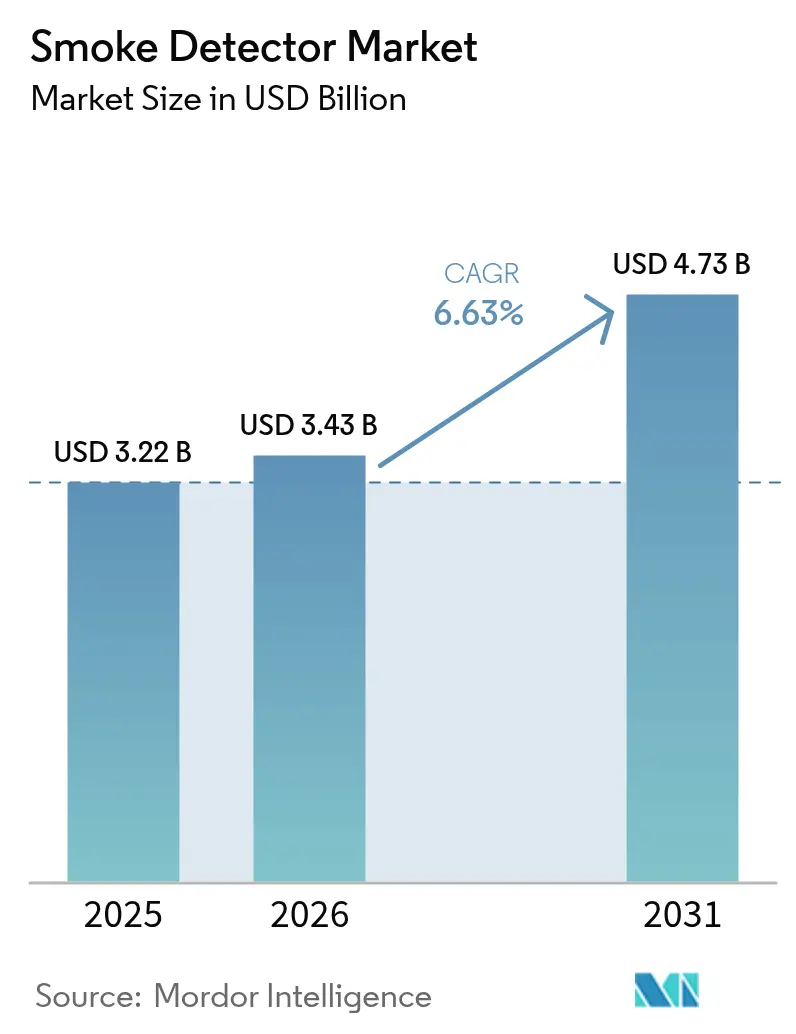
| Market Size (2026) | USD 3.43 Billion |
| Market Size (2031) | USD 4.73 Billion |
| Growth Rate (2026 - 2031) | 6.63 % |
| Fastest Growing Market | Asia-Pacific |
| Largest Market | North America |
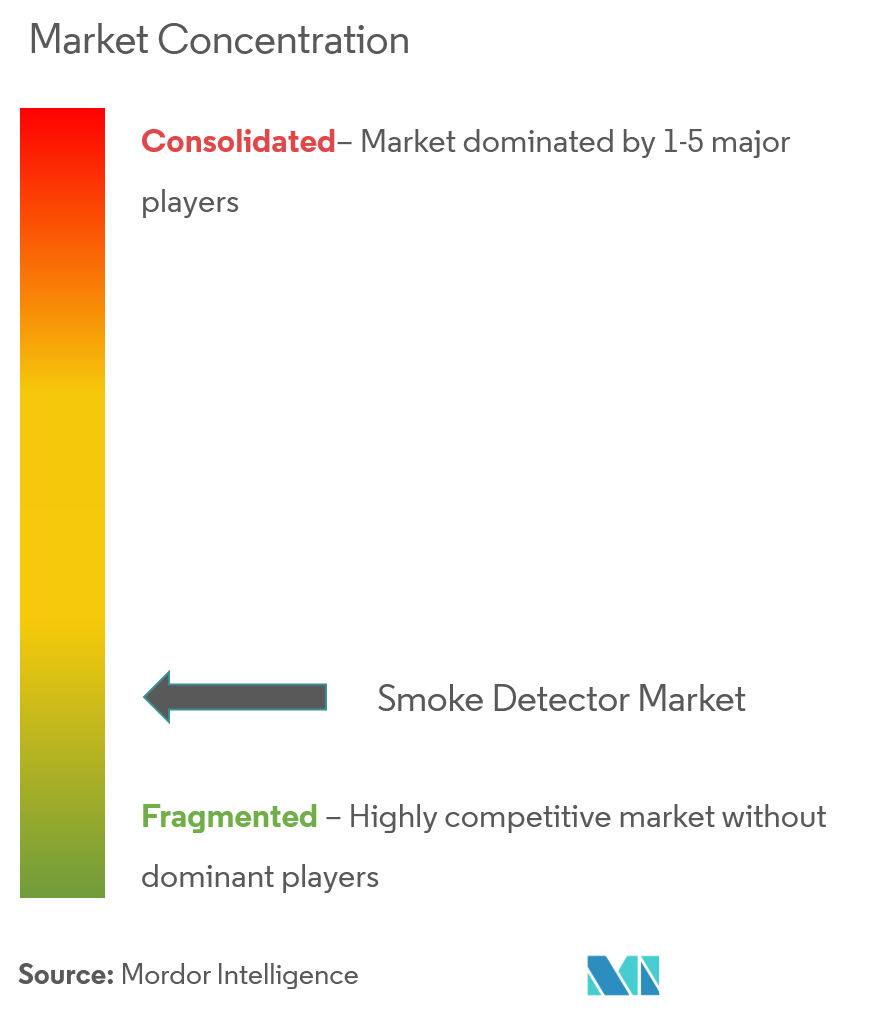
| Market Concentration | Medium |
Major Players *Disclaimer: Major Players sorted in no particular order Image © Mordor Intelligence. Reuse requires attribution under CC BY 4.0. | |
Smoke Detector Market Analysis by Mordor Intelligence
The smoke detector market size is expected to grow from USD 3.22 billion in 2025 to USD 3.43 billion in 2026 and is forecast to reach USD 4.73 billion by 2031 at 6.63% CAGR over 2026-2031. Growth is propelled by stricter fire-safety codes, ongoing urban construction, and a rapid swing toward smart, insured-incentivized devices that cut false alarms and lower premiums. Construction rules in North America, the EN 54 framework in Europe, and China’s GB 55037-2022 retrofit mandate continue to widen the installed base of interconnected alarms, while dual-sensor and aspirating technologies address the false-alarm problem in complex sites. Photoelectric products keep their lead in low-smolder risk dwellings, yet multi-sensor systems are winning big in offices, malls, and warehouses that now face both code and insurer scrutiny. Manufacturers concentrate on sealed lithium batteries and addressable IoT modules to reduce maintenance and deliver real-time data to building management platforms. The competitive field stays moderately fragmented as global leaders acquire niche innovators, while new entrants push low-cost, app-ready designs for emerging markets.
Key Report Takeaways
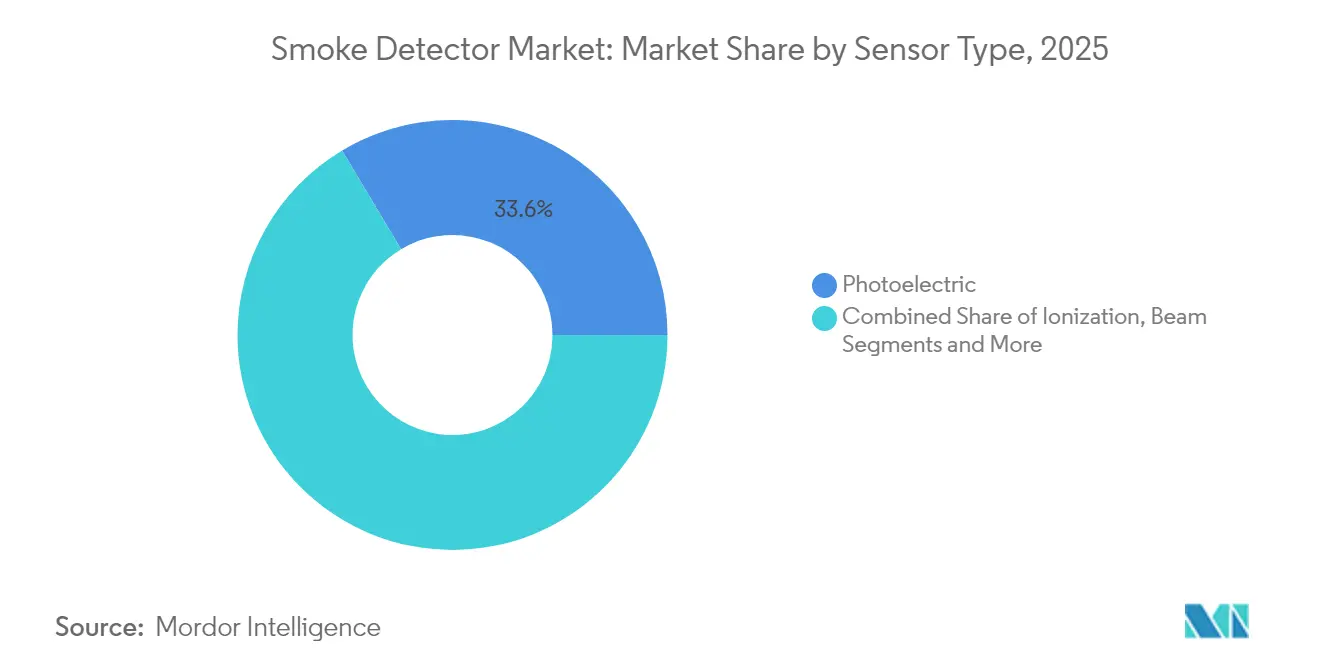
- By sensor type, photoelectric sensors led with 33.58% revenue share in 2025; dual-sensor technology is projected to expand at a 8.98% CAGR through 2031.
- By power source, battery-powered units held 43.21% of the smoke detector market share in 2025, while hard-wired systems with battery backup are forecast to grow at an 8.36% CAGR between 2026 and 2031.
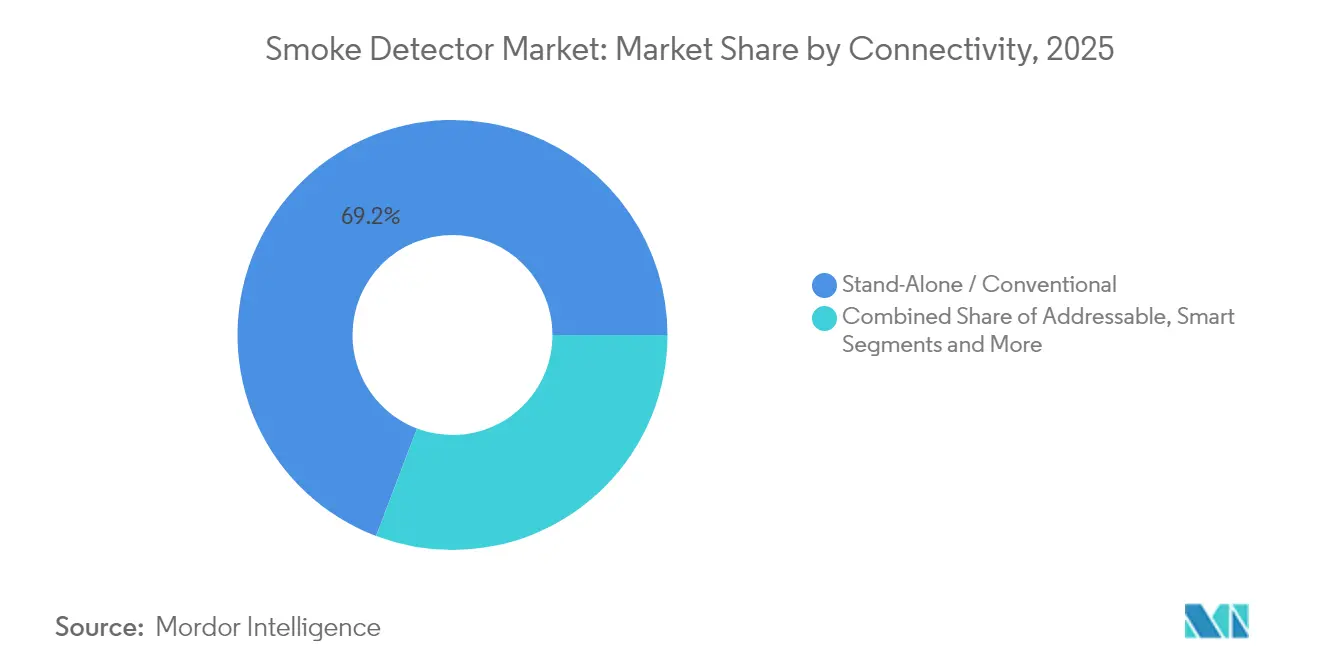
- By connectivity, stand-alone detectors commanded 69.22% share of the smoke detector market size in 2025 yet smart IoT-enabled models are set to advance at a 9.61% CAGR through 2031.
- By end-user, residential applications accounted for 43.18% share of the smoke detector market size in 2025; transportation and logistics warehouses are expected to grow at a 9.22% CAGR to 2031.
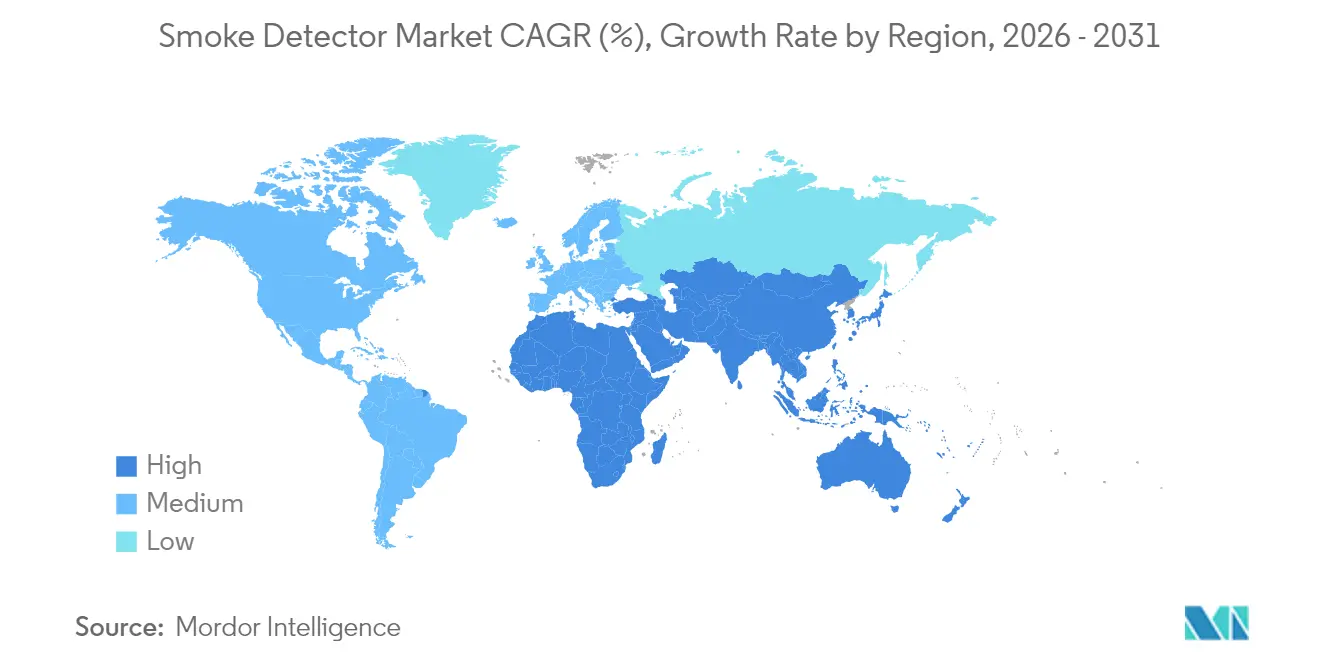
- By geography, North America dominated with 39.62% revenue share in 2025; Asia Pacific is projected to record the highest 7.98% CAGR from 2026 to 2031.
Note: Market size and forecast figures in this report are generated using Mordor Intelligence’s proprietary estimation framework, updated with the latest available data and insights as of 2026.
Market Trends and Insights
Drivers Impact Analysis of Smoke Detector Market*
| DRIVER | (~) % IMPACT ON CAGR FORECAST | GEOGRAPHIC RELEVANCE | IMPACT TIMELINE |
|---|---|---|---|
| Mandatory Interconnection of Residential Smoke Alarms in US & Canada | 1.8% | North America | Medium term (2-4 years) |
| EN 54-29 Multi-Sensor Requirement Accelerating Commercial Retrofits in Europe | 1.2% | Europe | Medium term (2-4 years) |
| China's 2024 GB50116 Code Upgrade for High-Rise Buildings | 1.5% | China, spill-over to APAC | Short term (≤ 2 years) |
| 10-Year Sealed Lithium-Battery Retrofits Reducing Maintenance Costs in Europe | 0.9% | Europe, North America | Long term (≥ 4 years) |
| Insurance Premium Discounts for IoT-Connected Detectors | 1.1% | Global, led by North America & Europe | Medium term (2-4 years) |
| E-Commerce Warehousing Boom Driving Aspirating Detectors | 0.8% | Global, concentrated in developed markets | Short term (≤ 2 years) |
| Source: Mordor Intelligence | |||
Mandatory Interconnection of Residential Smoke Alarms in US & Canada
The 24 CFR § 3280.209 update obliges every new or replacement alarm in US manufactured housing to be hard-wired and interconnected, triggering all units when one senses smoke. The International Code Council’s R314 clause mirrors this requirement for site-built dwellings, creating a large retrofit wave as owners replace aging stand-alone devices. Canada follows with similar rules in its National Fire Code, and Ontario’s Fire Code enforces interconnection in both dwelling units and guest suites. As builders comply, shipment volumes of multi-linkable devices increase, and insurers lower premiums, further pushing adoption. Vendors respond with combo wired-wireless mesh solutions that simplify upgrades in existing housing stock.[1]U.S. Government, “24 CFR § 3280.209 – Smoke Alarm Requirements,” law.cornell.edu
EN 54-29 Multi-Sensor Requirement Accelerating Commercial Retrofits in Europe
EN 54-29 aligns smoke, heat, and CO sensing under one certified multi-sensor head, reducing nuisance triggers in busy commercial spaces. Germany and Belgium now demand EN 54-13 system-wide compatibility, compelling hotels, malls, and offices to swap legacy single-technology detectors for type-approved hybrids. Fire services treat validated multi-sensor signals as confirmed fires, trimming costly call-outs and underwriting risk, a perk amplified by some insurers offering premium credits. Systems integrators see higher project margins as they bundle detectors with addressable panels and cloud analytics. Retrofits gather pace in the UK, France, and Nordics where energy-efficient refurbishments are underway.
China's 2024 GB50116 Code Upgrade for High-Rise Buildings
China’s General Fire Protection Code (GB 55037-2022) came into force in June 2023 and supersedes earlier GB 50016 rules, demanding automatic fire alarm networks with smoke detectors in residential blocks above 27 m and commercial towers over 24 m. Municipalities in Beijing, Shanghai, and Shenzhen set shorter grace periods, pushing owners to retrofit millions of units. Requirements for detector integration with building management systems boost addressable and IoT shipments. Domestic producers face volume spikes, while foreign suppliers of dual-sensor heads benefit from stricter performance clauses mirroring EN 54. Installation revenue climbs as integrators connect detectors to emergency lighting and HVAC shutdown circuits.
10-Year Sealed Lithium-Battery Retrofits Reducing Maintenance Costs in Europe
Long-life sealed-cell alarms meet European labor cost pressures by eliminating annual battery swaps and aligning with sustainability targets. Nordic social-housing operators cite multiyear cost savings that offset higher upfront prices. UK landlords see compliance benefits because tenants cannot disable power sources. Cities such as Amsterdam now include sealed-battery clauses in dwelling safety rules, intensifying demand. Suppliers combine the power pack with low-frequency sounders to satisfy newer evacuation-aid codes for the elderly.
Restraints Impact Analysis of Smoke Detector Market*
| RESTRAINTS | (~) % IMPACT ON CAGR FORECAST | GEOGRAPHIC RELEVANCE | IMPACT TIMELINE |
|---|---|---|---|
| Am-241 Isotope Supply Constraints for Ionization Chambers | -0.7% | Global, particularly North America | Long term (≥ 4 years) |
| Installation Skill Gap in ASEAN Code-Compliant Deployment | -0.5% | ASEAN-5 countries | Medium term (2-4 years) |
| False-Alarm Liability Slowing UK Multi-Sensor Adoption | -0.4% | United Kingdom | Short term (≤ 2 years) |
| High Up-Front Cost of LoRaWAN/BLE Smart Detectors in India & Brazil | -0.6% | India, Brazil, emerging markets | Medium term (2-4 years) |
| Source: Mordor Intelligence | |||
Am-241 Isotope Supply Constraints for Ionization Chambers
Los Alamos National Laboratory resumed domestic Am-241 production, yet volumes remain tight and ramp-up is complex. Geopolitical frictions limit Russian exports, the traditional fallback source. Manufacturers hedge by redesigning lines around photoelectric or dual-sensor heads, but cost-sensitive buyers still prefer ionization for fast-flame detection. Spot shortages lift component prices, pressuring margins and widening the price gap to photoelectric models across Latin America and Africa.[2]Los Alamos National Laboratory, “United States of Americium,” lanl.gov
Installation Skill Gap in ASEAN Code-Compliant Deployment
Singapore and Malaysia enforce advanced EN-aligned codes, yet smaller ASEAN markets lack technicians certified to commission addressable or IoT systems. Projects face delays as integrators fly in specialist crews, inflating costs. Multinationals launch training centers in Bangkok and Ho Chi Minh City to build local capacity, but the shortfall is unlikely to close before 2028. Governments consider mandating third-party inspection to raise quality, adding complexity for budget-limited developers.
*Our forecasts treat driver/restraint impacts as directional, not additive. The impact forecasts reflect baseline growth, mix effects, and variable interactions.
Smoke Detector Market Segment Analysis
By Sensor Type:
Dual-Sensor Technology Gains MomentumPhotoelectric models held 33.58% share of the smoke detector market in 2025, favored by codes targeting smoldering-fire risk in homes. Dual-sensor units, blending ionization and photoelectric principles, post the fastest 8.98% CAGR as commercial codes demand broader coverage. Ionization heads still sell into low-income housing but face Am-241 constraints, while beam detectors secure spots in atria and stadiums that require long-range line-of-sight. Aspirating systems occupy the premium tier, with Honeywell’s FAAST FLEX gaining mindshare in dusty industrial zones where false alarms risk downtime.
The regulatory tilt toward multi-sensor adoption is reshaping R&D budgets. A Nature study proves capacitive particle analysis can recognize smoke versus steam at ppm levels, enabling smarter algorithms. EN 54 uniformity allows mixed-vendor sensors to plug into common panels, cutting integrator risk. Video smoke detection, already piloted in oil-gas plants, may disrupt point sensors by identifying smoke in seconds, though high bandwidth limits mainstream use until costs fall.



By Power Source:
Battery Backup Systems Drive ReliabilityBattery-powered devices retained 43.21% share of the smoke detector market in 2025 because retrofits seldom add wiring. Yet hard-wired units with battery backup display the strongest 8.36% CAGR as codes insist alarms keep working during outages. Sealed 10-year lithium packs gain favor in Europe, saving annual maintenance and preventing user tampering. Solar-assisted heads and energy-harvesting micro-generators remain niche, restricted to remote mining or telecom shelters.
Total cost of ownership guides buyer choice more than sticker price. Denver Fire Department promotes lithium-battery alarms to reduce callouts for chirping low-battery alerts. OEM dashboards now flag battery health, letting property managers replace units proactively. Research projects explore energy-scavenging from building HVAC vibration, but commercial readiness is at least five years out.
By Connectivity:
Smart IoT Integration AcceleratesStand-alone units still dominate with 69.22% share in 2025, but smart IoT-linked devices log a 9.61% CAGR, buoyed by insurer discounts and app-based management. Addressable systems fill the gap for schools or offices that need centralized annunciation without full cloud services. LoRaWAN pilots prove deep building penetration for linked alarms at modest bandwidth, yet module cost slows uptake outside Fortune 500 campuses.
Interoperability with building-management platforms is now decisive. Sydney projects combine emergency lighting nodes with smoke sensing, sharing one wireless backbone for both functions. Vendors open APIs so facility software can silence false alerts remotely after visual confirmation. Cyber-security firewalls and data-privacy clauses become mandatory in tender documents, shaping product roadmaps.
By End-User:
Warehousing Drives Commercial GrowthResidential dwellings kept a 43.18% revenue slice of the smoke detector market in 2025, underpinned by North American interconnection mandates. Transportation and logistics warehouses, however, post the top 9.22% CAGR as e-commerce drives higher stock density and automated retrieval heightens ignition risk. Offices, hospitals, and hotels refresh systems to meet EN 54 compatibility checks and to leverage smart analytics for evacuation management.
Warehouse operators deploy aspirating pipelines that sample air at rafter height, providing up-to-60-minute early warning before smoke hits floor-level heads. Data centers, another hot industrial segment, favor clean-agent suppression triggered by very early warning detectors to protect uptime. Oil and gas facilities continue specifying UV/IR flame detectors as a complement where hydrocarbon fires escalate rapidly.
Geography Analysis
North America Smoke Detector Market
North America contributed 39.62% of 2025 revenue for the smoke detector market, energized by tight building codes and widespread insurer incentives. US manufactured housing rules require hard-wired interconnected alarms, while Canada’s Fire Code mirrors those clauses. State Farm’s distribution of 2 million Ting sensors exemplifies the insurer-driven smart pivot, and Liberty Mutual offers tiered premiums for Google-branded detectors. Mexico’s industrial corridors adopt aspirating systems to safeguard export warehouses serving near-shoring brands.
APAC Smoke Detector Market
Asia Pacific records the fastest 7.98% CAGR for 2026-2031. China’s GB 55037-2022 dictates detector networks in all high-rise residences and pushes IoT integration with property-management dashboards, lifting the smoke detector market size for the region dramatically through 2030. Japan adopts multi-sensor products to solve dense urban building challenges, while India’s smart-city projects politely skip LoRaWAN owing to budget but favor addressable lines in metro stations. ASEAN nations struggle with installer shortages, delaying some projects despite rising awareness.
Europe Smoke Detector Market
Europe maintains mid-single-digit growth as EN 54 harmonization underpins retrofits. Germany and Belgium enforce EN 54-13 compatibility proof, boosting demand for full-system upgrades. The UK’s false-alarm charging adds an extra hurdle yet simultaneously pressures owners to invest in better technology once bedding-in risks pass. Nordic countries champion sealed lithium designs to cut maintenance. Southern Europe leans on hospitality builds, where tourism rebounds and owners replace 1990s-era ionization heads with dual-sensor units to meet new insurance clauses.

Regulatory Landscape
Smoke detector requirements are anchored in building and installation codes, while product compliance is governed by standards and third-party certification regimes. In the United States, the International Code Council (ICC) 2024 International Building Code includes life-safety provisions for residential occupancies, and manufactured housing requirements under 24 CFR 3280.209 reinforce interconnected alarm adoption. Canada follows similar installation expectations through fire code enforcement at the provincial and municipal levels, and jurisdictions also add localized mandates, such as Maryland HB 823 taking effect July 1, 2024, referencing NFPA 72-aligned smoke detection in residential high-rise applications.
On the product side, North American listings under UL and ULC remain key for market access: ANSI/UL 217 (and CAN/ULC 531) revisions became effective January 14, 2026, tightening performance and test conditions, including multi-criteria smoke alarms that incorporate gas sensing, along with updated stability and functional field testing provisions. Internationally, alignment of definitions and system requirements across ISO and European frameworks supports cross-region product roadmaps, including the release of ISO 7240-1:2025 and the publication of AS 7240.2:2026 by NSAI (April 2, 2026), which informs control and indicating equipment specifications for larger system deployments.
Value Chain Analysis
The smoke detector value chain spans component suppliers, OEM design and assembly, certification and compliance testing, and multi-channel distribution into residential and commercial projects. Upstream inputs include optical chambers and emitters/receivers for photoelectric sensing, specialty materials and electronics for multi-sensor heads, microcontrollers and radios for smart connectivity, and long-life power packs, including sealed lithium designs. Midstream, OEMs integrate sensing, power management, firmware (including self-test and diagnostics), and mechanical housings, then route products through nationally recognized testing laboratories (NRTLs) and standards compliance pathways, which is increasingly consequential as UL 217 revisions (effective January 14, 2026) and UL 268 updates (February 6, 2026) raise technical and documentation requirements for smoke alarms and system detectors.
Downstream, sales and deployment split between direct and system integrator channels for addressable and aspirating systems, and indirect retail and e-commerce for stand-alone residential units. System integrators, electrical contractors, and facility service providers add value through site design and commissioning to NFPA 72-aligned practices in North America, plus periodic testing and lifecycle maintenance. Distributors and commercial buyers often require UL or equivalent listings as procurement gates. When specialized inputs and compliance lead times tighten, sourcing strategies and product mix shift, reinforcing a move toward photoelectric and multi-sensor architectures where legacy dependencies, such as ionization chamber materials, introduce both supply and regulatory friction.
Competitive Landscape
The field remains moderately fragmented. Honeywell, Siemens, and Johnson Controls maintain global footprints, using scale to negotiate components and roll out firmware updates that keep older panels compatible with new heads. Johnson Controls’ USD 16.5 billion Tyco acquisition combined strengths in suppression and detection, yielding bundled bids on megaprojects. Honeywell promotes the FAAST FLEX aspirating line, while Siemens refines addressable loops with self-test capabilities that slash maintenance.
Mid-tier specialists such as Hochiki and Apollo Fire Detectors differentiate on multi-sensor speed and open-protocol communications. X-Sense and other price-aggressive newcomers chase e-commerce channels, bundling app dashboards and voice assistants to nudge DIY adopters. Google’s exit from in-house detector manufacturing in 2025 and alliance with First Alert shows platform players prefer partnerships over hardware ownership.
Strategic alliances proliferate. Insurers collaborate with OEMs to embed data pipelines that prove alarm uptime, and telecommunication firms bundle detectors with broadband plans in South Korea and Spain. Vendors devote R&D to AI-based analytics that distinguish steam, cigarette smoke, and cooking fumes, aiming to slash the false-alarm problem that still triggers one-third of brigade call-outs in mature economies.
Smoke Detector Industry Leaders
Honeywell International Inc.
Siemens AG
Johnson Controls International PLC
Carrier Global – Kidde
Robert Bosch GmbH
- *Disclaimer: Major Players sorted in no particular order
Smoke Detector Market Companies Covered in this Report
- Honeywell International Inc.
- Siemens AG
- Johnson Controls International plc
- Robert Bosch GmbH
- Hochiki Corporation
- ABB Ltd
- Carrier Global (Kidde)
- Resideo Technologies (First Alert/BRK)
- Google LLC (Nest Labs)
- Schneider Electric SE
- Panasonic Corporation
- Apollo Fire Detectors Ltd (Halma plc)
- X-Sense (Shenzhen Huidu)
- Hekatron Brandschutz
- Fike Corporation
- Nittan Co., Ltd.
- Mircom Group of Companies
- Tyco (Johnson Controls Fire Protection)
- Ei Electronics
- Hochiki America
- Bosch Security Systems

Market Opportunities and Future Outlook
Opportunity is concentrated in technology upgrades that directly address nuisance alarms, maintenance burden, and interoperability across smart homes and building management systems. The January 14, 2026 revision cycle for UL 217 and CAN/ULC 531 introduces clearer pathways for multi-criteria smoke alarms that incorporate gas-sensor elements, along with more rigorous stability and functional testing. This creates room for OEMs to meet the updated test regimes while delivering fewer false alarms in kitchens, bathrooms, and mixed-use buildings. Separately, newer code provisions reflected in 2024-era residential code adoptions, including sealed 10-year battery requirements, reinforce demand for long-life, tamper-resistant designs that reduce service calls for property owners and landlords.
Connected safety and multi-modal detection also expand the addressable market beyond traditional point devices. Sensereo’s MS-1 smoke alarm (March 2026) is an example of platform-level innovation, with native Matter over Thread connectivity built on Nordic Semiconductor technology that supports cross-ecosystem compatibility in smart-home deployments. Visual detection is moving from pilots toward broader deployment as well, with IntelliSee transitioning its camera-based smoke and fire detection capability to general availability in April 2026, supporting wider-area coverage in large spaces where point sensors can be harder to place or maintain. Together, these developments support an integration-layer opportunity for OEMs and integrators to bundle detectors, panels, remote diagnostics, and automated responses, such as HVAC shutdown and smoke control interfaces, into compliance-driven retrofit projects across residential interconnection markets and commercial modernization programs.
Recent Industry Developments in Smoke Detector Market
- June 2026: Honeywell expanded the NOTIFIER INSPIRE platform with integrated smoke control capabilities and a carbon monoxide purge function for removing contaminated air and introducing fresh air in affected zones. The release broadens fire detection deployments into combined life-safety and air-management workflows, increasing pull-through for connected panels, detectors, and integration services.
- March 2026: Siemens launched the Sinteso Nova and Cerberus Nova fire detector portfolio in Switzerland, emphasizing IoT-connected functionality with proactive self-checks and remote diagnostics. The portfolio elevates competitive pressure around automated compliance, predictive maintenance, and reduced on-site testing overhead for commercial and institutional customers.
- October 2024: Whisker Labs shipped its one millionth Ting sensor, scaling a distribution model that ties electrical-fire hazard monitoring to insurer and homeowner programs. The milestone underscores growing demand for connected risk-reduction devices that complement traditional smoke detection and strengthen data-driven underwriting and service bundles.


Smoke Detector Market Report Scope and Research Methodology
Market Definition and Coverage
This market covers the revenue earned from smoke detectors sold for residential, commercial, and industrial buildings, including conventional stand-alone units and smart, connected devices, across all major regions.
Scope exclusions: Fire alarm control panels sold without a smoke-detection component, fire suppression equipment, and standalone gas detectors are excluded from this market sizing.
Segments Covered in This Report
- By Sensor Type
- Photoelectric
- Ionization
- Dual-Sensor (Ionization + Photoelectric)
- Beam
- Aspirating / Air-Sampling
- By Power Source
- Battery-Powered
- Hard-Wired
- Hard-Wired with Battery Backup
- Solar and Energy-Harvesting
- By Connectivity
- Stand-Alone / Conventional
- Addressable
- Smart / IoT-Enabled
- By End-User
- Residential
- Commercial
- Corporate Offices
- Hospitality and Leisure
- Education Facilities
- Healthcare Facilities
- Retail and Malls
- Industrial
- Oil and Gas
- Manufacturing Plants
- Data Centers
- Transportation and Logistics
- Aviation
- Marine
- Rail and Metro
- By Distribution Channel
- Direct / System Integrators
- Indirect
- Offline Retail / Wholesale
- Online (E-commerce)
- By Geography
- North America
- United States
- Canada
- Mexico
- Europe
- United Kingdom
- Germany
- France
- Italy
- Rest of Europe
- Asia-Pacific
- China
- Japan
- India
- South Korea
- Rest of Asia-Pacific
- Middle East
- Israel
- Saudi Arabia
- United Arab Emirates
- Turkey
- Rest of Middle East
- Africa
- South Africa
- Egypt
- Rest of Africa
- South America
- Brazil
- Argentina
- Rest of South America
- North America
Data Sources, Market Sizing, and Validation
Desk Research
We start by mapping how smoke detectors are defined, regulated, and adopted across key building types, since codes and standards drive a big part of demand. Public and official sources help set the guardrails, such as fire safety code publications, national building regulations, customs and trade statistics for relevant safety devices, and housing and construction starts from government statistical offices.
To convert those signals into a usable market model, we also review manufacturer product catalogs, public price lists where available, distributor and installer websites, and investor presentations that explain product mix and regional exposure. In a few cases, paid subscriptions are used only for company financials and patent activity to sanity check innovation cycles and revenue split clues, without relying on any single database as the answer. The sources noted above are illustrative, and many other public references were also used for data collection, validation, and clarification.
Primary Interviews and Surveys
Next, we validate the desk-built assumptions through interviews and surveys with manufacturers, channel partners, installers, fire safety consultants, and large buyers in residential and commercial projects, so weak spots like pricing, replacement cycles, and smart adoption can be corrected. Coverage is balanced across major regions and building types, and follow-ups are done when responses conflict with observed construction activity or published safety requirements.
Distribution of primary research fieldwork respondents
| Company type | Respondent position | Region |
|---|---|---|
| Top tier: 33% | CXOs: 15% | APAC: 43% |
| Mid tier: 52% | Functional/Unit leaders: 36% | EMEA: 32% |
| Smaller Players: 15% | Managers: 49% | Americas: 25% |
Market-Sizing & Forecasting
Sizing is built using a combined top-down and bottom-up logic. From the top-down side, we reconstruct the demand pool by linking building activity and safety penetration, where new-build and retrofit volumes are translated into detector demand using code-driven placement intensity and replacement timing.
Inputs that matter in this market include construction starts and completions, retrofit and renovation cadence, residential versus non-residential mix, average detectors per site (homes, apartments, offices, and industrial facilities), the share of interconnected or smart units, and regional price ranges by sensor type (photoelectric, ionization, and dual-sensor). These variables are adjusted using primary feedback so the model reflects real purchasing behavior, including how false-alarm concerns and regulation changes shift preferences.
We then corroborate totals with selective bottom-up approximations, such as sampling supplier revenues by region, checking channel markups, and validating average selling price assumptions against installer quotes and public catalogs. Where company disclosures are limited, gaps are handled through peer-based ratios within the same region and product class, followed by re-checks with interviewees. For forecasting, scenario analysis is used, anchored on expected construction and renovation trajectories, regulation enforcement, and the pace of smart home and building automation adoption, with assumptions reviewed with industry participants.
Data Validation & Update Cycle
Outputs are cross-checked against independent signals, including construction indicators, trade flows where relevant, and consistency checks between implied volumes and pricing. If an outlier appears at country or segment level, the driver is traced back to the input sheet, and the assumption is either corrected or documented with a clear reason.
Before sign-off, the model is reviewed in steps, starting with internal peer review, followed by a final analyst pass that focuses on year-to-year logic and regional comparability. The report is refreshed annually, and interim updates are made when material events occur, such as major code changes, sharp pricing shifts, or supply disruptions, so clients receive an updated view close to delivery time.
Mordor Intelligence's Smoke Detector Market Size Compared With Other Published Estimates
Different published market numbers can look far apart even when they discuss similar devices, because they may count different product bundles, use different base years, or apply unlike price progression assumptions. Variations also come from whether replacement demand is modeled from installed base behavior or assumed as a simple percentage add-on.
Fire alarm control panels sold without a smoke detector sit outside Mordor Intelligence's scope, which can pull the total down versus figures that roll full alarm hardware into one bucket, and it also changes how retrofit project values are allocated. Other gap drivers include how fast smart, connected units are assumed to penetrate, how multi-sensor pricing is averaged, and the currency conversion timing used when regional sales are consolidated into USD.
Benchmark comparison
| Source | Market Size | Gaps in Research Methodology |
|---|---|---|
| Mordor Intelligence | USD 3.43 B (2026) | |
| Global Consultancy A | USD 3.55 B (2024) | Uses an earlier base year and may blend a wider set of safety-device revenues into the same bucket, which can lift the starting point and smooth out replacement effects. |
| Industry Publisher B | USD 4.50 B (2026) | Typically applies a broader definition that can treat integrated fire safety offerings as smoke-detector revenue, and may assume faster smart adoption and higher blended ASPs across end users. |
Taken together, the spread is mainly explained by what is counted as a smoke detector sale versus adjacent fire safety hardware, and by how quickly smart and multi-sensor pricing is assumed to move. By keeping the model tied to building activity, code-driven placement, and interview-checked pricing ranges, the final number stays traceable to clear inputs and repeatable steps.


Key Questions Answered in the Report
What is the current size of the smoke detector market?
The smoke detector market generated USD 3.43 billion in 2026 and is projected to hit USD 4.73 billion by 2031.
Which region leads the smoke detector market?
North America accounted for 39.62% of 2025 revenue due to strict interconnection rules and strong insurance incentives.
Which segment is growing fastest within the smoke detector market?
Transportation and logistics warehouses show the highest 9.22% CAGR through 2031 as e-commerce expands.
How are insurance companies influencing adoption?
Carriers such as Liberty Mutual and State Farm offer 5-20% premium cuts for IoT-connected detectors, accelerating smart device uptake.
Why are dual-sensor detectors becoming popular?
Regulations like EN 54-29 require multi-sensor capability to cut false alarms, pushing dual-sensor sales at a 8.98% CAGR.
What challenges hinder market growth in emerging economies?
High upfront costs for LoRaWAN/BLE smart detectors and shortages of certified installers in ASEAN nations slow adoption despite rising awareness.
Page last updated on:


 Your data is secure and never sold or shared.


