US Forklift Market Size and Share
Market Overview
| Study Period | 2020 - 2031 |
|---|---|
| Forecast Data Period | 2026 - 2031 |
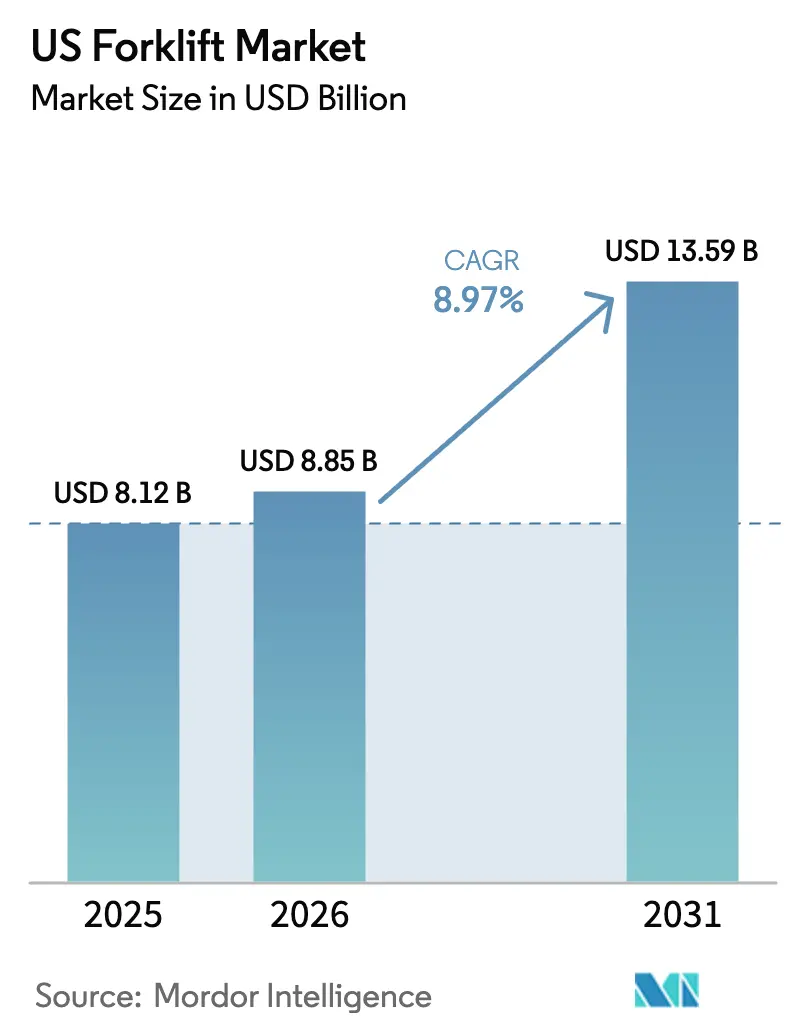
| Base Year Market Size (2025) | USD 8.12 Billion |
| Market Size (2026) | USD 8.85 Billion |
| Market Size (2031) | USD 13.59 Billion |
| Growth Rate (2026 - 2031) | 8.97% CAGR |
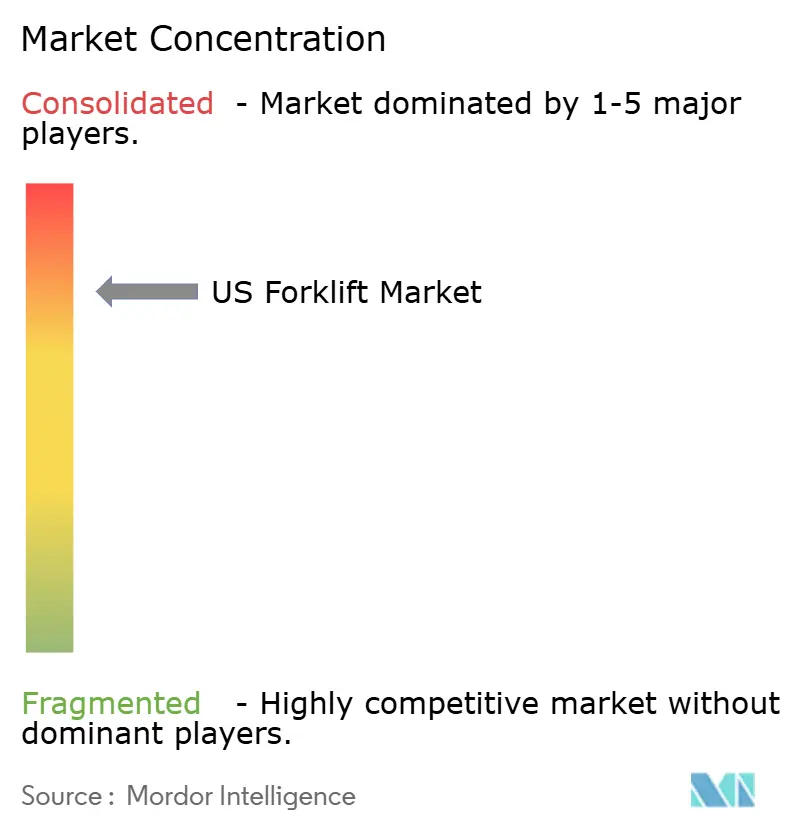
| Market Concentration | High |
Major Players *Disclaimer: Major Players sorted in no particular order Image © Mordor Intelligence. Reuse requires attribution under CC BY 4.0. | |
US Forklift Market Analysis by Mordor Intelligence
The US forklift market size was valued at USD 8.12 billion in 2025 and estimated to grow from USD 8.85 billion in 2026 to reach USD 13.59 billion by 2031, at a CAGR of 8.97% during the forecast period (2026-2031). Electrification, warehouse automation, and service-oriented fleet contracts are reshaping buyer priorities, while stronger emission mandates accelerate the migration from internal-combustion to electric power. [1]California Air Resources Board, “Zero-Emission Forklifts,” arb.ca.govManufacturers able to combine technology upgrades with nationwide service coverage are capturing new demand as 88% of purchasers rate after-sales support equal to equipment performance.[2]AAA Forklifts, “2025 Forklift Trends: Looking Beyond the Price Tag—Why Service and Innovation Will Define Your Success,” aaaforklifts.com Regionally, the South’s manufacturing expansion and logistics build-out underpin its leadership, while California’s zero-emission rules set a nationwide precedent. Competitive intensity remains high because four global OEMs already control around 80% of worldwide shipments; yet differentiation is widening between premium autonomous fleets and price-pressured conventional trucks. Grid-upgrade constraints and skilled-operator shortages temper growth but are being addressed through battery-buffer systems, workforce training, and semi-autonomous functions.
Key Report Takeaways
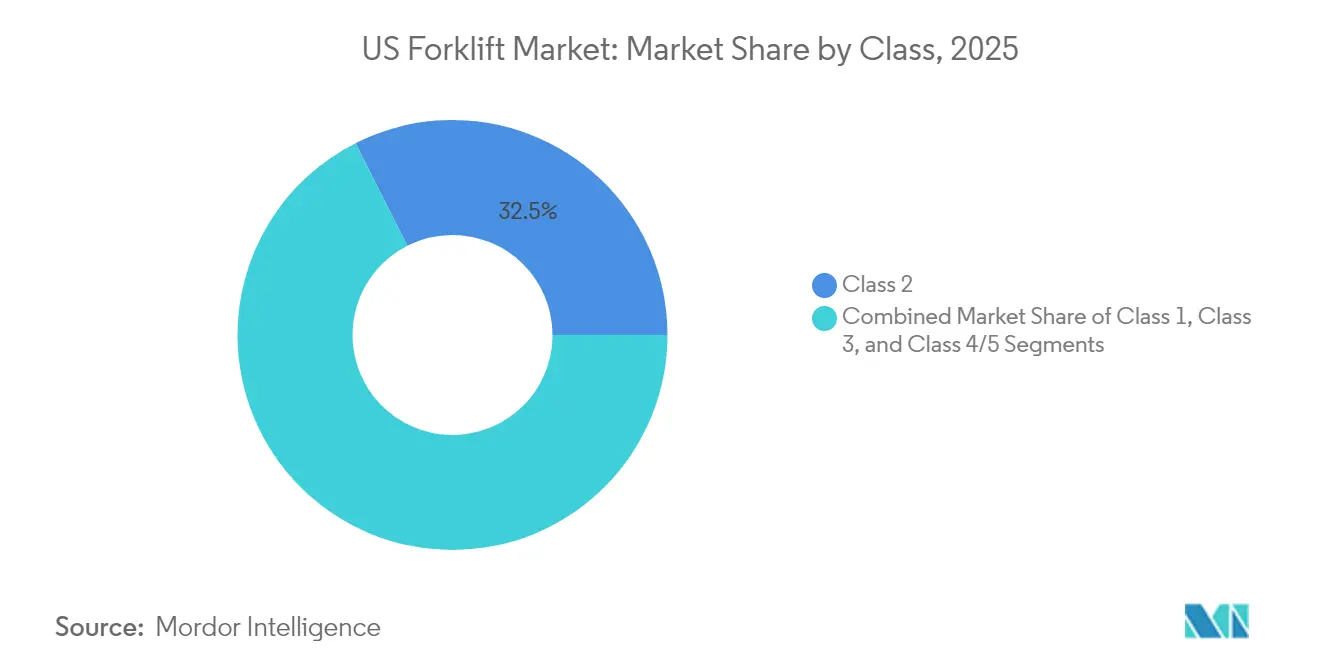
- By class, Class 2 trucks led with 32.45% of the US forklift market share in 2025, while Class 1 counterbalanced electrics are set to grow at a 9.12% CAGR to 2031.
- By power source, electric units captured 60.55% of the US forklift market size in 2025 and will expand at 10.98% CAGR between 2026-2031.
- By load capacity, sub-5-ton models accounted for 44.35% of the US forklift market size in 2025; the 5-15-ton band is projected to advance at 8.08% CAGR through 2031.
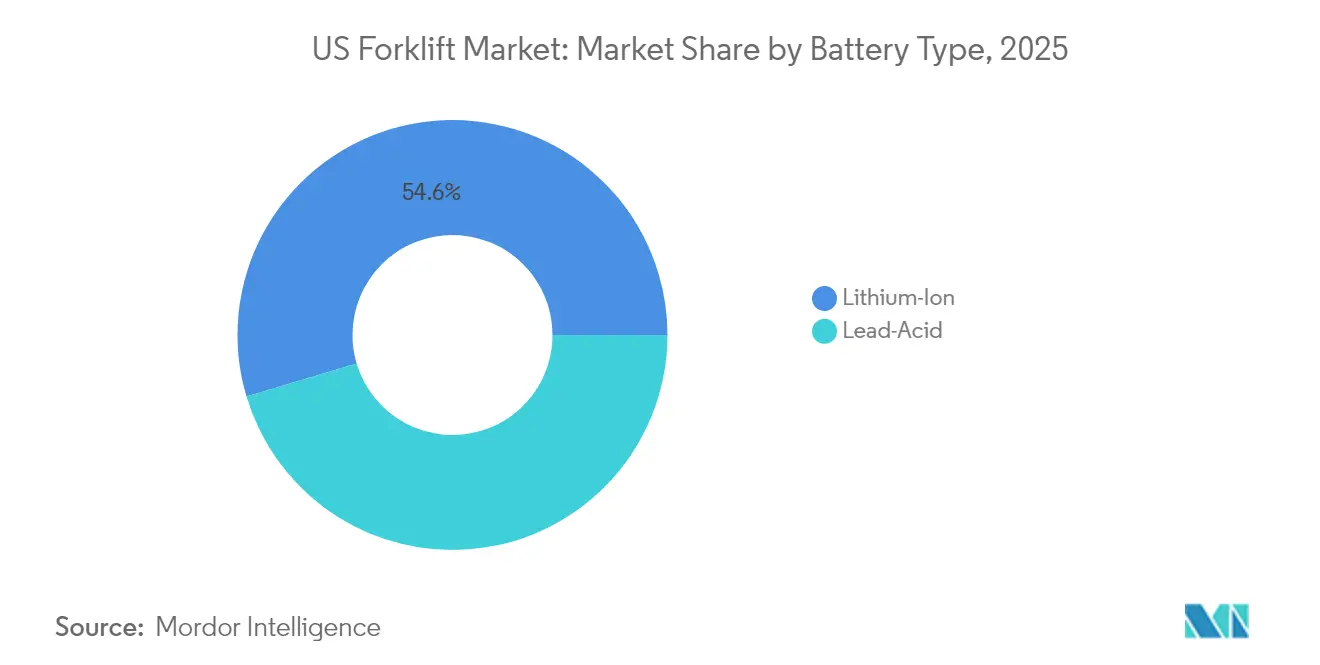
- By battery type, lithium-ion systems held 54.62% revenue share in 2025 and are forecast to rise at 13.85% CAGR to 2031.
- By end-use, logistics commanded 27.65% of 2025 revenue while retail and e-commerce are growing fastest at 12.11% CAGR to 2031.
Note: Market size and forecast figures in this report are generated using Mordor Intelligence’s proprietary estimation framework, updated with the latest available data and insights as of 2026.
US Forklift Market Trends and Insights
Drivers Impact Analysis*
| Driver | (~) % Impact on CAGR Forecast | Geographic Relevance | Impact Timeline |
|---|---|---|---|
| Expansion of e-commerce warehousing | +2.8% | National; South & Northeast hubs | Medium term (2-4 years) |
| Shift to electric forklifts due to emission regulations | +3.2% | California first; nationwide roll-out | Long term (≥ 4 years) |
| Automation & warehouse digitalization (smart forklifts) | +2.1% | Logistics corridors nationwide | Medium term (2-4 years) |
| Incentives for hydrogen fuel-cell forklifts at ports | +0.5% | West & South coastal ports | Long term (≥ 4 years) |
| Forklift-as-a-service subscription uptake | +0.9% | Urban centers | Short term (≤ 2 years) |
| Source: Mordor Intelligence | |||
Expansion of e-commerce warehousing
Daily parcel volumes surpassed 16.5 million units in late 2024, pushing fulfillment operators to retrofit or build high-throughput sites.[3]Logistics Management, “E-Commerce: Logistics Redefined,” logisticsmgmt.com DHL Supply Chain’s purchase of IDS Fulfillment added 1.3 million ft² of space across several states, underscoring sustained capacity growth. High-density designs favor narrow-aisle and pallet truck formats, intensifying demand for Class 1 and Class 3 units able to maneuver within 40-foot clear heights. Ninety percent of logistics firms plan significant digital-supply-chain investment, creating a premium sub-segment for sensor-rich trucks that integrate with warehouse-management systems.
Shift to electric forklifts due to emission regulations
California’s Zero-Emission Forklift Regulation bans new gasoline and propane deliveries starting 2026 and covers nearly 89,000 large-spark-ignition trucks.[4]California Air Resources Board, “Zero-Emission Forklifts,” arb.ca.govElectric models now account for 71% of North American sales, driven by maintenance savings of up to 50% and fuel savings near 80% compared with ICE units. Hyster’s lithium-ion series lifts 40,000 lb, matching combustion performance and dispelling capacity concerns.
Automation & warehouse digitalization (smart forklifts)
IoT-enabled forklifts equipped with lidar and AI position sensors are cutting handling times and addressing labor shortages. SEER Robotics introduced autonomous models in 2025 that navigate mixed environments and raise throughput by up to 40%. [5]SEER Robotics, “Streamlined Warehousing Begins with Smarter Forklift Technology,” seer-group.com ArcBest’s Vaux platform layers fleet-management software over AMR trucks, allowing remote, autonomous, and manual modes that conserve operator headcount.
Forklift-as-a-service subscription uptake
Jungheinrich’s Full Flex Rental offers 12-month cancelable contracts combining equipment, maintenance, and fleet analytics. The model shields users from capex, aligns fleet size with seasonal peaks, and ensures rapid access to new technology—advantages that resonate as economic volatility persists and service quality rises to parity with hardware performance.
Restraints Impact Analysis*
| Restraint | (~) % Impact on CAGR Forecast | Geographic Relevance | Impact Timeline |
|---|---|---|---|
| Shortage of skilled forklift operators | -1.2% | National; logistics hubs | Medium term (2-4 years) |
| High upfront cost of Li-ion & fuel-cell forklifts | -0.9% | Nationwide | Short term (≤ 2 years) |
| Grid capacity limits for fast-charge infrastructure | -0.7% | Older urban sites | Medium term (2-4 years) |
| Source: Mordor Intelligence | |||
Shortage of skilled forklift operators
Warehousing wages are rising 4-5%, yet retirements and pandemic exits leave certified-operator positions unfilled. The National Safety Council recorded 73 lift-truck-related fatalities in 2022, highlighting the safety cost of inexperience. Companies are funding accelerated training, flexible rosters, and operator-assist technologies to keep facilities productive.
High upfront cost of Li-ion & fuel-cell forklifts
Advanced trucks cost 2-3 times legacy models, and California regulators estimate a USD 2.7 billion compliance bill for local entities. Although lifecycle economics favor electrics over 5-7 years, SMEs struggle with initial outlays, slowing adoption outside strongly regulated regions.
*Our forecasts treat driver/restraint impacts as directional, not additive. The impact forecasts reflect baseline growth, mix effects, and variable interactions.
Segment Analysis
By Class: Narrow-Aisle Specialists Dominate
Class 2 vehicles captured 32.45% of the US forklift market in 2025, reflecting the premium placed on cubic-space efficiency inside e-commerce fulfillment centers. Class 1 electrics show the fastest 2026-2031 growth at 9.12% due to their versatility and regulatory momentum. Safety-focused sensor suites highlighted during National Forklift Safety Day 2024 are now standard, elevating unit pricing yet lowering incident costs.
Automation penetration is highest in Class 1 and 2 lines as OEMs embed lidar, SLAM mapping, and fleet-orchestration software. AutoXing’s January 2025 launch underscores this shift with Smart Forklifts able to switch between autonomous and manual modes. The US forklift market increasingly segments into autonomous premium tiers and conventional economy tiers, reflecting divergent buyer ROI thresholds.


By Power Source: Electric Revolution Accelerates
Electric units held 60.55% of 2025 volume and, propelled by California’s rule, the US forklift market is on track for 10.98% electric CAGR through 2031. ICE trucks still dominate outdoor, heavy-duty roles with 39.45 % share, yet technological parity is narrowing as lithium-ion packs power 40,000-lb lifts.
Telematics native to electric platforms deliver real-time productivity and safety dashboards. Southern Glazer’s Wine & Spirits uses digital safety checks to guide maintenance cycles, demonstrating how data loops convert power-train shifts into operational gains. Over time, US forklift market economics will increasingly hinge on software-enabled efficiency rather than raw equipment capacity.
By Load Capacity: Lightweight Leaders
Sub-5-ton forklifts represented 44.35% of 2025 shipments, mirroring demand for agile units in retail and assembly-line settings. The 5-15-ton segment will outpace others at 8.08% CAGR, powered by medium-duty manufacturing and the autonomous-forklift boom. Above-15-ton machines remain staples in construction supplies and metals handling.
Electric innovations are cascading upward; Hyster’s high-capacity lithium-ion series erodes ICE advantages in ports and steel mills. Walmart’s deployment of autonomous medium-capacity forklifts illustrates mainstream acceptance of automation to offset labor gaps. This traction ensures that US forklift market size gains in mid-capacity bands will stay aligned with automation rollouts.
By Battery Type: Lithium-Ion Leads the Charge
Lithium-ion captured 54.62% share in 2025, a milestone driven by fast-charge, opportunity-charge, and maintenance-free benefits. With a 13.85% projected CAGR, lithium-ion will dominate US forklift market size growth over the decade. Lead-acid retains relevance in budget-sensitive fleets but faces intensifying TCO scrutiny.
Flux Power’s partnership with a top OEM to launch UL-certified S-Series packs signals vertical integration between battery startups and incumbents. Education campaigns are dismantling myths around lithium safety and heavy-lift suitability, thereby broadening the US forklift market acceptance curve.
By End-User: E-Commerce Drives Demand
Logistics controlled 27.65% revenue in 2025, underpinned by omnichannel distribution networks. Retail-e-commerce is the fastest-growing customer set at 12.11% CAGR to 2031, spurred by consumer same-day expectations and the surge in less-than-truckload parcel flows. Industrial plants still contribute 35% share, offering baseline stability.
Specialized niches, such as chemical handling with explosion-proof requirements, command premium pricing. As 90% of logistics providers budget for digital-supply-chain upgrades, end-users evaluate forklifts not just on lift metrics but on data compatibility and lifecycle emissions—criteria reshaping the US forklift market procurement playbook.
Geography Analysis
The South accounts for 37.55% of the US forklift market in 2025, reinforced by reshoring trends, competitive land costs, and deepwater port connectivity. The region’s 6.55% forecast CAGR also reflects state-level initiatives to align vocational training with logistics needs. HydroFleet’s USD 33 million facility in Pooler exemplifies new capital flowing toward Southern distribution hubs.
The Northeast maintains demand density in legacy industrial zones where narrow-aisle electrics help offset high real-estate costs. Yet older buildings often need electrical-service upgrades before fast-charge systems can be installed, lengthening payback horizons. Crown Equipment’s new Ohio site indicates corporate confidence in regional after-sales coverage.
The West, heavily influenced by California’s regulations, accelerates early adoption of zero-emission fleets and hydrogen pilots at maritime terminals. Clean-Ports funding creates a testing ground for hydrogen forklift economics, potentially exporting best practices nationwide. Collectively, these dynamics keep US forklift market growth widely distributed but governance-driven in coastal jurisdictions.
Competitive Landscape
Market concentration remains moderate-to-high, Toyota Industries (USD 16.32 billion), KION (USD 9.35 billion), Jungheinrich (USD 6.12 billion), and NACCO together command roughly 80% of global shipments. Crown Equipment lifted revenue 10.4% to USD 5.18 billion, while Hyster-Yale posted USD 4.1 billion.
Strategic M&A underpins portfolio consolidation. Hyster-Yale’s acquisition of Bolzoni secures attachment supply and deters competitor sourcing. Partnerships also enable technology leapfrogging: KION North America allied with Fox Robotics to fast-track autonomous loaders, while Flux Power’s battery branding deal embeds energy expertise inside OEM channels.
Disruptive entrants leverage a software-first approach. Third Wave Automation and Cyngn integrate retrofit autonomy kits that transform installed bases, compelling incumbents to accelerate in-house AI developments. Telematics and lifecycle analytics emerge as decisive value propositions, steering the US forklift market narrative from hardware specifications to data-driven uptime guarantees.
US Forklift Industry Leaders
Heli America Inc.
Crown Equipment Corporation
Hangcha Forklift America
Kion Group
Komatsu Ltd.
- *Disclaimer: Major Players sorted in no particular order

Recent Industry Developments
- May 2025: Kalmar booked a large contract for electric forklifts, signalling sustained buyer momentum toward zero-emission fleet
- May 2025: California Air Resources Board finalized the Zero-Emission Forklift Regulation, pending federal authorization, cementing the 2028-2038 fleet-turnover timeline
- March 2025: HELI introduced three new lithium-powered models targeting beverage logistics, supported by manufacturing investments and channel partnerships
- February 2025: HydroFleet committed USD 33 million to expand operations in Pooler, Georgia, reinforcing Southern market demand for heavy material-handling assets
- January 2025: AutoXing debuted Smart Forklift units with modular autonomy and rapid deployment features


Research Methodology Framework and Report Scope
Market Definitions and Key Coverage
Our study defines the United States forklift market as the annual value generated by the sale or long-term lease of new counter-balance and warehouse lift trucks rated up to 50 tons, across Classes 1-5, whether powered by internal combustion, battery electric, or emerging hydrogen fuel cells.
Scope exclusion: Refurbished units, short-term rentals (≤12 months), and aftermarket parts are outside the valuation.
Segmentation Overview
- By Class
- Class 1
- Class 2
- Class 3
- Class 4/5
- By Power Source
- ICE
- Electric
- By Load Capacity
- Below 5 Tons
- 5-15 Tons
- Above 15 Tons
- By Electric Battery Type
- Lithium-Ion
- Lead-Acid
- By End-User
- Industrial
- Logistics
- Chemical
- Food and Beverage
- Retail and E-Commerce
- Other End-Uses
- By Region
- Northeast
- Midwest
- South
- West
Detailed Research Methodology and Data Validation
Primary Research
Multiple interviews with fleet managers, regional dealers, battery suppliers, and safety inspectors across the South, Midwest, and West provide transaction prices, fleet mix shifts, and utilization curves that literature alone cannot surface. Follow-up surveys with warehouse automation integrators clarify adoption timelines for lithium-ion and autonomous trucks.
Desk Research
Our analysts review open-source datasets such as US Census Bureau machinery shipments, Bureau of Transportation Statistics equipment imports, OSHA incident logs, and California Air Resources Board rulemakings, then triangulate them with trade association releases from the Industrial Truck Association and World Industrial Truck Statistics. Company 10-Ks, investor decks, and credible news captured through Dow Jones Factiva add volume, price, and channel color. We also tap D&B Hoovers for OEM financial splits and Volza shipment records to validate cross-border flows. These sources are illustrative, not exhaustive; many additional publications inform gap filling and plausibility checks.
Market-Sizing & Forecasting
A top-down reconstruction begins with national production, import, and fleet retirement data, which are then calibrated to end-use demand pools (manufacturing, logistics, retail). Select bottom-up cross-checks, dealer shipment roll-ups, and sampled average selling price times unit estimates anchor the totals. Key variables include ecommerce warehouse floor space, state zero-emission forklift deadlines, average plant utilization rates, lithium-ion price curves, and replacement cycle length. Multivariate regression blends these drivers, and scenario analysis tests sensitivity to federal infrastructure spending and interest-rate swings before numbers are finalized.
Data Validation & Update Cycle
Outputs pass a multi-step review: automated variance flags, peer analyst audits, and senior sign-off. Models refresh annually, with interim updates triggered by material events such as new CARB rules. A last-mile validation occurs just before publication so clients receive the latest view.
Why Mordor's US Forklift Baseline Commands Reliability
Published estimates often diverge because each firm defines forklift scope, pricing assumptions, and refresh cadence differently.
Key gap drivers include whether telehandler hybrids are counted, if forecast models apply constant or inflation-adjusted ASPs, and how rule changes like California's 2026 LSI phase-out are treated. Mordor reports only new conventional lift trucks, uses transaction-weighted ASP progression, and refreshes every twelve months; other publishers may mix refurbished sales or apply static prices, leading to wider or steeper trajectories.
Benchmark comparison
| Market Size | Anonymized source | Primary gap driver |
|---|---|---|
| USD 8.12 B (2025) | Mordor Intelligence | - |
| USD 9.11 B (2023) | Global Consultancy A | Includes refurbished units; constant 2020 ASP |
| USD 12.40 B (2025) | Sector Publisher B | Counts short-term rentals; aggressive e-commerce growth factor |
| USD 9.14 B (2023) | Trade Journal C | Mixed new and used volumes; excludes dealer margins |
The comparison shows that once differing scopes and price bases are stripped away, Mordor's disciplined bottom-up cross-checked totals offer a balanced, transparent baseline decision-makers can rely on.


Key Questions Answered in the Report
What is the current size of the US forklift market?
The US forklift market stands at USD 8.85 billion in 2026.
How fast is the US forklift market expected to grow?
The sector is projected to register a 8.97% CAGR and reach USD 13.59 billion by 2031.
Why are electric forklifts gaining share so quickly?
Zero-emission regulations, 50% lower maintenance costs, and up to 80% fuel savings are accelerating adoption.
Which region leads US forklift demand?
The South holds 37.55% of 2025 shipments and is forecast to grow at 6.55% CAGR.
What technology trends are most influential?
Warehouse automation, lithium-ion batteries, telematics, and forklift-as-a-service contracts drive premium growth.
Page last updated on:


