Market Overview
| Study Period | 2020 - 2031 |
|---|---|
| Forecast Data Period | 2026 - 2031 |
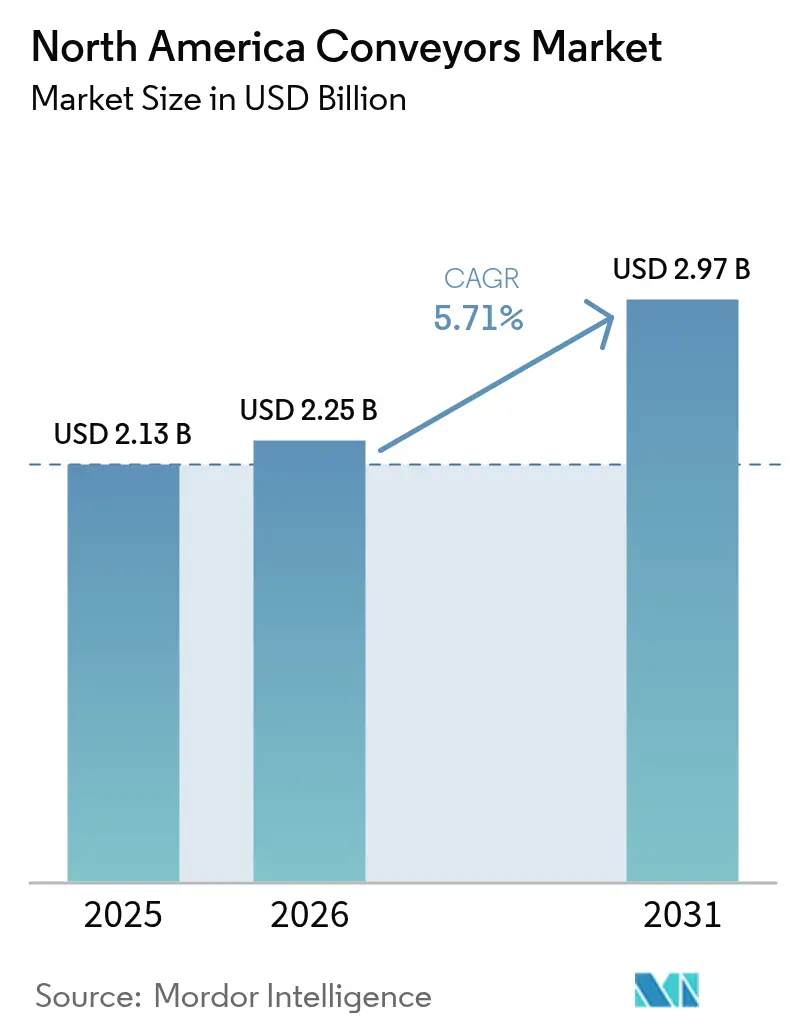
| Base Year Market Size (2025) | USD 2.13 Billion |
| Market Size (2026) | USD 2.25 Billion |
| Market Size (2031) | USD 2.97 Billion |
| Growth Rate (2026 - 2031) | 5.71% CAGR |
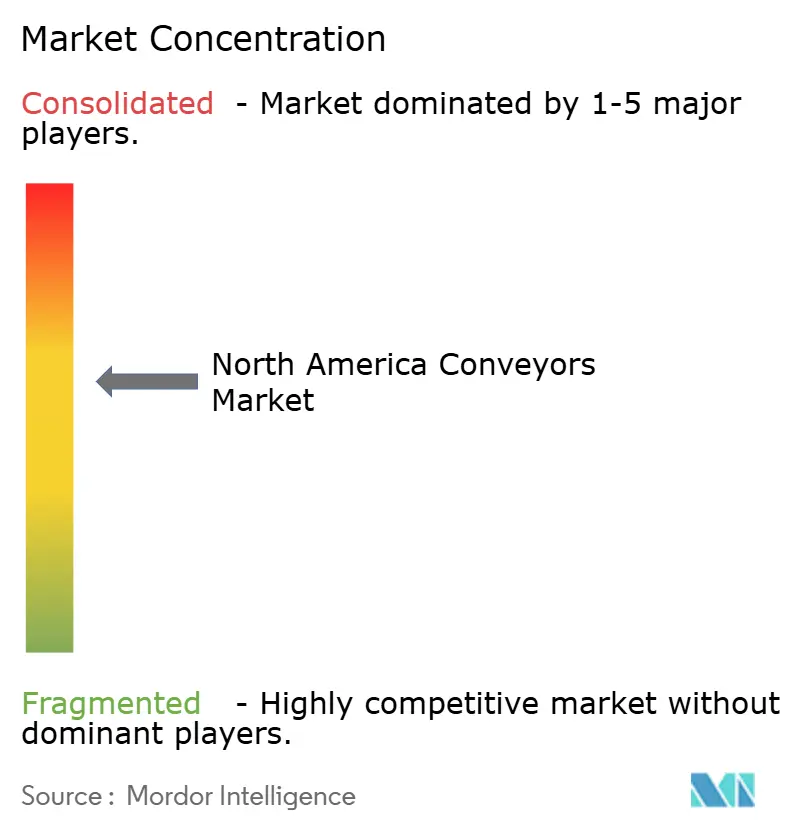
| Market Concentration | Medium |
Major Players *Disclaimer: Major Players sorted in no particular order Image © Mordor Intelligence. Reuse requires attribution under CC BY 4.0. | |
North America Conveyors Market Analysis by Mordor Intelligence
The North America conveyors market size is projected to expand from USD 2.13 billion in 2025 and USD 2.25 billion in 2026 to reach USD 2.97 billion by 2031, registering a CAGR of 5.71% between 2026 to 2031. Strong e-commerce traction, upgraded automotive assembly lines and rising labor costs across logistics operations keep capital flowing toward automated material-handling assets. Operators prefer smart, plug-and-play conveyor modules that trim market-share lead times to a single month and support retrofit work within occupied facilities. Vendors now bundle hardware, predictive-maintenance software and energy-efficiency guarantees as one invoice, shielding customers from the complexity of multi-vendor integration. At the same time, autonomous mobile robots (AMRs) are redefining the return-on-investment thresholds for fixed conveyors, pushing manufacturers to embed IoT sensors and machine-learning diagnostics in every new drive package. Throughout 2026, capacity additions are expected to be footprint-neutral, with most projects focused on raising throughput velocity rather than expanding square footage, a pattern that amplifies demand for spiral and vertical conveyors within the North America conveyors market.
Key Report Takeaways
- By product type, roller conveyors led with 58.63% of the North America conveyors market share in 2025, while belt conveyors post the fastest projected 6.19% CAGR to 2031.
- By conveyor class, unit handling systems captured 71.23% of the North America conveyor market size in 2025, and bulk handling units are forecast to advance at a 6.52% CAGR through 2031.
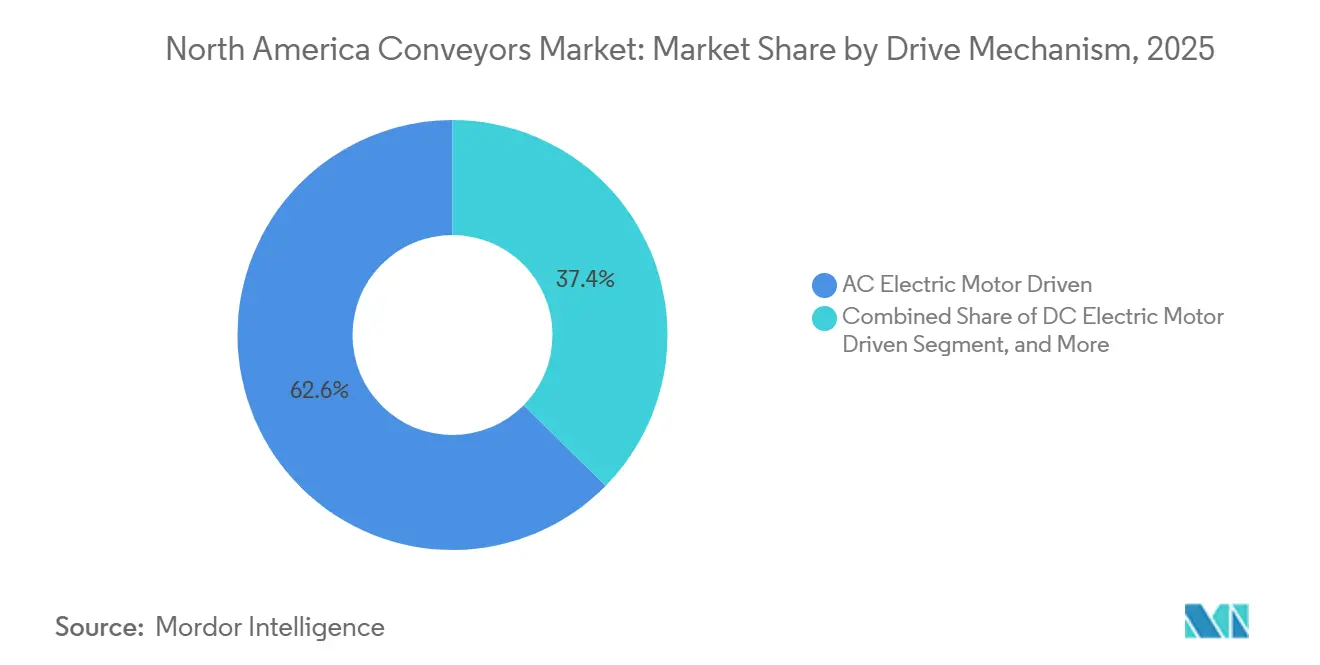
- By drive mechanism, AC electric motor-driven lines accounted for 62.63% of market share in 2025; DC electric motor-driven systems are poised to grow at a 6.26% CAGR during the same horizon.
- By end-user industry, automotive applications held 27.52% share in 2025, yet retail and e-commerce fulfillment is on track for a 7.12% CAGR, the quickest among all end-user groups.
- By country, United States dominated with an 80.17% revenue share in 2025, whereas Canada is expected to record the highest country-level 6.18% CAGR out to 2031.
Note: Market size and forecast figures in this report are generated using Mordor Intelligence’s proprietary estimation framework, updated with the latest available data and insights as of 2026.
North America Conveyors Market Trends and Insights
Drivers Impact Analysis*
| Driver | (~) % Impact on CAGR Forecast | Geographic Relevance | Impact Timeline |
|---|---|---|---|
| Rapid Growth of E-Commerce and Omnichannel Fulfillment Hubs | +1.8% | United States (coastal metros), Canada (Toronto, Vancouver), Mexico (Monterrey) | Short term (≤ 2 years) |
| Automation and Industry 4.0 Adoption Driving Smart Conveyors | +1.5% | United States (manufacturing belt), Canada (Ontario automotive corridor) | Medium term (2-4 years) |
| Increasing Demand for Handling Larger Volumes of Goods and Improving Productivity | +1.2% | United States, Canada, Mexico (cross-border trade hubs) | Medium term (2-4 years) |
| Expansion of Food and Beverage Processing Requiring Hygienic Conveyor Solutions | +0.9% | United States (Midwest, Southeast), Canada (Prairie provinces) | Long term (≥ 4 years) |
| Federal Decarbonization Incentives Favoring Energy-Efficient Motor-Drive Retrofits | +0.7% | United States (IRA-eligible facilities), Canada (federal infrastructure programs) | Long term (≥ 4 years) |
| Surge in Micro-Fulfillment Dark Stores Necessitating Ultra-Compact Spiral and Vertical Conveyors | +0.6% | United States (urban cores), Canada (Greater Toronto Area, Metro Vancouver) | Short term (≤ 2 years) |
| Source: Mordor Intelligence | |||
Automation And Industry 4.0 Adoption Driving Smart Conveyors
Automakers, parcel carriers and third-party logistics firms now commission conveyor projects with digital-twin simulations embedded in the bid specifications. Edge-based analytics track motor temperature, bearing vibration and belt tension, flagging anomalies three to four days before failure, which cut unplanned downtime 22% in 2025 deployments.[1]Bosch Rexroth, “Predictive Maintenance Cuts Conveyor Downtime by 22%,” boschrexroth.com Warehouse execution software synchronizes conveyor speeds with AMR fleets, and 5G private networks keep latency below 100 milliseconds, enabling decentralized pathing without a masthead control room. Vendors position these smart-conveyor packages as quick-payback retrofits that slot into legacy frames, an approach that accelerates adoption in the North America conveyors market.
Rapid Growth Of E-Commerce And Omnichannel Fulfillment Hubs
E-commerce penetration reached 16.2% of total U.S. retail sales in 2025, yet secondary cities remain under-served by high-speed sortation. Retailers opened 47 new fulfillment centers last year, 68% of which include conveyors that process 12,000-15,000 units per hour double the manual alternative.[2] Reuters Staff, “Walmart and Target Expand Fulfillment Centers in 2025,” reuters.comAs stores double as mini-distribution nodes, compact belt and roller modules are squeezed into backrooms, cutting walk distances and order-to-ship cycles. This democratization of automation broadens the North America conveyors market beyond traditional logistics campuses.
Increasing Demand For Handling Larger Volumes And Improving Productivity
Freight volumes under USMCA rose 8.3% in 2025, and border warehouses retrofitted conveyors to clear higher inspection loads.[3]U.S. Food and Drug Administration, “FSMA Compliance for Conveyor Equipment,” fda.gov Inline scanners and dimensioning cameras now achieve 99.7% data-capture accuracy, erasing the manual keying errors that once triggered 3-5% fulfillment discrepancies. Robotics-integrated conveyor cells removed up to half of the end-of-line labor in beverage distribution all adding momentum to the North America conveyors market.
Expansion Of Food And Beverage Processing Requiring Hygienic Conveyor Solutions
FSMA and USDA rules oblige processors to install stainless-steel frames and tool-free belts that withstand full washdown within 30 minutes. Beverage bottlers favor open-frame architecture with antimicrobial coatings that meet 3-A sanitary finish criteria. Vendors bundle hardware with validation audits, providing a turnkey path to compliance and fueling segment growth inside the North America conveyors market.
Restraints Impact Analysis*
| Restraint | (~) % Impact on CAGR Forecast | Geographic Relevance | Impact Timeline |
|---|---|---|---|
| High Initial Capital Expenditure for Automated Systems | -0.9% | United States (SME operators), Canada (regional distributors), Mexico (maquiladoras) | Short term (≤ 2 years) |
| Volatility in Raw Material Prices Inflating Total Cost of Ownership | -0.7% | United States, Canada, Mexico (import-dependent fabricators) | Medium term (2-4 years) |
| Space Constraints in Legacy Facilities Limiting Conveyor Layouts | -0.5% | United States (Northeast, Midwest legacy industrial zones) | Long term (≥ 4 years) |
| Emergence of Plug-and-Play AMRs and Swarm Robotics Reducing Fixed Conveyor ROI | -0.6% | United States (e-commerce, 3PL), Canada (automotive, retail) | Medium term (2-4 years) |
| Source: Mordor Intelligence | |||
High Initial Capital Expenditure For Automated Systems
Turnkey conveyor packages run USD 2.8-4.2 million per 100,000 square feet, and equipment-loan rates above 7.5% through early 2026 pinch small operators. Lease models soften the blow, yet residual-value and maintenance clauses remain contentious. The financing hurdle divides the North America conveyors market between deep-pocketed nationals that amortize automation across many sites and regional distributors that stretch labor a little longer.
Volatility In Raw Material Prices Inflating Total Cost Of Ownership
Steel-mill product prices increased by 12% year-over-year during 2024-2025. Aluminum and copper costs fluctuated significantly, prompting fabricators to implement price-escalation clauses that increased installed conveyor costs by 8-10%. Component suppliers passed on surcharges, causing project budgets prepared six months earlier to fall short, delaying purchase orders and reducing near-term revenue in the North America conveyors market.
*Our forecasts treat driver/restraint impacts as directional, not additive. The impact forecasts reflect baseline growth, mix effects, and variable interactions.
Segment Analysis
By Product Type: Modular Roller Dominance Meets Sanitary Belt Surge
Roller conveyors held a 58.63% stake in 2025, anchoring the North America conveyors market as the go-to option for automotive and parcel sortation lines. Belt conveyors, though, are expected to log the swiftest 6.19% CAGR as food processors adopt FDA-compliant, washdown-ready designs. Pallet, overhead and niche spiral solutions round out demand, positioning suppliers that offer field-reconfigurable modules to capture retrofit orders. The IEC 60204-1 safety update is accelerating replacement of pre-2015 builds, reinforcing volume for premium, sensor-laden frames throughout the North America conveyors market.
Bolt-together segments enable a two-hour lane swap without welders, an edge that resonates inside micro-fulfillment footprints. Integrated vision systems now identify bent rollers and frayed belts before a jam erupts, shrinking downtime windows to minutes. With Amazon-style peak-season surges stressing parcel hubs, roller and belt suppliers that deliver predictive-maintenance dashboards capture wallet share.


By Conveyor Class: Unit Handling Leads While Bulk Handling Accelerates
Unit handling systems commanded 71.23% of the 2025 market size, emphasizing the consumer-driven character of the North America conveyors market size for discrete-item movement. Bulk handling variants are set for a 6.52% CAGR as miners in Saskatchewan and the U.S. Mountain West adopt flame-resistant belts that meet the updated MSHA guarding code. Hybrid lines capable of toggling from cases to loose grain illustrate how technology from one class migrates to the other, saving 15-20% in capital by sharing frame infrastructure.
In warehouses, AI cameras over unit handling belts flag crushed cartons in real time, isolating damage before outbound scanning. At coal and potash sites, overland bulk belts now stretch beyond 1,000 feet, conveying up to 2,000 tons per hour while remote sensors transmit tension data to control rooms miles away, embodying Industry 4.0 inside the rugged corners of the North America conveyors market.
By Drive Mechanism: AC Electric Motors Dominate As DC Variants Gain Efficiency Edge
AC motors powered 62.63% of the market share in 2025, but DC drive trains leveraging regenerative braking are forecast to outpace at 6.26% CAGR, buoyed by DOE rebate stacks. Integrated motor-drive packages shave 40% off panel space, and plant engineers prefer the plug-ready wiring harness over field-assembled starters. Hydraulics remain in heavy-duty stamping, yet each retrofit season sees an incremental shift to electrics as compressed-air and hydraulic costs rise.
Real-time power meters now feed facility dashboards that report kilowatt-hours per shipped unit, turning energy into an executive KPI. Sites qualifying for IRA 179D tax deductions unlock USD 1.80-5.00 per square foot, converting green-equipment upgrades into two-year paybacks, a compelling narrative inside the North America conveyors market.
By End-User Industry: Automotive Holds Share As Retail And E-Commerce Surge
Automotive plants secured 27.52% share in 2025, as body-in-white conveyors ferry 1,500-kilogram frames through weld shops without paint overspray risk. Still, retail and e-commerce lines enjoy a 7.12% CAGR, the swiftest of all segments, propelled by same-day delivery commitments that require 12,000-unit-per-hour sortation. General manufacturing, food and beverage, pharmaceuticals and mining line up behind, each with domain-specific compliance triggers such as FSMA sanitation or TSA baggage rules.
Micro-fulfillment apparel hubs embed spiral conveyors within a 12-foot diameter, freeing 40 feet of floor. Dairy processors insist on stainless frames rated IP69K, and pharmaceutical lines integrate HEPA-filtered enclosures that control particle generation to ISO Class 7. This varied compliance matrix assures continuous, multi-vertical demand for suppliers serving the North America conveyors market.
Geography Analysis
The United States generated 80.17% of regional revenue in 2025, anchored by 1.2 million square feet of fresh e-commerce floor space and more than 10 million light vehicles rolling off assembly lines. OSHA’s tighter 1910.219 guarding rule hastened change-outs of pre-2010 food-plant conveyors, driving replacement backlogs in Ohio, Indiana and Illinois. EV-battery corridors in Georgia and Tennessee adopt cleanroom-compatible belts, and DOE rebates compress DC-drive paybacks below three years, strengthening the North America conveyors market footprint in the United States.
Canada is climbing at a 6.18% CAGR through 2031 on the back of a CAD 188 billion infrastructure pledge (USD 138 billion) and EV investments along the Windsor-Oshawa corridor. Potash belts in Saskatchewan now feature flame-resistant compounds to meet provincial safety codes, while Metro Vancouver’s dark-store boom installs spiral conveyors that squeeze into repurposed storefronts. Manufacturing shipments rose 4.2% in 2025, with transportation equipment leading, feeding conveyor orders across the North America conveyors market.
Mexico benefits from a 12% rise in foreign direct manufacturing investment, as firms seeking USMCA duty-free status open lines in Monterrey and Querétaro. Maquiladoras still favor labor, but wage inflation pushing turnover beyond 25% nudges operators toward semi-automated conveyors. Government infrastructure spend of MXN 1.3 trillion (USD 76 billion) for logistics hubs includes bulk-transfer belts at inland ports, albeit adoption lags Canada and the United States, keeping Mexico a fast-growing yet smaller slice of the North America conveyors market.
Competitive Landscape
Market concentration sits in the mid-range; the top ten integrators held roughly 55-60% of 2025 revenue, classifying the North America conveyors market as moderately consolidated. Daifuku, Dematic and Honeywell Intelligrated embed AI diagnostics inside every new controller, shaving downtime 15-25% and differentiating against AMR disruptors. Swisslog and Vanderlande have moved up-stack, buying software firms to control both fixed and mobile automation portfolios, while Hytrol and Dorner defend with fast-custom fabrication and same-day parts-shipment promises.
Raw-material volatility dented margins for smaller shops when steel rose 12% during 2024-2025, but Interroll’s regenerative DC rollers reclaim energy to offset OPEX shocks. Patent records show momentum toward hybrid conveyor-robot swarms governed by decentralized algorithms that cut licensing fees 20-30%. Large retailers now demand energy-savings guarantees baked into frame contracts, forcing suppliers to verify kilowatt-hour reductions via cloud dashboards. The North America conveyors market therefore rewards integrators that balance digital services, compliance upgrades and rapid build cycles.
North America Conveyors Industry Leaders
Daifuku Co., Ltd.
Schaefer Systems International, Inc.
Murata Machinery USA, Inc.
Honeywell Intelligrated Inc.
Dorner Manufacturing Corporation
- *Disclaimer: Major Players sorted in no particular order

Recent Industry Developments
- February 2026: Dematic committed USD 180 million to expand its Grand Rapids, Michigan, plant, adding 250,000 square feet for high-speed sortation lines.
- January 2026: Honeywell Intelligrated landed a USD 95 million conveyor-and-software deal covering 14 regional distribution centers for a major retailer.
- December 2025: Daifuku acquired a 60% stake in a Canadian integrator for CAD 72 million (USD 53 million) to deepen reach in Ontario and Western Canada.
- November 2025: Bastian Solutions unveiled an equipment-as-a-service model that links conveyor payments to throughput volumes.


North America Conveyors Market Report Scope
Conveyor systems are mechanical devices or assemblies that are used to transport various materials with little effort. There are different kinds of conveyor systems, usually consisting of a frame that supports either wheels, rollers, or a belt, upon which the materials move from one place to another.
The North America Conveyors Market Report is Segmented by Product Type (Belt, Roller, Pallet, Overhead, Other Specialized Conveyors), Conveyor Class (Unit Handling, Bulk Handling), Drive Mechanism (AC Electric Motor, DC Electric Motor, Hydraulic, Pneumatic), End-User Industry (Airport, Retail and E-Commerce, Automotive, General Manufacturing, Food and Beverage, Pharmaceuticals, Mining, Other), and Geography (United States, Canada, Mexico). Market Forecasts are Provided in Terms of Value (USD).
By Product Type
| Belt |
| Roller |
| Pallet |
| Overhead |
| Other Specialized Conveyors |
By Conveyor Class
| Unit Handling Conveyors |
| Bulk Handling Conveyors |
By Drive Mechanism
| AC Electric Motor Driven |
| DC Electric Motor Driven |
| Hydraulic Driven |
| Pneumatic Driven |
By End-User Industry
| Airport |
| Retail and E-Commerce Fulfillment |
| Automotive |
| General Manufacturing |
| Food and Beverage |
| Pharmaceuticals |
| Mining and Quarrying |
| Other End-User Industries |
By Country
| United States |
| Canada |
| Mexico |
| By Product Type | Belt |
| Roller | |
| Pallet | |
| Overhead | |
| Other Specialized Conveyors | |
| By Conveyor Class | Unit Handling Conveyors |
| Bulk Handling Conveyors | |
| By Drive Mechanism | AC Electric Motor Driven |
| DC Electric Motor Driven | |
| Hydraulic Driven | |
| Pneumatic Driven | |
| By End-User Industry | Airport |
| Retail and E-Commerce Fulfillment | |
| Automotive | |
| General Manufacturing | |
| Food and Beverage | |
| Pharmaceuticals | |
| Mining and Quarrying | |
| Other End-User Industries | |
| By Country | United States |
| Canada | |
| Mexico |


Key Questions Answered in the Report
How large is the North America conveyors market today?
It reached USD 2.25 billion in 2026 and is projected at USD 2.97 billion by 2031, reflecting a 5.71% CAGR.
Which product type dominates sales?
Modular roller conveyors held 58.63% share in 2025 owing to deep penetration in automotive and parcel sortation lines.
What segment is growing the fastest?
Belt conveyors are forecast to rise at a 6.19% CAGR to 2031, driven by food-grade, wash-down requirements.
Why is Canada growing quicker than the United States?
Federal infrastructure spending and electric-vehicle supply-chain projects push Canada to a 6.18% CAGR through 2031.
How are suppliers coping with rising steel prices?
Many pass through surcharges, while others launch energy-efficient DC rollers and service contracts to offset lifecycle costs.
Are AMRs replacing fixed conveyors?
In facilities under 100,000 square feet, AMRs compete on ROI, yet most large fulfillment centers still pair robots with fixed conveyors for high-volume lanes.
Page last updated on:


