Video Streaming Market Size and Share
Market Overview
| Study Period | 2020 - 2031 |
|---|---|
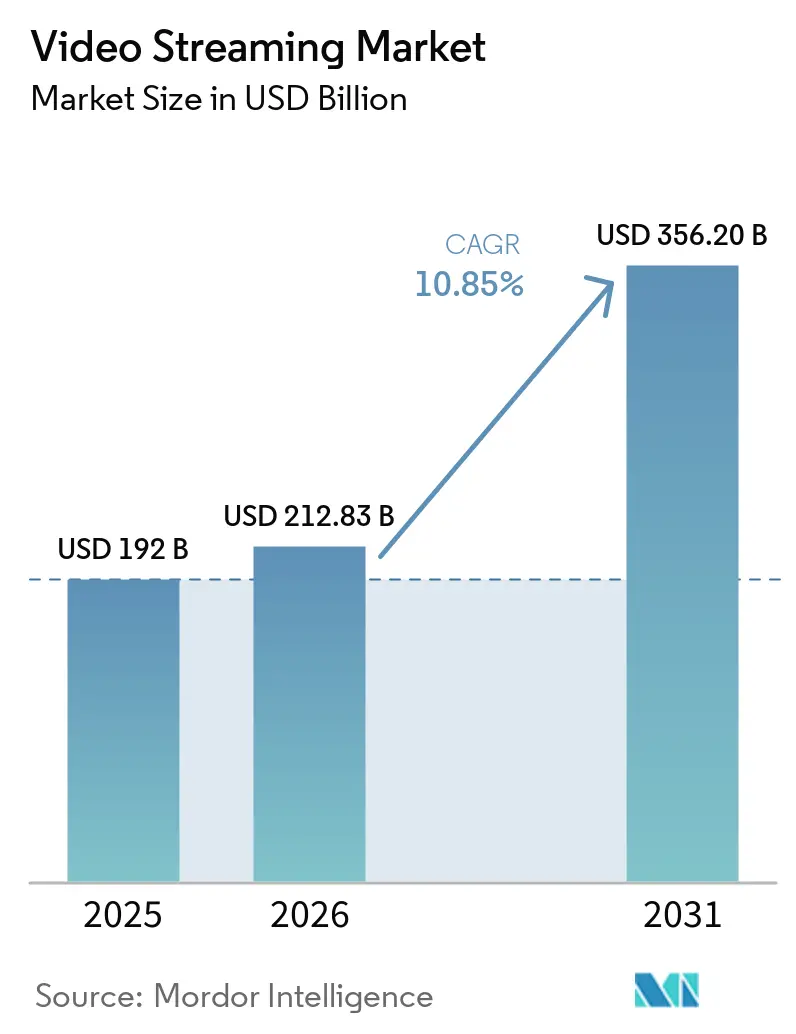
| Market Size (2026) | USD 212.83 Billion |
| Market Size (2031) | USD 356.20 Billion |
| Growth Rate (2026 - 2031) | 10.85% CAGR |
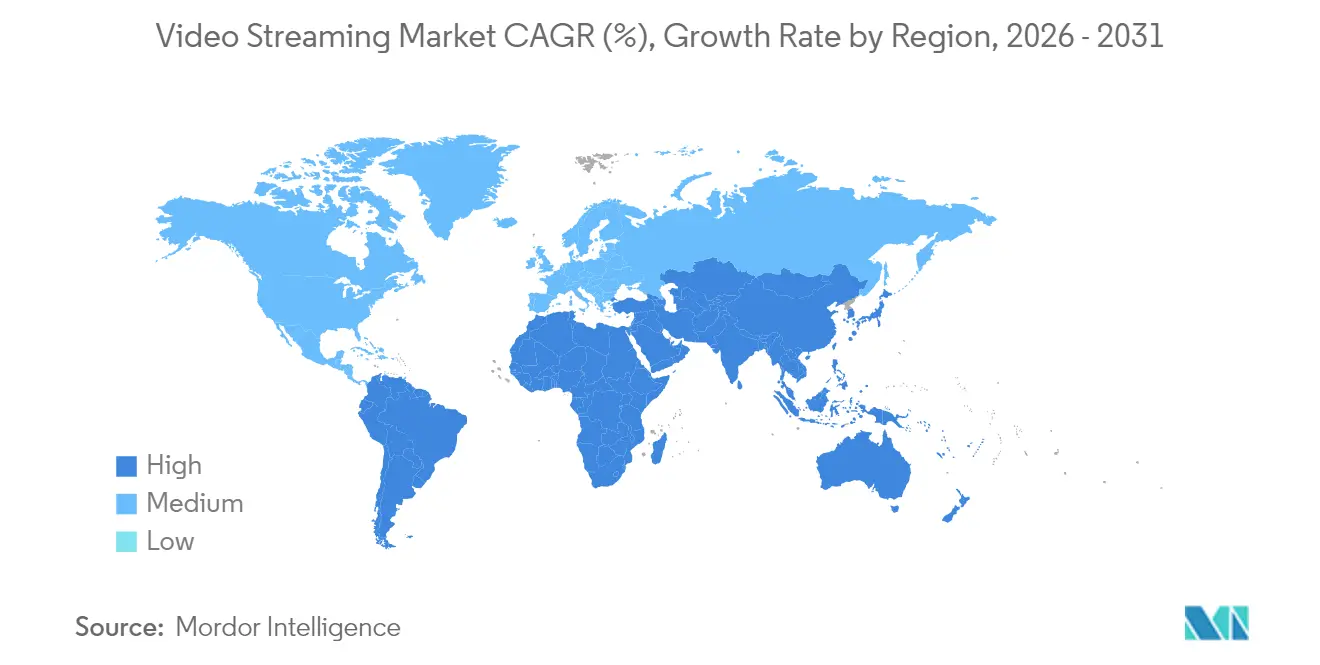
| Fastest Growing Market | Asia Pacific |
| Largest Market | North America |
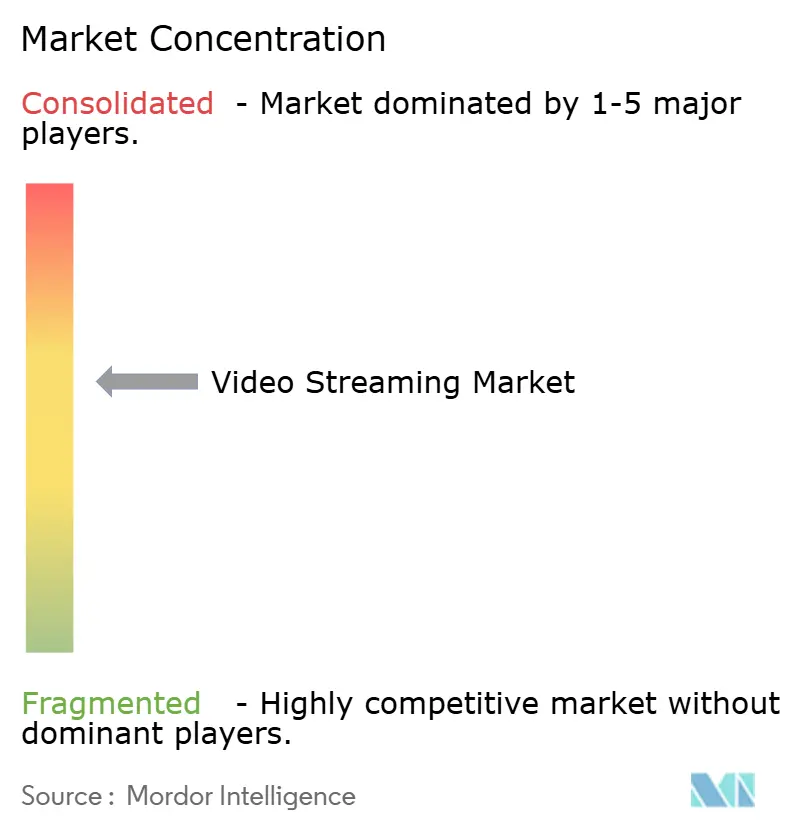
| Market Concentration | Medium |
Major Players *Disclaimer: Major Players sorted in no particular order Image © Mordor Intelligence. Reuse requires attribution under CC BY 4.0. | |
Video Streaming Market Analysis by Mordor Intelligence
video streaming market size in 2026 is estimated at USD 212.83 billion, growing from 2025 value of USD 192.0 billion with 2031 projections showing USD 356.2 billion, growing at 10.85% CAGR over 2026-2031. Growth has been fuelled by the rapid extension of high-speed broadband and 5G, the deployment of AI-driven recommendation engines that lift viewer engagement, and the direct-to-consumer push by studios that once relied on third-party distributors. Competitive intensity deepened as leading platforms raised content budgets yet sought efficiency from cloud-native workflows, while smaller services looked to niche programming and aggregation partnerships. Live sports rights, multilingual libraries, and low-latency delivery emerged as decisive differentiators, especially in regions where first-time streamers skipped legacy television. Regulatory attention on carbon emissions and piracy raised operating complexity, but innovations such as AI-assisted dubbing and 5G multicast pointed to fresh monetization paths that will keep the video streaming market on a solid expansion track.
Key Report Takeaways
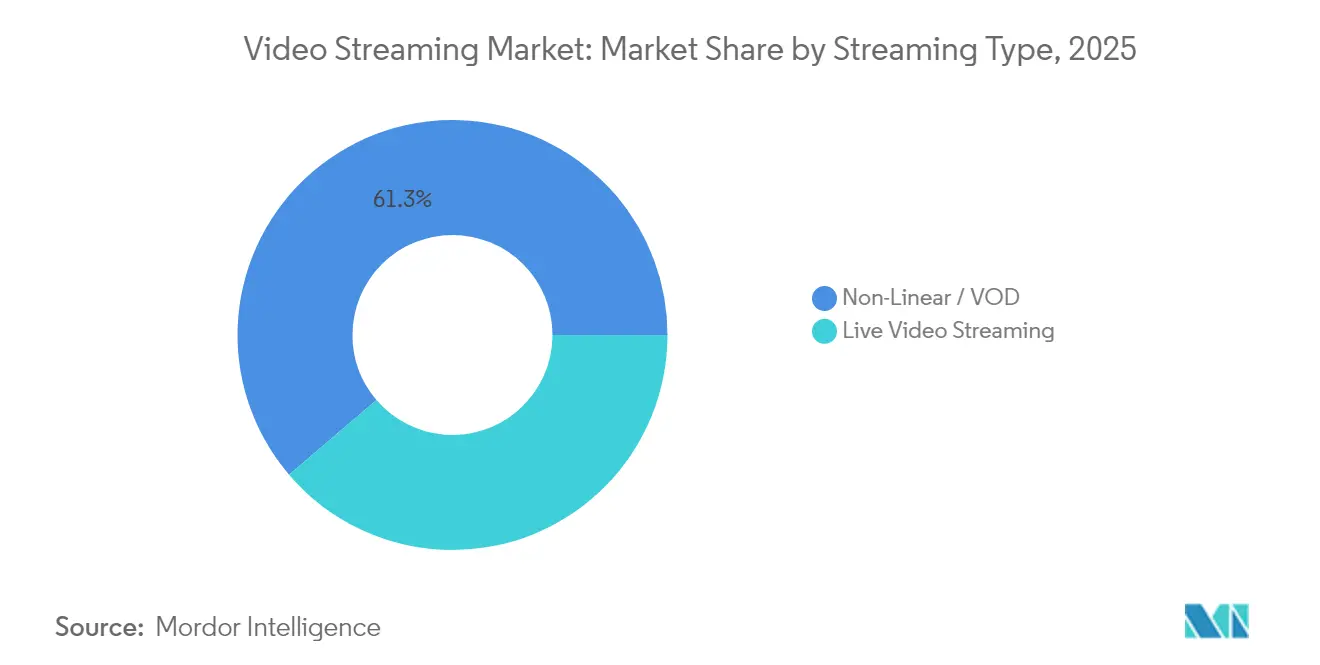
- By streaming type, Non-Linear/VOD commanded 61.25% of the video streaming market share in 2025; live streaming is projected to expand at a 14.4% CAGR through 2031.
- By component, software led with 59.15% revenue share in 2025, whereas services are poised to advance at a 16.1% CAGR between 2026 and 2031.
- By solutions, OTT platforms held 56.20% of revenue in 2025, while IPTV is forecast to grow at 13.1% CAGR during 2026-2031.
- By platform, smartphones and tablets captured 43.85% of revenue in 2025; smart TVs are set to increase at a 11.9% CAGR through 2031.
- By revenue model, SVOD dominated with 69.20% share in 2025, as the AVOD/FAST model records the fastest growth at 14.7% CAGR.
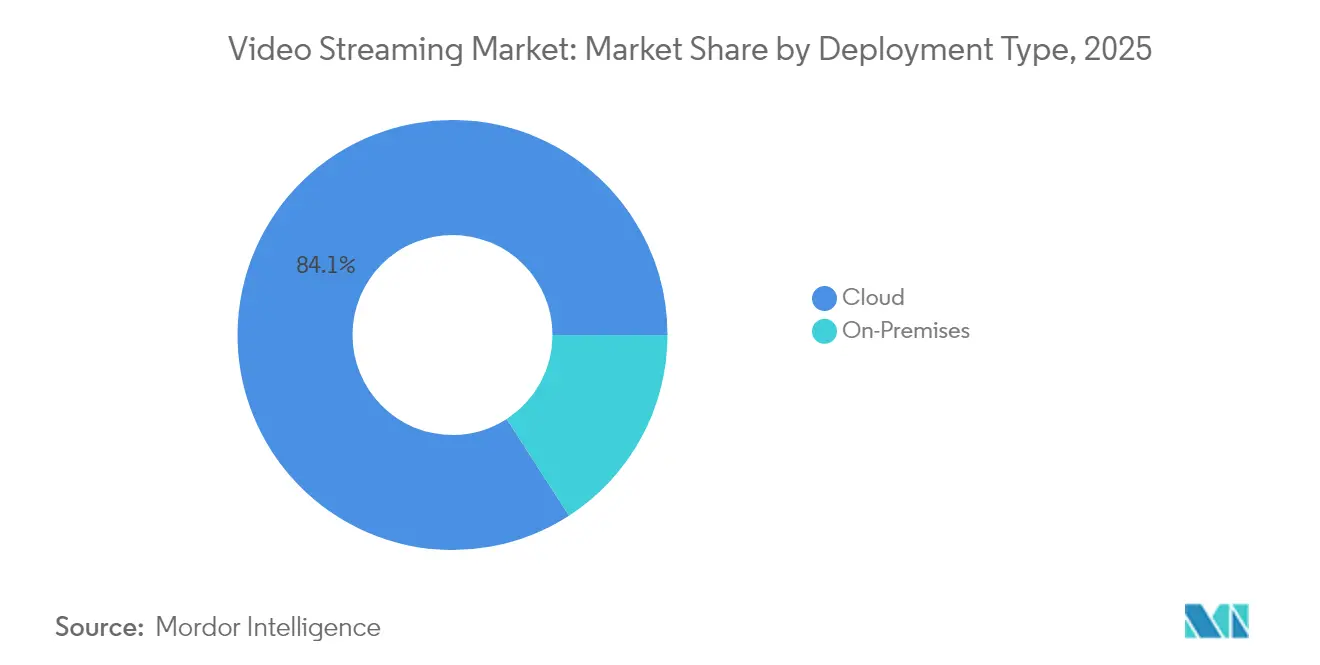
- By deployment, cloud delivery accounted for 84.12% of revenue in 2025 and is expected to rise at an 17.7% CAGR.
- By end user, consumer services produced 75.75% of 2025 revenue, while enterprise streaming grows at a 12.5% CAGR.
- By geography, North America led with 41.85% share in 2025, yet Asia-Pacific delivers the highest regional CAGR at 16.8% through 2031.
Note: Market size and forecast figures in this report are generated using Mordor Intelligence’s proprietary estimation framework, updated with the latest available data and insights as of 2026.
Global Video Streaming Market Trends and Insights
Drivers Impact Analysis*
| Driver | (~) % Impact on CAGR Forecast | Geographic Relevance | Impact Timeline |
|---|---|---|---|
| High-speed internet penetration | +4.4% | Global with pronounced effect in emerging Asia-Pacific | Medium term (2-4 years) |
| Live sports and event streaming popularity | +2.8% | North America and Europe, rising in Asia-Pacific | Short term (≤ 2 years) |
| Smart-TV and OTT device proliferation | +2.2% | Global, peak penetration in North America and Western Europe | Medium term (2-4 years) |
| AI-powered localized dubbing | +1.7% | Asia-Pacific, Latin America, Middle East and Africa | Medium term (2-4 years) |
| Telco zero-rating for OTT data | +1.1% | India, Indonesia, Nigeria, South Africa, Brazil | Medium term (2-4 years) |
| 5G multicast for in-stadium feeds | +0.8% | United States, Europe, South Korea, Japan | Long term (≥ 4 years) |
| Source: Mordor Intelligence | |||
Growing Availability of High-Speed Internet Connectivity
The rollout of fiber and 5G radically raised the ceiling for bit-rate-intensive services and set a stronger baseline for the video streaming market. By 2025 more than 2.8 billion 5G subscriptions were in service, and fixed-wireless access added several hundred thousand households each quarter in the United States [1]Broadband Search, “5G Home Internet Statistics: Adoption, Trends, and Coverage,” broadbandsearch.net. Operators in India and Indonesia introduced low-cost 5G data packs that prioritized major streaming apps, pulling first-time viewers directly into premium content ecosystems. In parallel, campus-wide Wi-Fi 6 upgrades in Latin America lifted sustained 4 K throughput, enabling local broadcasters to launch companion streaming services that met studio security requirements. Cloud platforms recorded double-digit traffic spikes with every regional speed upgrade, confirming that bandwidth remains the primary flywheel for subscription and advertising revenue expansion.
Rising Popularity of Live Sports and Event Streaming
Live sports migrated quickly from cable to online in 2025 as top leagues sold digital-first packages. A Hub study showed that 69% of fans viewed matches on streaming services, edging out linear broadcast for the first time. Rights deals with the NFL, NBA, La Liga, and IPL translated into nightly surges in concurrent streams, pressuring networks to refine low-latency paths and real-time ad stitching. Younger viewers under 35 drove nearly half of all new sports subscriptions, validating aggressive bids by platforms that pair live feeds with interactive stats overlays. Advertisers followed, shifting brand budgets toward mid-roll and dynamic banner formats embedded in live streams, thus boosting CPMs relative to general entertainment content.
Proliferation of Smart-TVs and Connected OTT Devices
Smart-TV shipments crossed a cumulative threshold where two-thirds of household televisions handled native 4 K playback by 2023, and HEVC decoding reached universal support in 2025. Device makers pre-installed major apps and simplified onboarding via single-sign-on, removing the friction once associated with HDMI dongles. Samsung and LG integrated voice discovery, and Roku OS introduced cross-service watch-lists that surfaced live events along with on-demand titles. This living-room shift motivated publishers to encode premium catalogues in HDR and spatial audio, actions that raised average play times and kept the video streaming market on a steady up-trend.
AI-Driven Localized Dubbing Unlocking Non-English Audiences
Advances in automated speech recognition and neural text-to-speech created near-real-time dubbing workflows that preserved actor cadence while swapping languages. Amazon piloted English-to-Latin American Spanish translation across select originals on Prime Video in early 2025. Independent solution providers soon offered 30-language packs that compressed weeks of studio work into cloud minutes, making smaller regional titles viable for global release. Engagement metrics validated the investment: localized content recorded up to six-fold increases in completion rates compared with subtitled versions, which reinforced the strategic importance of localization for subscriber and advertiser growth in the video streaming market.
Restraints Impact Analysis*
| Restraint | (~) % Impact on CAGR Forecast | Geographic Relevance | Impact Timeline |
|---|---|---|---|
| Content piracy and unauthorized distribution | -2.2% | Highest in Asia-Pacific and Latin America | Medium term (2-4 years) |
| Escalating content licensing costs | -1.7% | Global with peak pressure in North America | Short term (≤ 2 years) |
| Carbon-footprint scrutiny | -0.9% | Europe and North America | Long term (≥ 4 years) |
| Codec-standard fragmentation | -0.7% | Device-specific across global markets | Medium term (2-4 years) |
| Source: Mordor Intelligence | |||
Content Piracy and Unauthorized Distribution
Illicit restreaming siphoned revenue even as enforcement improved. The Asia Video Industry Report for 2024 documented new blocking statutes in India, Malaysia, and Vietnam that targeted pirate IPTV boxes. [2]Asia Video Industry Association, “The Asia Video Industry Report 2024,” avia.org Sports pay-per-view content remained the most pirated category, prompting rightsholders to embed forensic watermarking that traces each account. While technical counter-measures reduced casual piracy, the perpetual game of domain takedown versus mirror site re-appearance meant that smaller services without robust legal teams continued to lose prospective subscribers, cutting into the aggregate video streaming market growth potential.
Escalating Content Licensing and Production Costs
Global bidding wars for marquee franchises lifted scripted series budgets and live sports rights fees. Disney+ publicised plans to raise its original content investment by 83% to USD 7.7 billion by 2027, and Amazon projected a 70% rise to USD 6.46 billion. Smaller streamers faced an impossible calculus between niche differentiation and financial discipline. Studios shifted toward shorter seasons and unified production pipelines to ease cost pressure, yet overall expense lines stayed high, dampening margin expansion and forcing a sharper focus on monetization innovation.
*Our forecasts treat driver/restraint impacts as directional, not additive. The impact forecasts reflect baseline growth, mix effects, and variable interactions.
Segment Analysis
By Streaming Type: Live Streaming Gains Momentum
Live streaming posted the fastest trajectory, rising at a 14.4% CAGR from 2026 to 2031 as leagues and concert promoters chose direct distribution. The video streaming market size for live formats stood at USD 74420.6 million in 2025 and is expected to surpass USD 169.3 billion by 2031, indicating a dramatic scaling curve. Non-linear/VOD retained dominance due to its 61.25% share in 2025, backed by expansive libraries and robust recommendation engines that propelled over 80% of total plays on major services.
Live sports coverage turned streaming platforms into primary destinations during key tournaments, narrowing the perception gap between cable reliability and online flexibility. Real-time engagement tools such as alternate commentary tracks and in-app merch links unlocked fresh revenue streams and extended session duration. Meanwhile, on-demand services continued to refine compression and pre-fetching strategies that balanced cost efficiency with sharper picture quality, reinforcing their foundational role inside the broader video streaming market.


By Component: Services Segment Accelerates
Software components-players, CMS, analytics layers-accounted for 59.15% of 2025 revenue. However, managed services such as multi-CDN orchestration and server-side ad insertion registered a 16.1% CAGR forecast as publishers outsourced highly specialized delivery tasks. Edge-aware traffic steering ensured low latency during peak global events, which safeguarded the video streaming market size advantages secured by early software adoption.
The surge in services aligned with ad-supported tier expansion because SSAI blended personalized ads into live streams without overt buffering. Providers like Akamai handled traffic bursts that peaked at more than 200 Tbps in 2024, demonstrating infrastructure reliance on third-party expertise. As compliance and accessibility rules tightened, turnkey captioning and DRM services attracted mid-tier platforms keen to manage risk while staying focused on storytelling.
By Solutions: OTT Dominates While IPTV Resurges
OTT retained a 56.20% grip on revenue in 2025 thanks to its device-agnostic reach and direct billing. Continuous feature rollouts-from personalized profiles to watch-party modes-raised stickiness among households already juggling multiple subscriptions. IPTV rebounded with a 13.1% CAGR after telcos refreshed fiber-to-the-home bundles that guaranteed symmetric bandwidth and bundled local language packs, thereby adding stability to the evolving video streaming market.
Hybrid business models emerged as operators integrated OTT apps into set-top boxes, ensuring single-remote access that appealed to less tech-savvy viewers. Advanced multicast pushed ultra-HD linear channels efficiently, and AI-enhanced EPGs exposed hidden catalog gems. Cable and satellite incumbents leveraged existing sports contracts to package optional 4K streams, delaying but not preventing a long-term share drift toward full IP delivery.
By Platform: Smart TVs Accelerate as Mobile Leads
Smartphones and tablets held 43.85% of 2025 revenue and stayed indispensable for commuters and mobile-first viewers in India, Nigeria, and Brazil. Screen size constraints encouraged episodic storytelling, which integrated seamlessly with vertical ad formats. Smart TVs, projected to grow 11.9% CAGR, gained ground as manufacturers baked streaming hubs into launch menus.
Automatic content recognition supplied granular view data, helping advertisers recalibrate campaign frequency. Voice assistants simplified discovery, and cross-platform resume points ensured that viewers who started a series on mobile shifted to the living room with zero friction. This symmetric hand-off reinforced ecosystem lock-in and underpinned the expanding video streaming market.
By Revenue Model: Advertising Growth Challenges Subscription Dominance
SVOD dominated with a 69.20% share in 2025, and the video streaming market size linked to paying memberships still exceeded advertising revenue. Yet AVOD and FAST channels advanced 14.7% CAGR as budget-conscious viewers traded premium tiers for lightly interrupted versions. Netflix said that more than half of the new U.S. sign-ups landed on its ad-supported plan, showing price elasticity at work.
Brands welcomed rich targeting across demographic and behavioral segments. Amazon reported that its ad reach climbed to 130 million monthly U.S. viewers in 2025. CPM inflation moderated because dynamic insertion optimized inventory. Transactional rentals remained relevant for early-window releases and niche sports, though their aggregate contribution continued to shrink.
By Deployment Type: Cloud Dominates with Edge Computing Boost
Cloud deployments captured 84.12% of 2025 revenue and are tracking an 17.7% CAGR as workflows migrate to containerized micro-services that scale per-event. The video streaming market benefits from pay-as-you-go encoding farms and nearline archive tiers that lower total cost of ownership. Edge compute nodes brought processing closer to fans, shaving start-up delay for live 4 K events during the 2024 football season.
AWS reported that sports video workloads quadrupled minutes streamed between 2021 and 2024, validating elastic architecture. On-premises infrastructure persisted in financial services and defense sectors that mandated sovereign data paths, but their relative share contracted as public cloud certifications addressed compliance hurdles.
By End User: Enterprise Segment Shows Strong Growth
Consumer services still made up 75.75% of 2025 revenue, yet enterprise use cases such as virtual town halls, investor days, and training sessions posted a 12.5% CAGR outlook. Internal events benefited from SAML-based access control, ensuring that confidential pitches remained behind corporate firewalls while leveraging the same adaptive-bitrate stacks honed in entertainment.
Enterprises applied advanced analytics to measure engagement down to slide interactions, enabling HR teams to refine onboarding sequences. Brand marketing departments used streamed product launches to reach global audiences in synchronized time zones, trimming travel budgets. These factors jointly sustained a healthy expansion vector inside the diversified video streaming market.
Geography Analysis
North America held 41.85% of global revenue in 2025 as ubiquitous broadband, aggressive original content budgets, and early adoption of advertising hybrids converged. The United States alone is projected to lift streaming revenue from USD 112 billion in 2024 to USD 140 billion by 2029, reinforcing its anchor role in the video streaming market. Competitive churn remained high because households stacked an average of five paid services, prompting platforms to rotate discount bundles and theater-to-stream windows to keep churn below 3% monthly. Canada mirrored these patterns, although regional broadcasters preserved local sports rights that sheltered nationalist viewer preferences.
Asia-Pacific delivered the fastest regional CAGR at 16.8% and is forecast to add USD 16.2 billion in incremental revenue by 2029. India contributed more than one-quarter of the uplift, fueled by discounted mobile data plans and exclusive cricket streaming, while China leaned on state-owned telcos to accelerate FTTH. Japan blended anime with high-budget serials to maintain ARPU leadership. Local platforms such as JioCinema forged low-price tiers paired with daily payment options, a model now copied in Southeast Asia. The video streaming market size gained additional momentum from user generated short-form clips that acted as funnels into premium long-form libraries.
Europe retained solid traction, and the United Kingdom is set to become the continent’s largest entertainment market by 2027 as ad-supported tiers find an addressable audience in cost-sensitive households. Thirty-three percent of new UK sign-ups in Q1 2025 selected an ad tier, and Prime Video captured 17% of those activations. Markets such as Germany tightened CO₂ disclosure rules for datacenters, prompting greener codec strategies, while France advanced local content quotas that shaped catalog acquisition plans.
Latin America and the Middle East and Africa registered lower absolute revenue but posted healthy double-digit user growth as smart-phone penetration and mobile broadband upgrades reached critical mass. SVOD growth encouraged Wi-Fi 6 adoption across the region, which in turn improved average streaming bit-rates. Nigeria’s telcos trialed zero-rated educational channels that steered incremental demand toward commercial entertainment, illustrating mutual benefits between operators and OTT providers in the continually widening video streaming market.

Competitive Landscape
Market concentration remained moderate, with the top five services capturing more than 50% of global revenue. Netflix led the field at 282 million paid subscribers by Q3 2024, and its revenue climbed 15% year on year to USD 9.8 billion in that quarter. Prime Video followed with 117 million viewers and combined retail-plus-streaming benefits that kept monthly churn among Prime members under 1%. Disney+ reached 158.6 million subscribers after an ad tier rollout and a global price reset in late 2024. Hulu, Max, and Apple TV+ rounded out the top cohort, each leaning on differentiated content pillars.
Strategic moves focused on monetization diversification. Netflix expanded its paid-sharing program beyond 100 countries, generating incremental ARPU without new content cost. Amazon introduced dynamically generated ad creatives that matched product carousels to viewer shopping profiles, integrating commerce directly into playback. Disney merged ESPN+ technology with mainline Disney+ infrastructure to support live events and cross-promotional bundles that lowered acquisition cost by one-third.
Technology differentiation remained central. Netflix open-sourced a new AV1-to-HEVC ladder optimizer that trimmed encoding minutes by 18%, while Prime Video accelerated its AI dubbing pilot to cover German, Hindi, and Japanese after a successful Spanish test. HBO Max switched to a multi-CDN mesh that shaved 25% of re-buffering during peak premieres, underscoring operational performance as a loyalty driver in the global video streaming market.
Video Streaming Industry Leaders
Netflix Inc.
Amazon.com Inc. (Prime Video)
Alphabet Inc. (YouTube)
The Walt Disney Company (Disney+, Hulu)
Tencent Holdings Ltd. (Tencent Video)
- *Disclaimer: Major Players sorted in no particular order

Recent Industry Developments
- May 2025: Amazon confirmed that its U.S. ad-supported reach climbed to 130 million monthly viewers.
- April 2025: UniqCast stressed exclusive content as the strongest OTT growth lever, aided by AI discovery features.
- April 2025: Ericsson added multimedia patents to the Avanci video pool, simplifying codec licensing for publishers.
- March 2025: Amazon began AI dubbing trials on Prime Video, expanding multilingual accessibility.
- March 2025: Disney+ and Netflix ramped sports slates, triggering a surge in live streaming sign-ups.


Research Methodology Framework and Report Scope
Market Definitions and Key Coverage
Our study defines the global video-streaming market as all paid or ad-supported services that deliver live or on-demand professional video content over the public internet to consumer and enterprise screens, capturing subscription, advertising, and transactional revenues.
Scope exclusion: hardware sales, purely audio platforms, and user-generated short-form social videos are not counted.
Segmentation Overview
- By Streaming Type
- Live Video Streaming
- Non-Linear / VOD Streaming
- By Component
- Software
- Services
- By Solutions
- Over-the-Top (OTT)
- Internet Protocol TV (IPTV)
- Cable TV
- Pay-TV
- By Platform
- Smartphones and Tablets
- Smart TV
- Laptops and Desktops
- Gaming Consoles
- By Revenue Model
- Subscription (SVOD)
- Advertising (AVOD/FAST)
- Rental / Transactional (TVOD)
- By Deployment Type
- Cloud
- On-Premises
- By End User
- Consumer
- Enterprise
- By Geography
- North America
- United States
- Canada
- Mexico
- South America
- Brazil
- Argentina
- Rest of South America
- Europe
- United Kingdom
- Germany
- France
- Italy
- Spain
- Russia
- Rest of Europe
- Asia-Pacific
- China
- India
- Japan
- South Korea
- Australia and New Zealand
- Rest of Asia-Pacific
- Middle East and Africa
- Middle East
- GCC Countries (Saudi Arabia, UAE, Qatar)
- Turkey
- Rest of Middle East
- Africa
- South Africa
- Nigeria
- Rest of Africa
- Middle East
- North America
Detailed Research Methodology and Data Validation
Primary Research
Mordor analysts interviewed streaming engineers, media buyers, telecom carriers, and content licensors across North America, Europe, Asia-Pacific, and the Middle East. These conversations clarified average revenue per user, fill-rate shifts for ad-supported tiers, and likely rollout timing of new compression standards, which in turn filled gaps spotted during secondary work and anchored the forecast drivers.
Desk Research
We began with sector statistics from organizations such as the International Telecommunication Union for broadband penetration, the Motion Picture Association for professional content output, and the European Audiovisual Observatory for regional revenue splits. Trade filings, listed-company 10-Ks, and investor decks supplied service-level pricing and subscriber clues, while news archives on Dow Jones Factiva and device shipment logs from IDC helped us verify platform growth patterns. Additional signals were drawn from public customs databases, advertising-spend trackers, and patent data on Questel to map codec adoption trends. This list is illustrative; many other sources informed data collection, cross-checks, and assumption testing.
Market-Sizing & Forecasting
A top-down and bottom-up build was applied. We first reconstructed total paid video spend and advertising outlays by mapping broadband households, smartphone counts, and average video hours watched, then layered penetration-rate based demand pools to allocate value across revenue models. Supplier roll-ups of sampled average selling price times active subscriptions were used as a reasonableness check. Key variables include paid subscriber base, monthly churn, connected-TV ad-load minutes, global broadband speed indices, and content-spend inflation; each was forecast through multivariate regression blended with scenario analysis where regulatory shifts or sports-rights cycles could swing outcomes. Data gaps in smaller regions were bridged through benchmark ratios against peer markets with similar GDP per capita and connectivity.
Data Validation & Update Cycle
Outputs pass three rounds of analyst review, variance screens against independent indicators, and automated anomaly alerts. Reports refresh every twelve months, with mid-cycle updates triggered by material events such as major rights auctions or taxation changes; a last-mile sense check is completed before release to ensure clients receive the most current view.
Why Mordor's Video Streaming Baseline Commands Superior Decision Confidence
Published estimates often diverge because firms pick different revenue buckets, regional splits, and currency bases. Our disciplined scope, annual refresh cadence, and variable-level audits keep the baseline steady yet timely.
Key gap drivers include whether advertising on user-generated platforms is counted, how bundled mobile-data plans are treated, and the aggressiveness of assumed price escalation. Some publishers build primarily from platform filings, while others inflate totals by including game streaming or ancillary e-commerce. Mordor triangulates both spend and audience metrics, which tempers extremes and offers planners a dependable midpoint.
Benchmark comparison
| Market Size | Anonymized source | Primary gap driver |
|---|---|---|
| USD 192 B (2025) | Mordor Intelligence | - |
| USD 157 B (2025) | Global Consultancy A | Excludes ad-supported tiers and emerging markets |
| USD 226 B (2025) | Industry Publisher B | Adds game-streaming and social UGC revenues |
| USD 104 B (2024) | Regional Consultancy C | Counts only subscription fees, omits advertising |
In sum, Mordor Intelligence delivers a balanced, transparent baseline built on clearly traced variables and repeatable steps, giving decision-makers confidence that the figures reflect today's market reality while remaining sensitive to tomorrow's shifts.


Key Questions Answered in the Report
What is the current value of the video streaming market?
The video streaming market reached USD 212.83 billion in 2026 and is forecast to climb to USD 356.2 billion by 2031.
Which region is expanding the fastest in streaming revenue?
Asia-Pacific is projected to grow at a 16.8% CAGR through 2031, driven by mobile broadband expansion and localized content strategies.
How important is advertising to future streaming revenue?
Advertising-led models such as AVOD and FAST are on a 14.7% CAGR path and are expected to command 27.85% of global streaming revenue by 2028.
What role does 5G play in streaming quality?
5G and edge compute reduce latency and support reliable 4 K live streams, with more than 2.8 billion 5G subscriptions anticipated in 2025.
Which platform segment is gaining ground most rapidly?
Smart TVs are registering a 11.9% CAGR as native apps, voice search, and HDR playback persuade households to shift long-form viewing back to the largest screen.
Why are enterprises adopting streaming solutions?
Businesses use secure live and on-demand video for internal communication and training, helping the enterprise segment post a 12.5% CAGR through 2031.
Page last updated on:


