
Market Overview
| Study Period | 2021 - 2031 |
|---|---|
| Forecast Data Period | 2026 - 2031 |
| Base Year Market Size (2025) | USD 3.43 Billion |
| Market Size (2026) | USD 3.54 Billion |
| Market Size (2031) | USD 4.16 Billion |
| Growth Rate (2026 - 2031) | 3.28 % |
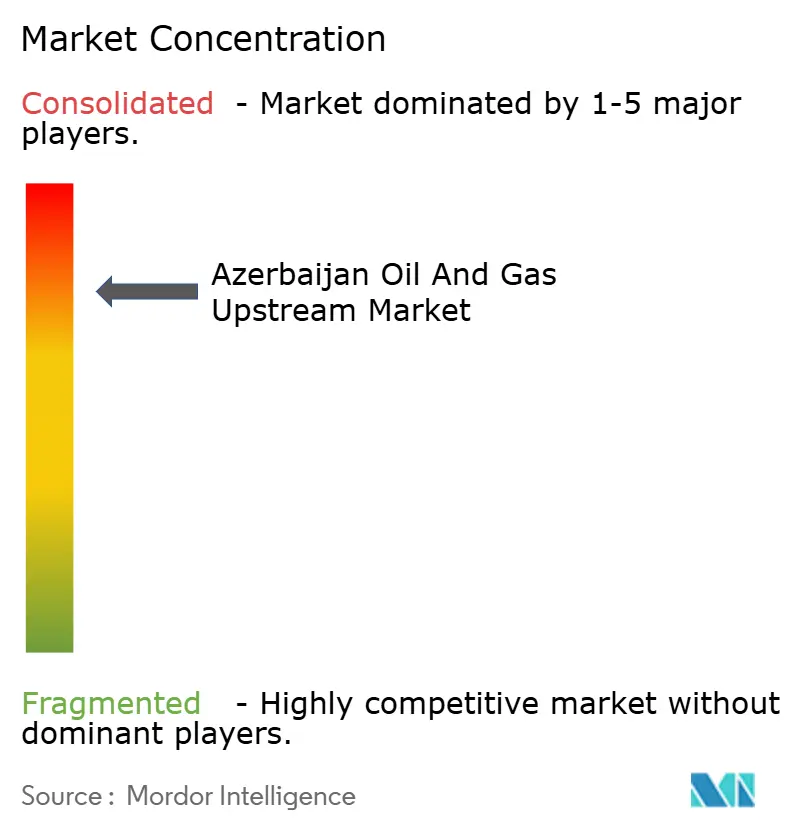
| Market Concentration | High |
Major Players *Disclaimer: Major Players sorted in no particular order Image © Mordor Intelligence. Reuse requires attribution under CC BY 4.0. | |
Azerbaijan Oil And Gas Upstream Market Analysis by Mordor Intelligence
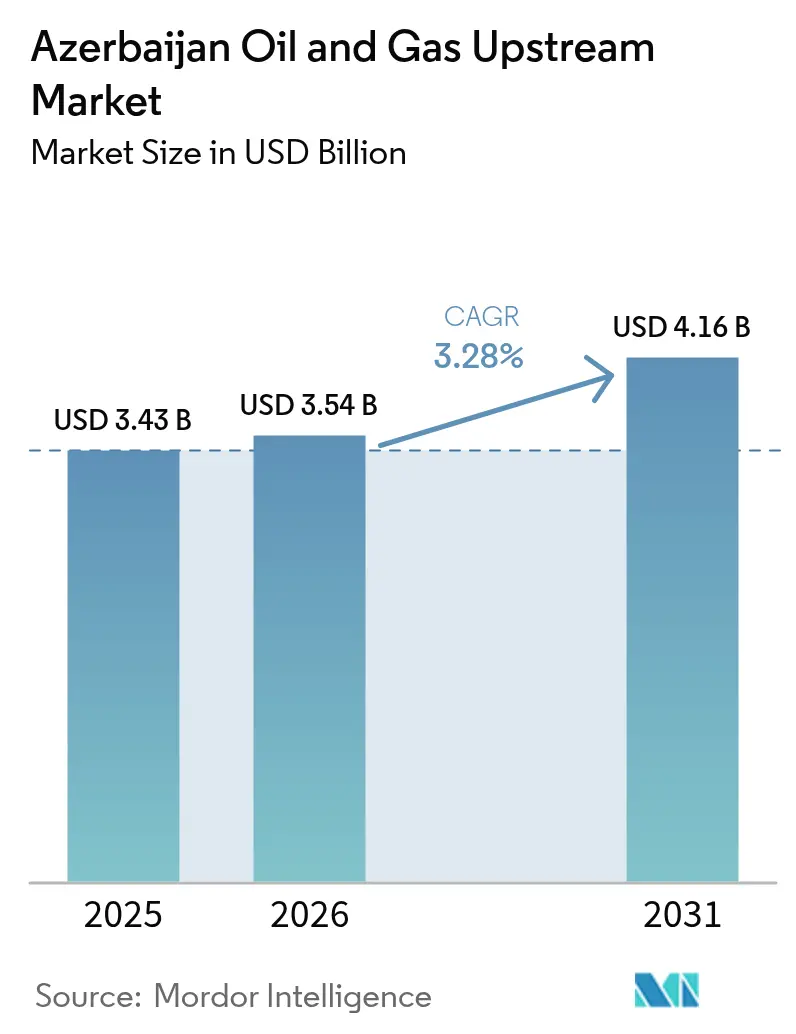
The Azerbaijan Oil And Gas Upstream Market size was valued at USD 3.43 billion in 2025 and estimated to grow from USD 3.54 billion in 2026 to reach USD 4.16 billion by 2031, at a CAGR of 3.28% during the forecast period (2026-2031).
This measured advance reflects the shift from large-scale greenfield buildup toward brownfield optimization, enhanced oil recovery, and gas monetization projects that extract additional value from proven assets. Offshore activity remains the principal growth engine because shallow-water geology lowers development risk and because pipeline links to European end-users ensure reliable offtake even when global prices fluctuate. Operators are prioritizing digital-oilfield programs that cut operating costs by 10 to 15%, while a series of production-sharing agreements continues to anchor foreign direct investment. Azerbaijan’s non-OPEC status, geopolitical détente, and zero-export-duty regime collectively strengthen the commercial resilience of the Azerbaijan oil and gas upstream market, despite capital-allocation headwinds within global integrated majors.
Key Report Takeaways
- By location of deployment, offshore operations captured 71.25% of the Azerbaijan oil and gas upstream market share in 2025 and are projected to grow at a 3.72% CAGR through 2031.
- Natural gas is projected to post the fastest resource-type expansion, registering a 4.55% CAGR through 2031 on the back of EU commitments to double import volumes.
- Conventional wells accounted for 93.55% of the 2025 revenue base and are still advancing at a 4.39% CAGR thanks to advanced completion and real-time reservoir-monitoring programs.
- By service, the development and production segment accounted for 61.55% of 2025 spending, whereas decommissioning services showed the highest forward CAGR at 4.18%, as operators budget for platform retirement.
Note: Market size and forecast figures in this report are generated using Mordor Intelligence’s proprietary estimation framework, updated with the latest available data and insights as of 2026.
Azerbaijan Oil And Gas Upstream Market Trends and Insights
Drivers Impact Analysis*
| Driver | (~) % Impact on CAGR Forecast | Geographic Relevance | Impact Timeline |
|---|---|---|---|
| Maturing flagship ACG field triggers brownfield EOR investments | +0.8% | Azerbaijan offshore, Caspian Sea region | Medium term (2-4 years) |
| Stabilising Brent > USD 70 boosts operator FIDs | +0.6% | Global, with direct impact on Azerbaijan upstream | Short term (≤ 2 years) |
| Attractive PSA-style fiscal terms and zero-export-duty regime | +0.5% | Azerbaijan national, spillover to regional Caspian | Long term (≥ 4 years) |
| EU's energy-security pivot towards Caspian supply | +0.7% | EU-Azerbaijan corridor, Southern Gas Corridor | Medium term (2-4 years) |
| Digital-oilfield pilots cutting opex 10-15% in Shah Deniz | +0.4% | Azerbaijan offshore, applicable to regional fields | Medium term (2-4 years) |
| Green-finance access for methane-abatement retrofits | +0.3% | Global, with focus on Azerbaijan upstream operations | Long term (≥ 4 years) |
| Source: Mordor Intelligence | |||
Maturing Flagship ACG Field Triggers Brownfield EOR Investments
The Azeri-Chirag-Gunashli complex is now three decades old, yet a USD 370 million 4D seismic program covering 740 km² is opening new optimization avenues that can stretch economic life well beyond the 2049 PSA horizon. BP’s 2024 commissioning of the Azeri Central East (ACE) platform delivered 26,000 barrels per day within its first eight months, outstripping the nameplate estimate. Continuous gas-reinjection, water-flood balancing, and fiber-optic surveillance have already stabilized decline rates and, in some well clusters, have even reversed them. The field’s 591 million-ton cumulative output supplies a vast data library that drives machine-learning models for pattern water flooding and near-wellbore chemical treatments. These initiatives collectively underpin the Azerbaijan oil and gas upstream market by safeguarding its biggest production center.[1]BP plc, “Digital Twin Cuts Operating Costs at Shah Deniz,” BP, bp.com
Stabilising Brent greater than USD 70 boosts operator FIDs
A durable Brent floor above USD 70 per barrel has reopened the investment spigot for Azerbaijan, validating the economics of mature-field infill drilling and non-associated gas tie-backs. Projects such as SOCAR’s Umid-2 development are moving toward a final investment decision, with first production scheduled for 2028. Stable pricing encourages lenders to extend tenors, which in turn lowers the weighted-average cost of capital for complex compression schemes, such as the USD 2.9 billion Shah Deniz Compression Project, now in execution. Producers are channeling capital into assets with established midstream connectivity, rather than speculative wildcats, thereby preserving cash flow resilience in the event of price softening. The Azerbaijan oil and gas upstream market benefits because a higher share of sanctioned barrels converts quickly into export volumes via the Southern Gas Corridor.
Attractive PSA-Style Fiscal Terms and Zero-Export-Duty Regime
Since the 1994 “Contract of the Century,” Azerbaijan’s upstream deals have centered on production-sharing agreements that let investors recoup 100% of costs before profit oil splits apply. The government remains among the most competitive in Eurasia, and the absence of export duties accelerates early cash generation. Arbitration clauses modeled on international norms protect investors against unilateral changes, encouraging BP, MOL Group, and TotalEnergies to deepen equity stakes. Recent amendments covering Qarabagh and the ADUA cluster show the state’s willingness to extend similar incentives to new acreage. These fiscal hallmarks make the Azerbaijan oil and gas upstream market a preferred destination for brownfield and tie-back funding, particularly among operators trimming their global exploration budgets.
EU Energy-Security Pivot Toward Caspian Supply
Brussels pledged in 2022 to double Azerbaijani gas imports to 20 bcm by 2027. The guarantee of incremental offtake de-risks compression add-ons to the Trans-Adriatic Pipeline and underwrites multi-year supply contracts priced at European hubs. Azerbaijan has already exported 25.3 bcm in 2024, leaving clear headroom for growth as Shah Deniz Phase II ramps and new ACG gas layers come onstream. Preferential export volumes also unlock syndicated green-loan structures that reward methane-reduction commitments, lowering the hurdle rate on future gas wells. Consequently, natural gas is emerging as the linchpin of the Azerbaijan oil and gas upstream market, complementing its legacy oil franchise.[2]European Commission, “Joint Statement on Energy Cooperation With Azerbaijan,” ec.europa.eu
Restraints Impact Analysis*
| Restraint | (~) % Impact on CAGR Forecast | Geographic Relevance | Impact Timeline |
|---|---|---|---|
| Rapid reservoir pressure decline in legacy offshore blocks | -0.9% | Azerbaijan offshore, mature Caspian fields | Short term (≤ 2 years) |
| Geopolitical flare-ups around Nagorno-Karabakh corridor | -0.4% | Azerbaijan national, regional transport routes | Medium term (2-4 years) |
| Capital flight to low-carbon portfolios within IOCs | -0.6% | Global, affecting Azerbaijan upstream investments | Long term (≥ 4 years) |
| High-sulphur crude blends incurring widening quality discounts | -0.5% | Global crude markets, Azerbaijan export pricing | Medium term (2-4 years) |
| Source: Mordor Intelligence | |||
Rapid Reservoir Pressure Decline in Legacy Offshore Blocks
Mature horizons within the Balakhany and Fasila formations have slipped below bubble-point pressure in several wells, accelerating water cut and gas-oil-ratio spikes. Operators now inject up to 750 million cubic feet per day of recycled gas just to sustain artificial lift, a costly proposition as compression horsepower ages. Although 4D seismic and downhole fiber optics refine sweep efficiency, physics imposes limits once pore pressures fall too far. Economic half-cycle analyses show that incremental barrels extracted after 2030 carry unit costs 25 to 30% higher than field averages. If commodity prices soften, unplanned shut-ins could emerge, trimming the top line of the Azerbaijan oil and gas upstream market during the next two years.
Geopolitical Flare-Ups Around Nagorno-Karabakh Corridor
The 2023 ceasefire reduced kinetic risk, but pipeline rights-of-way still skim contested areas, requiring round-the-clock surveillance. Insurers price a conflict premium into hull and cargo cover for Caspian trans-shipment, elevating lift-cost breakevens by USD 0.20 to 0.30 per barrel. Even rumors of escalation can freeze letters of credit, delaying cargo liftings and dampening working-capital velocity. Foreign lenders maintain geopolitical covenants that could trigger mandatory prepayments if hostilities reignite. Such vulnerabilities act as a drag on the Azerbaijan oil and gas upstream market, even though day-to-day operations remain undisrupted.
*Our forecasts treat driver/restraint impacts as directional, not additive. The impact forecasts reflect baseline growth, mix effects, and variable interactions.
Segment Analysis
By Location of Deployment: Offshore Dominance Drives Technology Innovation
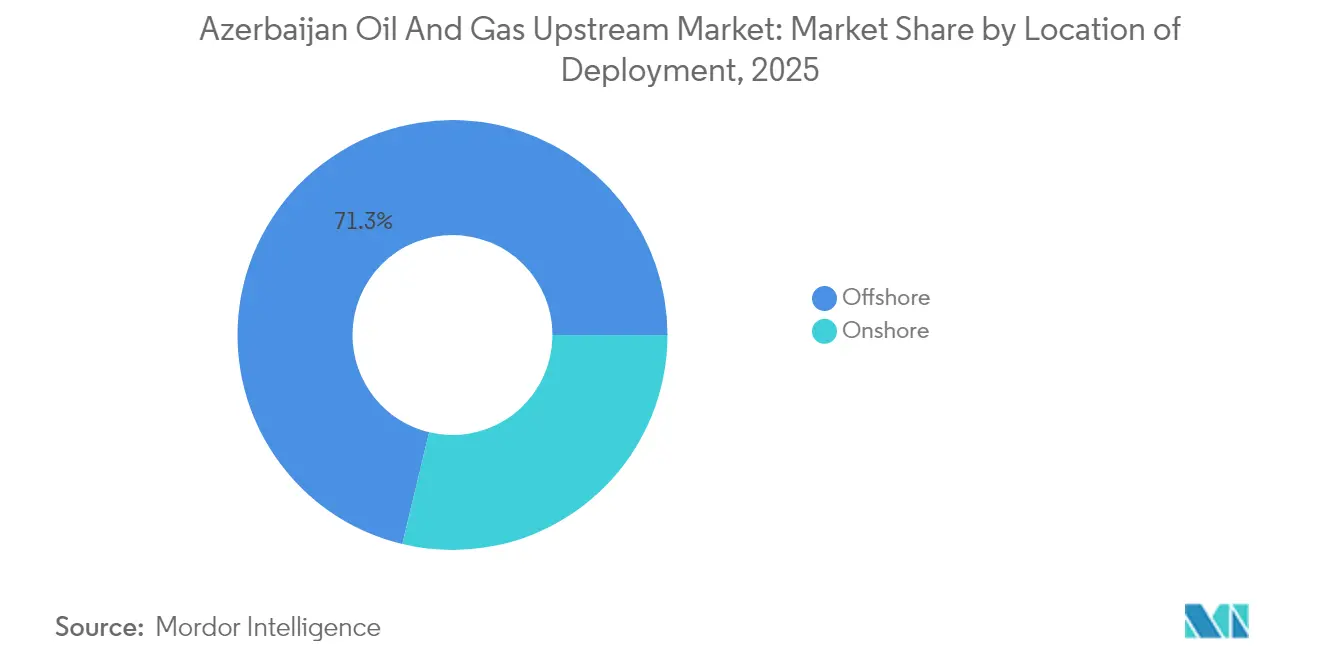
The offshore segment represented 71.25% of the Azerbaijan oil and gas upstream market in 2025, and its 3.72% CAGR keeps it firmly in the lead. BP’s ACE platform reached 26,000 bpd in its first operational year, showcasing an integrated electrification package that lowers emissions intensity. By integrating artificial-intelligence-based choke management, the facility has reduced non-productive time by 12%. Clustered field tie-backs share processing topsides, which keeps lifecycle costs contained for smaller satellites. The Azerbaijan oil and gas upstream market size attributable to offshore projects is forecast to move from USD 2.44 billion in 2025 to roughly USD 3.04 billion by 2031.
Onshore operations, once the birthplace of global oil, now account for the remainder and face infrastructure fatigue. Nevertheless, digital retrofits on mature pump-jack fleets are increasing runtime to 95%, thereby reducing the need for new drilling. Geothermal co-production pilots are also being evaluated to decarbonize steam generation for enhanced oil recovery schemes. The onshore footprint enables workforce cross-training that later migrates to higher-margin offshore assignments, preserving skills inside the Azerbaijan oil and gas upstream industry while amortizing training investments across both environments.



By Resource Type: Natural Gas Emerges as Growth Engine
Crude oil retained a 66.18% revenue contribution in 2025, but natural gas is on a faster 4.55% CAGR path through 2031. Addenda to the ACG PSA unlocked up to 4 tcf of non-associated gas, with initial wells slated to come online in 2025. The Azerbaijan oil and gas upstream market size linked to gas is poised to rise from USD 1.16 billion in 2025 to USD 1.52 billion by 2031, maintaining a balanced portfolio against price fluctuations in crude.
Record 2024 gas exports of 25.3 bcm underscore the logistical advantages of the Southern Gas Corridor. The USD 2.9 billion Shah Deniz Compression Project will add 3 bcm per year of incremental throughput, further diversifying revenue streams. Associated condensate offers a light-sweet blending component that mitigates the sulfur issue noted above. Taken together, the gas pivot helps stabilize cash flow, reinforcing the investment narrative for the Azerbaijan oil and gas upstream market.
By Well Type: Conventional Wells Leverage Proven Technologies
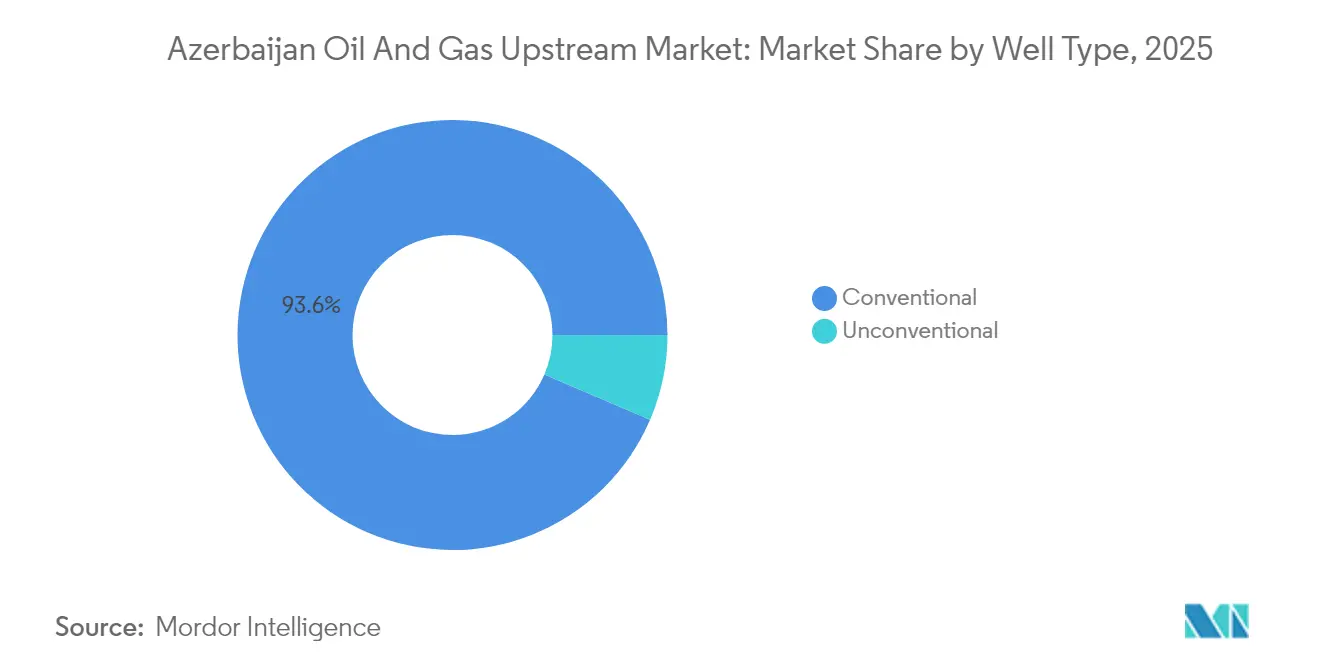
Conventional assets delivered 93.55% of 2025 production and, counterintuitively, remain the fastest growth pocket at a 4.39% CAGR. The Azerbaijan oil and gas upstream market share skewed toward conventional technology underscores the superior risk-adjusted returns of known reservoirs versus untested shale horizons that lack pilot data.
Innovations normally associated with unconventional plays, such as multi-stage fracturing and geo-steered laterals, are being customized for sandstone and carbonate settings in the South Caspian Basin. Real-time downhole sensors feed analytics that optimize drawdown without precipitating sand or water breakthroughs. These enhancements extend plateau periods and postpone expensive sidetracks, preserving capital expenditure (capex) headroom across the Azerbaijan oil and gas upstream market.
By Service: Development and Production Services Lead Market Activity
Development and Production services captured 61.55% of 2025 spending thanks to a stream of infill wells, artificial lift upgrades, and topside debottlenecking. Emerson’s USD 14 million automation contract on ACE integrates high-integrity pressure-protection systems, which reduce unplanned downtime by 7%. Baker Hughes will deliver more than 150 electric-submersible pumps, each incorporating variable-speed drives that raise run life. These projects exemplify how service intensity keeps the Azerbaijan oil and gas upstream market humming even in the absence of new mega-discoveries.
Decommissioning, however, is the fastest-growing service niche, with a 4.18% CAGR, as operators plan for end-of-life obligations. Early engagement of removal specialists allows smoother platform abandonment budgeting and ensures environmental compliance. The budding decommissioning wave is carving out a parallel supply-chain ecosystem that will become increasingly central to the Azerbaijan oil and gas upstream industry in the 2030s.
Geography Analysis
Azerbaijan accounts for the lion’s share of regional hydrocarbon output, underpinned by over USD 200 billion of cumulative foreign investment since 1994. The Azerbaijan oil and gas upstream market size within national borders is projected to exceed USD 4.16 billion by 2031, a result driven by sovereign control of export routes and a supportive fiscal regime. The country’s non-OPEC status affords production management flexibility that other regional peers lack, enabling operators to react promptly to price signals without quota constraints. Its coastal geography provides direct pipeline access to Georgia, Turkey, and onward to the EU, bypassing congested maritime chokepoints.
The Caspian Sea’s shallow-water geology lowers drilling complexity compared with ultra-deepwater plays elsewhere. However, falling sea levels have begun to expose coastal infrastructure to subsidence risks, prompting structural reinforcements on selected piers. Environmental stewardship has thus become integral, with SOCAR rolling out baseline methane-intensity audits across all offshore facilities. Shared export terminals with Turkmen and Kazakh partners now incorporate remote-sensing systems that detect spills, minimizing downtime caused by environmental incidents.
European end-markets remain the bedrock for growth. The Trans-Adriatic Pipeline can scale to 20 bcm per year with compressor upgrades, accommodating rising volumes from Azerbaijan’s expanding gas slate. Turkey’s Igdir-Nakhchivan spur, commissioned in 2024, creates an additional corridor that can funnel surplus gas toward the Eastern Mediterranean. Joint-marketing memoranda with Qatar Energy illustrate the broadening geopolitical canvas, providing Azerbaijan with multiple demand centers and reinforcing the durability of the Azerbaijan oil and gas upstream market.
Regulatory Landscape
Azerbaijan's upstream framework continues to be anchored by production-sharing agreements (PSAs) that have governed major offshore developments since the 1994 "Contract of the Century," alongside a permitting and compliance system administered by state bodies. The Ministry of Energy oversees state policy and issues permits for oil and gas exploration, production, and processing, while the Ministry of Ecology and Natural Resources administers environmental oversight and subsoil-related fees (including prospecting fees and extraction-related charges under the mining tax framework).
A key 2025-2026 policy shift is the overhaul of gas-sector rules through Law No. 233-VIIQ on Gas Supply (enacted 8 July 2025 and effective 1 January 2026). The reform introduces an unbundling pathway and a revised tariff architecture, with Azerbaijan Energy Regulatory Agency (AERA) positioned as the main control body for regulated gas supply enterprises and a tariff framework covering wholesale, transport, storage, distribution, retail, network connection (transport and distribution), and fixed components. While the design is primarily downstream and midstream, the law carries through to upstream commercialisation routes, particularly for non-associated gas developments and sales structures tied to export corridor utilization and domestic network access arrangements.
Competitive Landscape
Market concentration is moderate, with BP, SOCAR, and Chevron's legacy positions still dominant but tempered by the rising presence of MOL Group and ONGC Videsh. BP operates ACG and Shah Deniz, ensuring technology leadership and maintaining a strong supply chain influence. SOCAR holds a 25% stake in most of its flagship PSAs and is gradually internalizing subsurface and project management skills, thereby narrowing the capability gap. The Azerbaijan oil and gas upstream market, therefore, balances international know-how with national interest, creating a mutually reinforcing governance model.
Strategic priorities have pivoted from acreage capture toward efficiency and carbon stewardship. BP signed a memorandum in 2024 to extend its PSA reach into Qarabagh and ADUA, while committing to digital-twin rollouts that reduce methane intensity by 50% by 2030.[5]BP plc, “BP Extends Caspian Portfolio Through Qarabagh Agreement,” BP, bp.com SOCAR's lighthouse digitalization program leverages cloud analytics supplied by Baker Hughes to integrate production, maintenance, and supply-chain dashboards. Competitors differentiate on data science and predictive maintenance, not merely on drilling prowess.
Capital discipline is the new ordering principle. Equity for infrastructure swaps, such as MOL Group's participation in the April 2025 gas block, reflects a strategy of lowering upfront cash calls. The rise of sustainability-linked finance means that future project economics will hinge on greenhouse-gas intensity as much as on lifting cost. These forces collectively shape a corporate landscape in which technological agility and carbon accountability determine who wins in the Azerbaijan oil and gas upstream market.
Azerbaijan Oil And Gas Upstream Industry Leaders
BP PLC
Equinor ASA
SOCAR
TotalEnergies SE
NK Lukoil PAO
- *Disclaimer: Major Players sorted in no particular order

Market Opportunities and Future Outlook
Gas monetisation and low-pressure resource access remain the clearest whitespace for upstream spending, supported by active projects and offtake actions tied to the Southern Gas Corridor. The USD 2.9 billion Shah Deniz Compression project (planned 2025-2029) provides a concrete pull-through program for additional low-pressure gas, complementing Azerbaijan's broader push to sustain export volumes under the EU-Azerbaijan energy cooperation corridor. The record 25.3 bcm of gas exports in 2024 further reinforces the value of infrastructure-linked tie-backs and compression-led debottlenecking that convert existing offshore reservoirs into incremental deliverable volumes.
A second opportunity is extending mature-field life through redevelopment and subsurface data programs, where specific SOCAR-led activity is already shaping demand. SOCAR's launch of a full redevelopment program for the Bahar gas field with SLB points to increased requirements for integrated redevelopment services, including workovers, artificial lift optimization, surveillance, and brownfield project management. On the exploration and new-resource side, SOCAR's exploration agreement with Gran Tierra Energy for onshore acreage, along with movement toward flexible subsea tiebacks for the Karabakh field development concept, suggests a mixed pipeline of near-infrastructure offshore developments and onshore exploration entries. These can be structured to reduce upfront facilities exposure while relying on existing Caspian processing and export systems.
Recent Industry Developments
- July 2026: SOCAR Midstream Operations LLC assumed operatorship of the Baku-Tbilisi-Ceyhan (BTC) oil pipeline from BP. The handover shifted day-to-day operational control of a critical export route to the national operator, strengthening SOCAR's midstream integration and coordination with upstream supply planning.
- June 2026: BP reported first commercial production of non-associated gas from the Azeri-Chirag-Gunashli (ACG) offshore complex. Bringing non-associated gas online broadens ACG's production slate beyond oil and supports late-life value capture as brownfield investment and export-linked gas monetization move to the forefront.
- June 2025: BP agreed to acquire interests in two exploration and development blocks in Azerbaijan's Caspian Sea acreage. The transaction adds new inventory adjacent to established infrastructure and aligns exploration access with lower-cycle-time development options compared with standalone greenfield projects.


Research Methodology Framework and Report Scope
Market Definition and Coverage
This market covers upstream spending and revenues linked to oil and natural gas exploration, development, and production within Azerbaijan, across onshore and offshore activities. The sizing is treated in current USD terms and aligned to the upstream value chain only.
Scope exclusions: Midstream transportation, downstream refining, petrochemicals, and retail fuel distribution are excluded from this market sizing.
Segmentation Overview
- By Location of Deployment
- Onshore
- Offshore
- By Resource Type
- Crude Oil
- Natural Gas
- By Well Type
- Conventional
- Unconventional
- By Service
- Exploration
- Development and Production
- Decommissioning
Data Sources, Market Sizing, and Validation
Desk Research
Desk work started with building a clean fact base on Azerbaijan upstream activity and the oil and gas operating environment. We relied on public sources such as the State Oil Company and energy ministry releases, OPEC and IEA country level balances, BP Statistical Review style datasets, and regulator and customs publications that indicate export flows and production signals.
To translate activity into a value model, we also used company annual reports, investor presentations, and reputable press coverage for project timelines, capex direction, and operating updates. Patent databases and a paid subscription used for company financials and news helped us keep track of technology themes, asset level developments, and changes in contract activity that may not show up quickly in national statistics. These desk sources are illustrative only, and many other references were used for data collection, cross-checks, and clarification.
Primary Interviews and Surveys
We use expert interviews and surveys with operators, oilfield service providers, regulators, and technical or commercial leaders in Azerbaijan. Their feedback helps validate production decline, field spending, drilling plans, service pricing, and project timing. We use these findings to fill gaps in desk data and triangulate the final analysis.
Distribution of primary research fieldwork respondents
| Company type | Respondent position |
|---|---|
| Top tier: 30% | CXOs: 15% |
| Mid tier: 50% | Functional/Unit leaders: 30% |
| Smaller Players: 20% | Managers: 55% |
Market-Sizing & Forecasting
The core model starts from a top-down reconstruction where production and development activity in Azerbaijan is mapped to upstream revenue pools through a small set of transparent drivers. These include liquids and gas production levels, active drilling and well workover intensity, offshore versus onshore project mix, typical development timelines for major fields, and broad cost inflation signals that affect upstream spending.
After that structure is in place, we corroborate the totals with selective bottom-up approximations so the numbers do not drift away from reality. For example, sampled checks were done using activity counts and indicative unit costs, along with limited roll-ups from public financial disclosures and channel feedback where data is available. When a bottom-up view is incomplete, the gap is handled through calibrated scaling based on project phase and location mix, and then validated again through expert feedback.
Forecasts were built using scenario analysis, where near-term project schedules and operational constraints set the base path, and then macro inputs like oil price direction, export capacity utilization, and upstream investment intent adjust the slope. Assumptions that materially move the curve were revisited with primary respondents before the final forecast was locked.
Data Validation & Update Cycle
Model outputs are cross-checked against independent signals like reported production, export indicators, and project milestone updates so obvious variances are caught early. If an input creates a sharp step change that cannot be explained by a field start-up, a shutdown, or a policy shift, the assumption is reworked and, when needed, clarified again through re-contact.
Before sign-off, the model goes through multi-step analyst review, including logic checks on year over year movements and currency consistency. The report is refreshed annually, and interim updates are made when material events occur, after which a final pass is completed close to delivery so clients receive the most current view.
Mordor Intelligence's Azerbaijan Oil and Gas Upstream Market Size Measured Against Other Published Estimates
Published market size numbers for Azerbaijan upstream can look far apart because each publisher uses a different definition of what counts as upstream value, and they also pick different base years and activity proxies. Variations in whether the figure is tied to project spending, broader energy value chain revenues, or a blended view of oil and gas operations usually explains most of the spread.
Downstream refining and petrochemical revenues sit outside Mordor Intelligence's scope for this market, and that single exclusion can materially reduce the stated total versus estimates that mix upstream with later-stage value pools. Differences also come from how offshore development timing is treated, whether cost inflation is applied uniformly, and how quickly assumptions are refreshed when new field milestones or production guidance changes.
Benchmark comparison
| Source | Market Size | Gaps in Research Methodology |
|---|---|---|
| Mordor Intelligence | USD 3.43 B (2025) | |
| Industry Research Publisher A | USD 6.10 B (2023) | Uses a broader upstream narrative that appears to blend in adjacent value pools and mixed activity-to-value mapping, and it also anchors the series to an earlier base year where spending levels can be structurally different. |
| Global Research Publisher B | USD 6.80 B (2026) | Places the reference point in a later year and can be influenced by optimistic project ramp assumptions and higher unit cost inputs, which tends to lift the total when offshore activity is expected to accelerate. |
Looking at the three figures together, the main driver is not the math, it is what is being counted and when it is being counted. By keeping the inputs tied to observable upstream activity signals and then checking them with practitioner feedback, the estimate stays traceable to repeatable steps that can be updated as new production and project information comes in.


Key Questions Answered in the Report
How large is the Azerbaijan oil and gas upstream market in 2026?
The Azerbaijan oil gas upstream market size stands at USD 3.54 billion in 2026 and is forecast to reach USD 4.16 billion by 2031.
Which segment holds the largest share of Azerbaijan production?
Offshore projects captured 71.25% of the Azerbaijan oil gas upstream market share in 2025 due to prolific shallow-water reserves.
What is the main growth driver for Azerbaijan’s gas output?
EU commitments to double Caspian gas imports to 20 bcm per year by 2027 underpin a 4.55% CAGR for natural-gas production.
Why are conventional wells still expanding quickly?
Advanced completions, gas reinjection, and real-time reservoir monitoring allow conventional wells to grow at a 4.39% CAGR despite maturity.
Which services segment is poised for the fastest expansion?
Decommissioning services are projected to grow at 4.18% CAGR as operators budget for end-of-life platform retirement.
Page last updated on:





