
Market Overview
| Study Period | 2021 - 2031 |
|---|---|
| Forecast Data Period | 2026 - 2031 |
| Base Year Market Size (2025) | USD 1.74 Billion |
| Market Size (2026) | USD 1.84 Billion |
| Market Size (2031) | USD 2.57 Billion |
| Growth Rate (2026 - 2031) | 6.87 % |
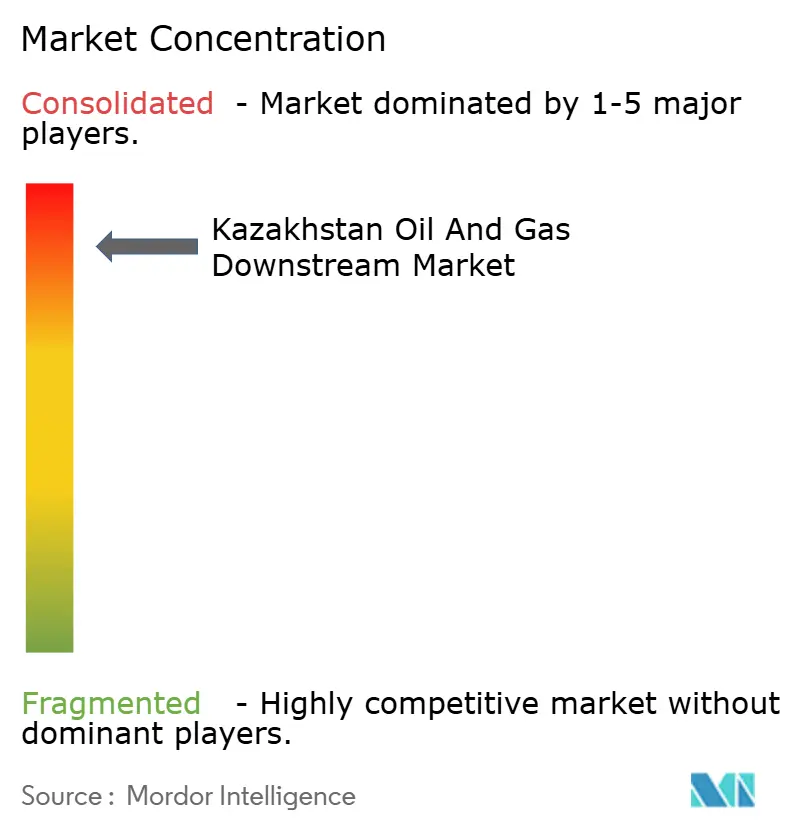
| Market Concentration | High |
Major Players *Disclaimer: Major Players sorted in no particular order Image © Mordor Intelligence. Reuse requires attribution under CC BY 4.0. | |
Kazakhstan Oil And Gas Downstream Market Analysis by Mordor Intelligence
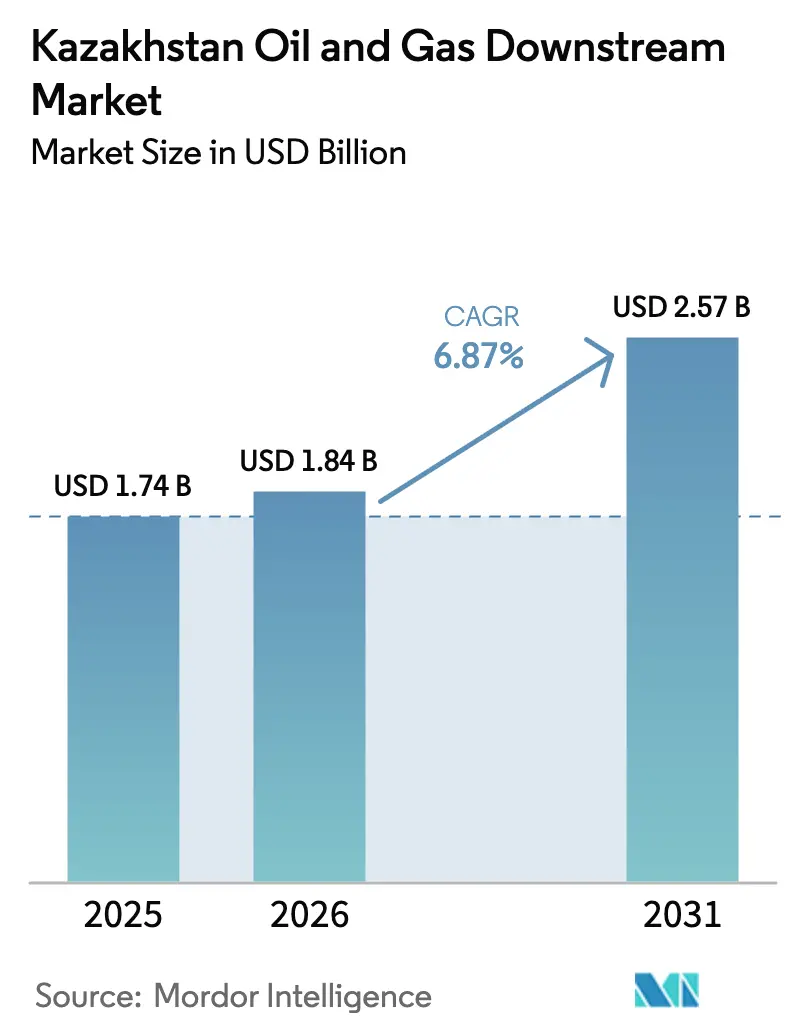
The Kazakhstan Oil And Gas Downstream Market size was valued at USD 1.74 billion in 2025 and is estimated to grow from USD 1.84 billion in 2026 to reach USD 2.57 billion by 2031, at a CAGR of 6.87% during the forecast period (2026-2031).
Capacity additions at Shymkent, Pavlodar, and Atyrau, the USD 7.4 billion Silleno polyethylene complex, and greater reliance on the Kazakhstan-China Pipeline fuel this growth even as CPC disruptions persist. Strong Euro-5 diesel and gasoline uptake, retail network build-outs in underserved oblasts, and an export pivot to China underpin revenue momentum. Rising petrochemical integration improves margin resilience against narrowing crack spreads, while mounting water stress and process-safety talent shortages restrain operating efficiency. Ongoing privatization of 50% stakes in Atyrau and Pavlodar should attract foreign technology partners, diluting state ownership but strengthening governance and energy-efficiency benchmarks.
Key Report Takeaways
- By type, refineries accounted for 70.1% of the Kazakhstan downstream market share in 2025. Petrochemical plants are forecast to deliver the fastest growth, advancing at an 8.9% CAGR to 2031.
- By product type, refined petroleum products secured a dominant 67.5% share of the revenue in 2025, while petrochemicals are set to grow at an impressive 8.7% CAGR, extending through 2031.
- By distribution channel, retail distribution channels captured 40.9% revenue share in 2025 and are projected to expand at a 7.5% CAGR through 2031.
Note: Market size and forecast figures in this report are generated using Mordor Intelligence’s proprietary estimation framework, updated with the latest available data and insights as of January 2026.
Kazakhstan Oil And Gas Downstream Market Trends and Insights
Drivers Impact Analysis*
| Driver | (~) % Impact on CAGR Forecast | Geographic Relevance | Impact Timeline |
|---|---|---|---|
| Government-led refinery modernization | +1.8% | National, with primary gains in Shymkent, Pavlodar, Atyrau | Medium term (2-4 years) |
| Euro-5 fuel demand surge | +1.2% | National, spillover to Central Asia export markets | Short term (≤ 2 years) |
| Strategic export corridor to China & Central Asia | +1.5% | Western Kazakhstan (Atyrau), cross-border nodes to China | Long term (≥ 4 years) |
| Petrochemical complex build-out | +2.1% | Atyrau region, with distribution hubs in Almaty | Long term (≥ 4 years) |
| Blockchain fuel-quality pilot | +0.3% | Pilot phase in Almaty and Astana | Long term (≥ 4 years) |
| Bio-jet fuel (camelina feedstock) push | +0.4% | National, with early trials at Almaty International Airport | Long term (≥ 4 years) |
| Source: Mordor Intelligence | |||
Government-Led Refinery Modernization
Capacity upgrades at Shymkent, Pavlodar, and Atyrau collectively add 8.7 million t/y by 2028, ending diesel imports and enabling exports to Uzbekistan and Kyrgyzstan.[1] Shymkent’s expansion doubles throughput to 12 million t/y, lifts middle-distillate yields from 52% to 68%, and integrates delayed coking and hydrocracking units suited to regional trucking demand. Pavlodar’s 2027 upgrade boosts nameplate capacity to 8 million t/y and installs a catalytic reformer that achieves Euro-5 octane levels without imported additives. The March 2025 privatization tender seeks partners able to cut energy intensity 15% via heat integration and flare-gas recovery, consistent with the 2060 carbon-neutrality roadmap. This modernization contrasts with Turkmenistan’s Soviet-era refineries that run below 60% utilization due to sanctions and underinvestment.
Euro-5 Fuel Demand Surge
Nationwide Euro-5 mandates taking effect in January 2025 compelled hydrotreating investments that reduce sulfur from 500 ppm to 10 ppm. Atyrau restarted in October 2024 with a 1.2 million t/y hydrotreater supplying Euro-5 diesel to Aktobe and Mangystau. Russian Euro-5 imports, once 18% of consumption in 2024, vanished by mid-2025, unlocking arbitrage to Kyrgyzstan, where Euro-4 standards persist. Retailers realize a 12% price premium for Euro-5, spurring station upgrades and accelerating inventory turnover. Compliance also positions Kazakhstan to regain European buyers once CPC reliability improves, as EU refiners avoid high-sulfur grades under Fuel Quality Directive rules.
Strategic Export Corridor to China & Central Asia
CPC disruptions after September 2024 drone strikes redirected up to 8 million t/y of crude into the 20 million t/y Kazakhstan-China Pipeline, now running near capacity. Tengizchevroil’s Future Growth Project, online January 2025, adds 12 million t/y that flows exclusively east to Sinopec and PetroChina, raising China’s share of Kazakh exports to 62% in 2025. A November 2024 barter deal with MOL Group covering 85,000 t of CPC crude shows hedging moves to maintain European access amid geopolitical risk. Uzbekistan and Kyrgyzstan signed 2025 MOUs seeking 1.5 million t/y of diesel and jet fuel via rail and road, reinforcing regional market diversification.
Blockchain Fuel-Quality Pilot
The Ministry of Energy’s 2025 blockchain pilot logs refinery test results to an immutable ledger, cutting Euro-5 adulteration at 120 retail sites by 23% during trials.[2] National rollout slated for 2027 compels refiners and import terminals to integrate real-time SCADA data on viscosity and sulfur into batch IDs, creating a transparent chain of custody. Reduced tax evasion could lift annual excise revenue by USD 180 million, improving fiscal stability for downstream infrastructure upgrades.
Restraints Impact Analysis*
| Restraint | (~) % Impact on CAGR Forecast | Geographic Relevance | Impact Timeline |
|---|---|---|---|
| Megaproject financing delays | -0.9% | National, concentrated in Atyrau and Mangystau regions | Medium term (2-4 years) |
| CPC pipeline disruptions | -1.1% | Western Kazakhstan, affecting Tengiz and Kashagan fields | Short term (≤ 2 years) |
| Process-safety talent shortage | -0.5% | National, acute at Atyrau, Pavlodar, Shymkent refineries | Long term (≥ 4 years) |
| Water stress at refinery hubs | -0.6% | Atyrau and Pavlodar regions along Ural and Irtysh rivers | Long term (≥ 4 years) |
| Source: Mordor Intelligence | |||
Megaproject Financing Delays
KazMunayGas carried USD 14.7 billion in gross debt and a 2.8x debt/EBITDA ratio at end-2024, limiting equity for new builds and favoring brownfield upgrades with quicker payback. Silleno’s USD 5.2 billion debt package required Sinopec and SIBUR equity that reduced KazMunayGas’s stake to 40%, capping upside. Moody’s affirmed a Baa1 rating in January 2025, citing dividend extractions and price volatility, restricting cheap capital access. Local banks impose >150% collateral and 7-year tenors on smaller firms, delaying PTA and MEG units that would integrate the polyester chain.
CPC Pipeline Disruptions
September 2024 drone strikes halted CPC single-point moorings, forcing 8 million t/y to China and adding USD 12/bbl logistics costs, eroding producer netbacks and stalling expansion plans. War-risk insurance caps of USD 500 million have shareholders studying a USD 4 billion trans-Caspian route via Kuryk and Baku with a 5-year lead time. Substituting heavier Kumkol crude for premium Kashagan barrels at Atyrau and Pavlodar trims diesel yields by 3 percentage points, squeezing refinery gross margins.
*Our forecasts treat driver/restraint impacts as directional, not additive. The impact forecasts reflect baseline growth, mix effects, and variable interactions.
Segment Analysis
By Type: Refineries Anchor Capacity, Petrochemicals Drive Margin Shift
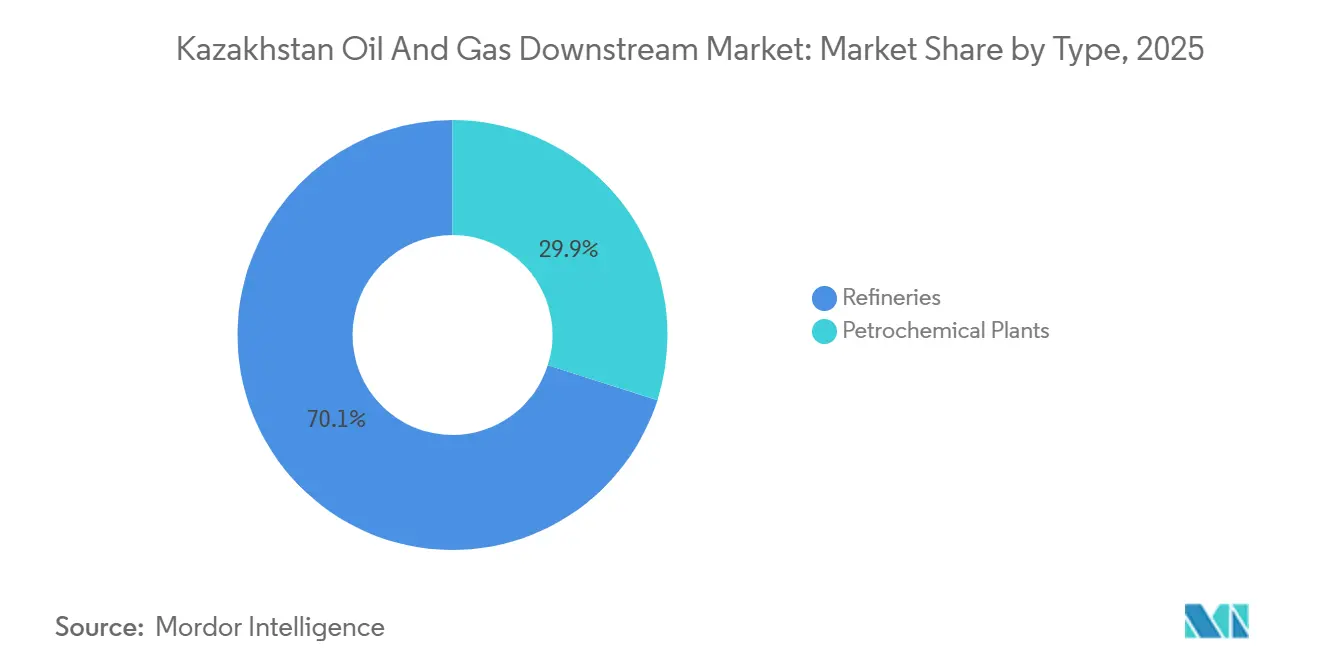
Refineries held 70.1% of the Kazakhstan downstream market share in 2025, anchored by 17 million t/y of combined capacity at Atyrau, Pavlodar, and Shymkent. Petrochemical plants, however, will outpace refineries, with an 8.9% CAGR through 2031 as the USD 3 billion Gas Separation Unit diverts 9 bcm/y of ethane-rich gas into polymer feedstock, slashing polyethylene cash costs to USD 620/t, 16% below European averages.[3] Bitumen specialist CaspiBitum provides portfolio resilience by serving the USD 8 billion Nurly Zhol road program.[4]
Petrochemical earnings grow faster than refinery profits, as Euro-5 hydrotreaters add USD 22/t in operating cost and retail caps crimp pass-through. The Kazakhstan downstream market size attributable to petrochemicals is therefore set to close the gap on fuels, even though refineries continue to dominate overall throughput. As imported Russian diesel faces tariffs from 2025 onward, refinery utilization will stay high, yet investment focus will tilt toward integrated cracker capacity where higher margins outweigh scale disadvantages versus GCC giants.

By Product Type: Petrochemicals Gain Share as Fuel Margins Compress
Refined fuels made up 67.5% of 2025 output, with diesel at 42% and gasoline at 31%. Jet fuel reached 1.8 million t in 2025; Shymkent supplied 60% and exported overland to Kyrgyzstan and Tajikistan. Lubricants expanded 9.2%, led by LUKOIL’s 100,000 t/y Almaty plant producing 800 SKUs. Petrochemicals, boosted by Silleno HDPE/LLDPE volumes and KPI polypropylene, will climb at an 8.7% CAGR, trimming fuels’ share below 60% by 2031. The Kazakhstan downstream market size for polymer products thus grows steadily on the back of low-cost associated-gas feedstock, underpinned by a 16-year dry-gas contract that shields producers from price shocks.
Higher Euro-5 compliance costs squeeze refining EBITDA margins from 11% in 2023 to 8% in 2025, while polyethylene margins remain structurally stronger on the USD 180/t feedstock advantage over European crackers. This profitability gap encourages KazMunayGas to channel capital toward chemicals, mirroring Saudi Aramco’s fuels-plus-chemicals co-location model.
By Distribution Channel: Retail Networks Expand into Underserved Corridors
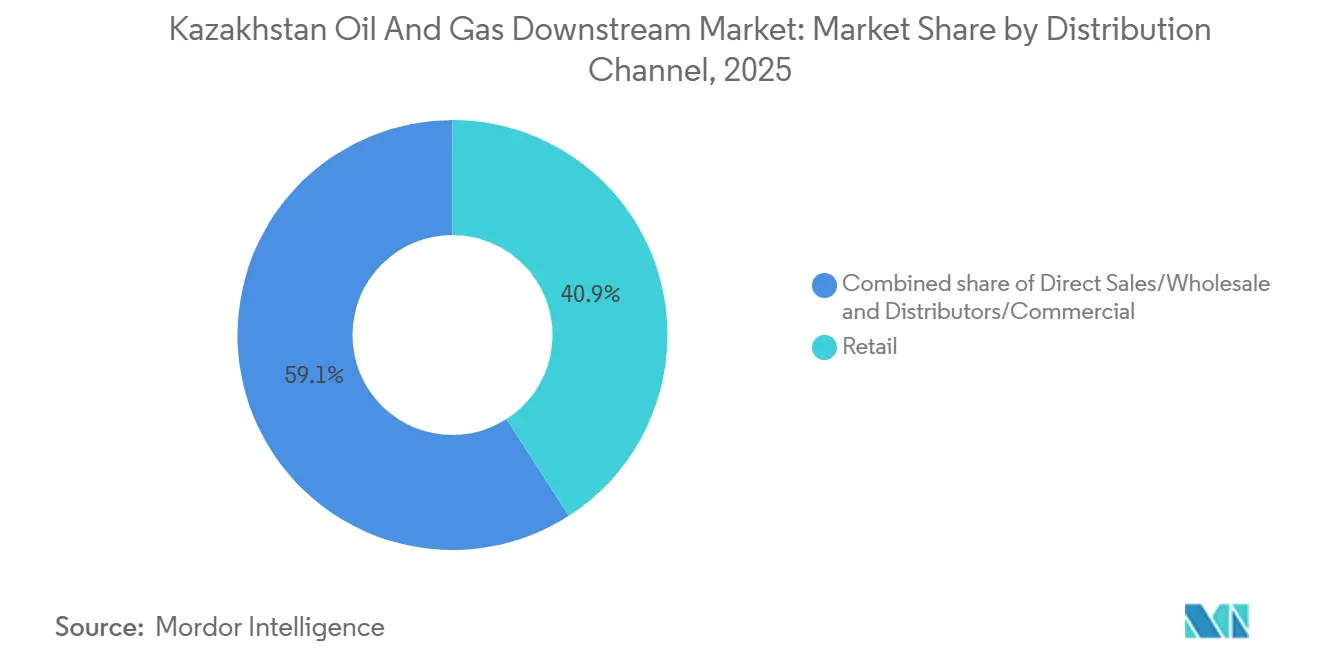
Retail captured 40.9% of 2025 revenue as branded chains extended footprints along Almaty-Khorgos and Shymkent-Tashkent corridors in response to 18% annual growth in cross-border truck traffic. Helios plans 85 new sites by 2027, leveraging Euro-5 quality perception to price 12% above unbranded stations. Direct industrial sales comprised 35.2%, indexed to Urals plus USD 8/bbl, exposing margins to crude volatility. Distributors held 23.9%, servicing specialty lubes but battling counterfeit inflows via informal Russia-China trade routes.
The Kazakhstan downstream market benefits from 2025 rules mandating vapor recovery and e-payments, which forced under-capitalized independents out and shifted share to well-financed chains. Retail, therefore, enjoys a 7.5% CAGR forecast through 2031 versus mid-single-digit growth for wholesale channels. Blockchain certification should further strengthen branded retailers by raising compliance hurdles for gray-market operators.
Geography Analysis
Domestic demand absorbed 78% of refined products in 2025, driven by agriculture and trucking, with exports expected to rise to 30% by 2031 as petrochemical output scales. Atyrau generates 48% of the downstream value added, benefiting from Tengiz feedstock but constrained by water scarcity and engineering talent gaps. Pavlodar’s refinery leverages Omsk-Pavlodar crude inflows and supplies industrial Karaganda, yet Irtysh River stress and Chinese upstream diversions pose long-term risks. Shymkent sits near Uzbek and Kyrgyz borders and will export 2.5 million t/y of diesel and jet fuel once its 12 million t/y expansion is completed in 2028.
China’s share of Kazakh crude exports rose from 38% in 2023 to 62% in 2025 as the CPC route faltered. Silleno plans to ship 80% of 1.25 million t/y polyethylene through the 48-hour Khorgos dry-port corridor, beating Middle Eastern rivals on lead time. Central Asia, importing 1.2 million t of refined fuels in 2025, will nearly double volumes by 2030 under Belt-and-Road-driven road upgrades. Europe took only 1.8 million t of Kazakh crude in 2025 but remains a strategic hedge via MOL’s November 2024 trading pact.
Almaty lacks refining assets yet dominates lubricant logistics, dispatching LUKOIL’s 800 SKUs across the region. Mangystau contributes 12% of downstream output through CaspiBitum’s pavement-grade refinery, servicing the Nurly Zhol road initiative but lacking pipeline links to consumption hubs. Feasibility studies for a USD 4 billion trans-Caspian line to Baku aim to diversify export routes and reduce Russian dependence, though completion lies beyond 2030.
Regulatory Landscape
Kazakhstan downstream activity is regulated by the Ministry of Energy of the Republic of Kazakhstan, with state controls extending to the production and turnover of key oil products such as gasoline, aviation fuel, diesel, fuel oil, and road bitumen under the state regulation framework (Law No. 463-IV, with updates reflected through 2026). A key operational anchor is annual planning, as the Ministry of Energy approves refinery oil processing plans each year by December 15 for the following calendar year, tightening coordination requirements across crude supply, maintenance schedules, and domestic market obligations.
Policy signaling for capacity and standards has strengthened through Government programs, including the Concept for Development of the Oil Processing Industry (2025-2040), which requires annual reporting to the Ministry of Energy by May 1, and the Comprehensive Plan for Gas Industry Development (2025-2029) (Government Order No. 463 of June 21, 2025). The latter introduces pricing-model changes and requires technical standards for pipeline and distribution infrastructure. Technical compliance is also reinforced via a 2025 normative technical document on technological regulations that applies to existing, expanding, and newly commissioned production facilities, raising the bar for project documentation and operating discipline across modernization and new-build downstream assets.
Competitive Landscape
The Kazakhstan downstream market is moderately concentrated: KazMunayGas controls 68% of refining while Tengizchevroil dominates upstream feedstock. Joint-venture models like the USD 7.4 billion Silleno plant pool KazMunayGas 40%, Sinopec 30%, and SIBUR 30% stakes, sharing risk and technology. A 16-year dry-gas agreement between Tengizchevroil and KazMunayGas PetroChem locks in 9 bcm/y at preferential rates, creating a feedstock moat versus stand-alone refiners. LUKOIL’s Almaty lubricant plant shows how specialty niches can deliver premium margins despite scale disadvantages.
MOL Group’s 2024 agreements with KazMunayGas signal new entrants leveraging European process know-how to unlock polypropylene potential. Technology gaps persist: Tengizchevroil shaved 18% from turnaround downtime via digital twins, whereas CaspiBitum still runs legacy DCS lacking predictive maintenance. The 2025 blockchain fuel-quality mandate favors integrated players with central labs; small distributors must invest in IT upgrades or exit. The Atyrau and Pavlodar refineries' 50% privatization will likely invite Honeywell or Axens process partners, accelerating energy-efficiency gains that currently trail GCC benchmarks by 12-15%.
Privatization dilutes state stake yet retains strategic oversight through KazMunayGas golden shares, balancing foreign capital needs with resource-nationalist sentiment. Competitive intensity is expected to rise as Sinopec and SIBUR capture polymer export channels and as MOL seeks crude security via partial vertical integration.
Kazakhstan Oil And Gas Downstream Industry Leaders
-
National Company KazMunayGas (KMG)
-
PetroKazakhstan Inc.
-
PJSC Lukoil Oil Company
-
Kazakhstan Petrochemical Industries LLP
-
KazTransOil JSC
- *Disclaimer: Major Players sorted in no particular order
Market Opportunities and Future Outlook
A near-term opportunity is emerging around refinery new-build and modernization projects now being formalized into investable pathways, including Government actions for a fourth major refinery and expansion programs at existing plants. In February 2026, the Ministry of Energy announced plans around a new 10 million tons per year refinery with a stated USD 10 billion cost envelope, and in May 2026 it moved into a practical phase for the fourth refinery program, with pre-feasibility work focused on feedstock supply and site selection. In July 2026, Kazakhstan adopted amendments to investment project regulations that explicitly include downstream production facility construction and modernization within eligible investment projects, improving bankability for refinery depth upgrades and petrochemical-linked units.
Gas processing additions also broaden the downstream feedstock base and reduce reliance on cross-border processing, supporting petrochemical integration and higher value products. In June 2026, Hyundai Engineering signed a contract to construct a 5 bcm per year gas processing plant at the Karachaganak field, a step toward shifting volumes away from processing at Russias Orenburg Gas Processing Plant and enabling more domestic NGL and ethane-linked value chains. Feasibility work launched in February 2026 between the Ministry of Energy and CNPC for the Shymkent refinery expansion (6+6 configuration) further reinforces an investable corridor tied to the Kazakhstan-China export route. At the same time, additional whitespace in certified fuel quality and retail compliance tooling is supported by the Ministrys 2025 blockchain fuel-quality pilot, along with broader tightening of monitoring rules for production and sales of oil products.
Recent Industry Developments
- March 2026: National Company KazMunayGas suspended development of the Kalamkas-Sea and Khazar fields in the Caspian Sea, a project previously associated with Lukoil, citing sanctions-related constraints. The pause strengthens the companys incentive to prioritize domestic downstream and petrochemical projects where execution risk is more controllable. It also underscores how external compliance and partner-risk can reallocate capital away from offshore supply growth and toward refining and chemicals integration.
- December 2025: KazMunayGas reported its refineries achieved record oil processing of 18.16 million tons in 2025. Higher run rates reinforce domestic Euro-5 product availability and support the shift from imported fuels toward locally produced gasoline and diesel. The operational milestone also elevates the importance of sustaining reliability and debottlenecking at Atyrau, Pavlodar, and Shymkent as the country targets more value-added exports.
- December 2024: KMG PetroChem signed a dry gas purchase and sale agreement with Tengizchevroil for supply of up to 9 bcm per year of dry gas, with extracted ethane intended as feedstock for the Atyrau polyethylene project. The contract anchors long-term feedstock security for the petrochemical chain, improving the economics of large-scale polymer capacity in the Atyrau region. It also tightens integration between upstream gas handling and downstream chemicals, supporting margin diversification beyond transport-fuel cracks.
Research Methodology Framework and Report Scope
Market Definition and Coverage
For this report, the market is defined as the value generated in Kazakhstan from downstream oil and gas activities, covering refining and petrochemical production and the movement of finished products through wholesale and retail routes.
Scope exclusions: It excludes upstream extraction and most midstream transportation and storage services when they are not part of downstream product sales value.
Segmentation Overview
- By Type
- Refineries
- Petrochemical Plants
- By Product Type
- Refined Petroleum Products
- Petrochemicals
- Lubricants
- By Distribution Channel
- Direct Sales/Wholesale
- Distributors/Commercial
- Retail
Data Sources, Market Sizing, and Validation
Desk Research
Desk research was used to set the factual base for the model, especially around Kazakhstan refining and petrochemical capacity, fuel quality standards, and demand direction. We relied on public sources such as national statistics publications, energy and industry ministry releases, customs and trade statistics, and technical references from standards bodies that track fuel specifications.
To translate these signals into a usable market model, we also reviewed company annual reports, investor presentations, refinery and petrochemical project announcements, and credible local and international press coverage. Where it helped with consistency, paid subscriptions were used only for company financials and structured news tracking, plus patent databases to understand technology and upgrade activity. These desk sources are illustrative, and many other references were also used to collect data, validate assumptions, and clarify specific points.
Primary Interviews and Surveys
We conduct expert interviews and surveys in Kazakhstan with refinery, petrochemical, lubricant, distribution, trading, and regulatory professionals. Their views test throughput, product mix, pricing, utilization, import needs, and capacity timing, fill public-data gaps, and triangulate the model. Fieldwork covers different company sizes and job levels.
Distribution of primary research fieldwork respondents
| Company type | Respondent position |
|---|---|
| Top tier: 28% | CXOs: 18% |
| Mid tier: 47% | Functional/Unit leaders: 34% |
| Smaller Players: 25% | Managers: 48% |
Market-Sizing & Forecasting
The sizing model was built using a mix of top-down and bottom-up checks. On the top-down side, refining and petrochemical output signals were reconstructed into a demand pool, and then translated into value using market-linked price indicators and channel-level markups where applicable. Since a fully bottom-up roll-up is not practical in this market, selective bottom-up approximations were used as guardrails, such as sampled price per ton times produced volumes, distributor channel checks, and reasonableness tests against reported downstream revenue ranges.
Key inputs that shaped the model included refinery nameplate capacity and utilization direction, planned maintenance and upgrade timing, shifts in the refined product slate, domestic fuel consumption growth drivers (transport and industrial use), and how lubricants and petrochemical output is priced relative to feedstock. When some data points were missing (for example, temporary utilization dips or unreported channel splits), gaps were handled by using conservative ranges agreed in primary discussions, and then rebalanced so totals still matched observable production and trade signals.
For forecasting, scenario analysis was used because growth depends on project execution dates and the pace of demand absorption, not only on historical trends. Assumptions were stress-tested using primary feedback on capacity ramp-ups, likely utilization bands, and pricing progression, and then the most probable case was carried into the final forecast.
Data Validation & Update Cycle
Model outputs were cross-checked against independent indicators like capacity additions, operating rate commentary, product demand direction, and visible trade movements for key products. When results looked out of pattern, the drivers were rechecked, and follow-up calls were triggered to confirm whether the variance came from pricing, channel mix, or one-off outages.
Before sign-off, the work goes through multi-step analyst review so assumptions, math flows, and year-over-year movements are consistent with the story and the data. The report is refreshed annually, and interim updates are made when there are material events such as major refinery upgrades, regulatory changes affecting product specs, or sharp pricing shifts. Right before delivery, we do a fresh review pass so clients receive the latest updated view.
Mordor Intelligence's Kazakhstan Oil and Gas Downstream Market Size Measured Against Other Published Estimates
Published market sizes for Kazakhstan downstream often vary because each publisher draws the line differently between refining and petrochemicals, finished product distribution value, and broader oil and gas activity. Timing also matters, since base year selection and price normalization choices can move the value even if physical volumes are similar.
The main gap drivers in this market usually come from whether the estimate is anchored to Kazakhstan-specific production and utilization signals or whether it leans more on broad investment headlines and long-range capacity plans. Differences also show up when some estimates apply aggressive price progression, mix in adjacent services, or use currency conversion timing that does not match the base-year price environment.
Benchmark comparison
| Source | Market Size | Gaps in Research Methodology |
|---|---|---|
| Mordor Intelligence | USD 1.74 B (2025) | |
| Global Consultancy A | USD 11.50 B (2023) | Uses a wider downstream interpretation that blends refining, distribution, and marketing with broader end-use and process coverage, which can pull in value streams outside a refinery and petrochemical output linked view. |
| Industry Publisher B | USD 12.00 B (2025) | Leans heavily on announced capex programs and long-horizon capacity expansion narratives, which can overstate near-term realized value if utilization and product pricing are not tied back to operating levels. |
The table points to a scope-driven spread, and in Mordor Intelligence's model the market is counted around refinery and petrochemical plants plus the value linked to selling refined products through wholesale and retail channels, rather than treating all downstream-linked activity and investment as revenue. With that tighter linkage to operating output signals and channel flows, the estimate stays easier to trace, validate, and repeat when new capacity and pricing information becomes available.
Key Questions Answered in the Report
What is the current value of the Kazakhstan downstream market?
The Kazakhstan downstream market size stands at USD 1.84 billion in 2026 and is projected to reach USD 2.57 billion by 2031.
Which segment is growing the fastest in Kazakhstan’s downstream sector?
Petrochemical plants are the fastest-growing segment, advancing at an 8.9% CAGR through 2031 on the back of the Silleno polyethylene and KPI polypropylene investments.
How will Kazakhstan meet rising Euro-5 fuel demand?
Shymkent, Pavlodar, and Atyrau refineries are adding hydrotreaters and hydrocrackers that lift Euro-5 diesel and gasoline output, eliminating previous reliance on Russian imports.
What role does China play in Kazakhstan’s export strategy?
China receives 62% of Kazakh crude via the Kazakhstan-China Pipeline; it will also buy most polyethylene output once the Silleno plant comes online.
Why are water stress and talent shortages considered key risks?
Declining Ural and Irtysh river flows cap refinery water withdrawals, while a 1,200-engineer shortfall delays digital-twin and safety-system deployment, both of which could dampen forecast growth.