
Semiconductor Equipment Market Size and Share
Semiconductor Equipment Market Analysis by Mordor Intelligence
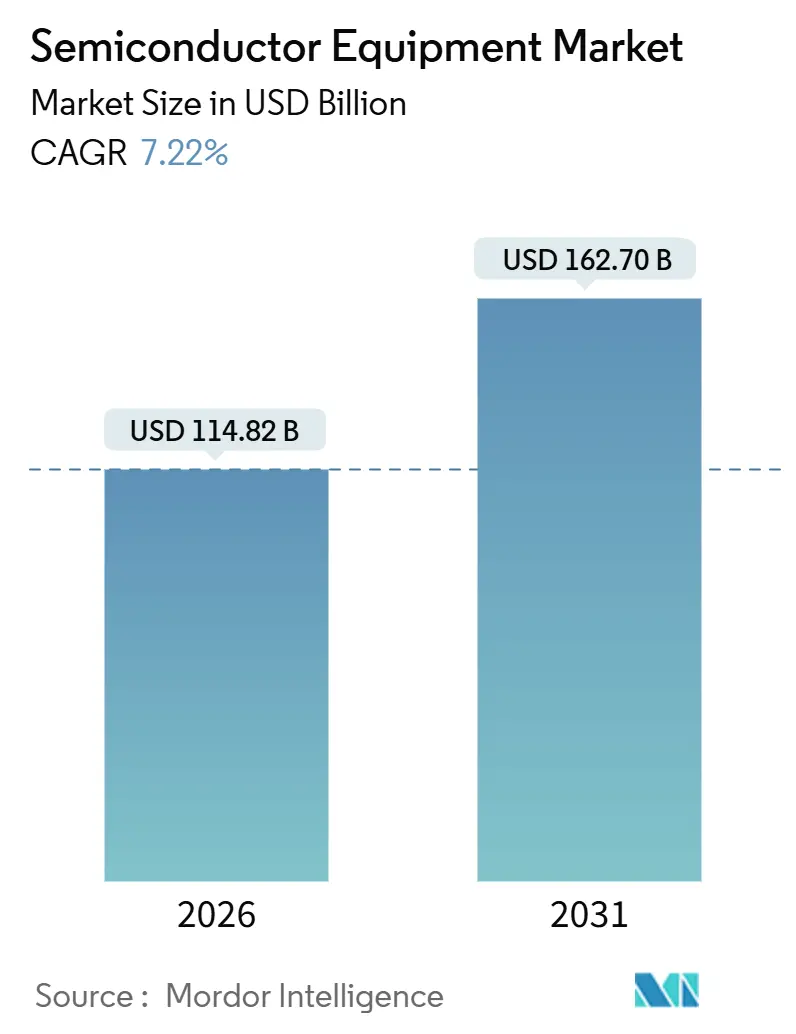
The semiconductor equipment market size was valued at USD 114.8 billion in 2026 and estimated to grow from USD 123.1 billion in 2027 to reach USD 179.7 billion by 2032, at a CAGR of 7.86% during the forecast period (2027-2032).
AI-linked memory capacity pressure in South Korea and advanced-device technology migration support equipment investment, while public funding can broaden project financing. Commercial qualification of High-NA EUV creates a path for selective tool adoption alongside established production platforms. Capital-return hurdles and upstream material disruptions can nevertheless delay conversion of demand into installed manufacturing capacity. Production acceptance and regulatory access consequently shape which suppliers can convert investment plans into manufacturing systems for eligible buyers.
Key Report Takeaways
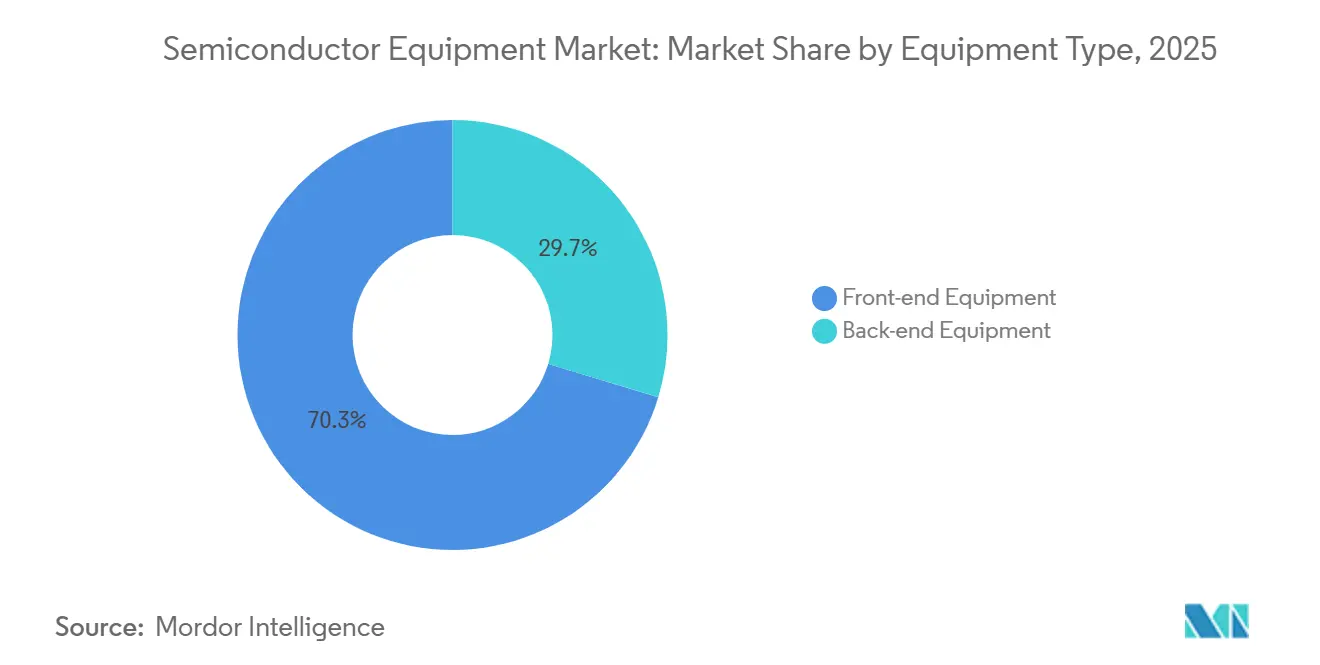
- By equipment type, front-end equipment held a 70.6% semiconductor equipment market share in 2026 and is forecast to be the fastest-growing segment, at a CAGR of 8.7% during 2027-2032.
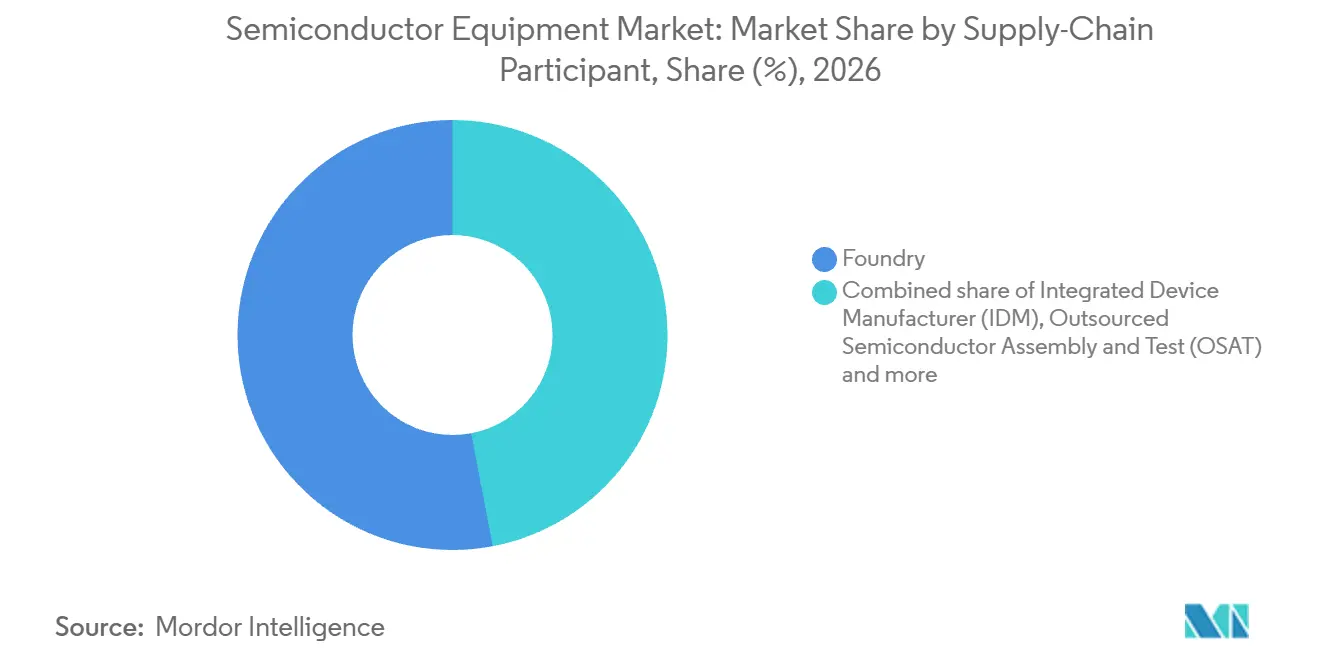
- Among supply-chain participants, foundries accounted for a 53% share of the semiconductor equipment market size in 2026, while outsourced semiconductor assembly and test (OSAT) providers are projected to grow fastest, at a CAGR of 8.6% during 2027-2032.
- Across wafer sizes, 300 mm equipment led with a 63.94% share in 2026 and is forecast to be the fastest-growing segment, at a CAGR of 8.6% during 2027-2032.
- By end-use industry, computing and data-center applications held the largest share at 32.31% in 2026, while automotive and mobility applications are forecast to grow fastest, at a CAGR of 9% during 2027-2032.
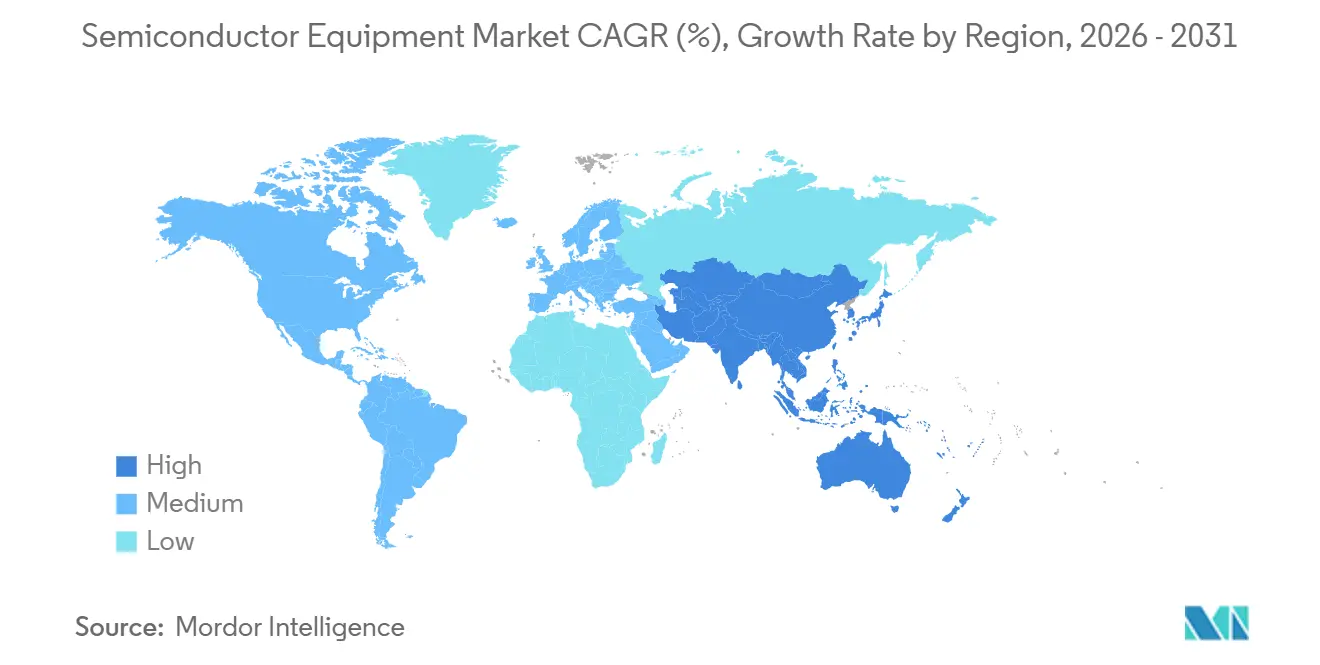
- Geographically, Asia-Pacific led with a 53.34% share in 2026 and is projected to be the fastest-growing geography, at a CAGR of 9.6% during 2027-2032.
Note: Market numbers in this report are based on Mordor Intelligence's proprietary estimation framework, which combines nine months of actuals with Q4 projections for base year 2026.
Market Trends and Insights
Drivers Impact Analysis of Semiconductor Equipment Market*
| Driver | (~) % Impact on CAGR Forecast | Geographic Relevance | Impact Timeline |
|---|---|---|---|
| Surging Demand For Advanced Consumer Electronics And Smartphones | +1.9% | Taiwan advanced-node fabrication | Short term (≤ 2 years) |
| Rapid AI-, IoT- And Edge-Device Node Investments | +2.9% | South Korea memory manufacturing | Short term (≤ 2 years) |
| Government Subsidy Waves (CHIPS Act, EU Chips Act, Etc.) Boosting Tool Capex | +2.1% | United States and Germany | Medium term (2-4 years) |
| Transition To GAA And High-NA EUV Necessitating New Toolsets | +2.3% | United States advanced-logic manufacturing | Medium term (2-4 years) |
| Sustainability Mandates Driving "Green-Fab" Retrofit Tools | +0.8% | Covered fabrication sites in Taiwan | Medium term (2-4 years) |
| 3D Heterogeneous-Integration Packaging Demand Spike | +1.1% | Singapore advanced-packaging manufacturing operations | Medium term (2-4 years) |
| Source: Mordor Intelligence | |||
Surging Demand For Advanced Consumer Electronics And Smartphones
Smartphone demand supports equipment investment through adoption of advanced manufacturing technologies, making the fabrication requirements of new devices commercially significant. TSMC said on October 15, 2026, that strong smartphone and high-performance computing/AI application demand supported its expected N2-family expansion. The foundry expected annual capacity for these technologies to more than double in 2027. This links the opportunity to a specific manufacturing platform, with smartphone applications contributing alongside computing demand. Because that doubling is expected during 2027, the tools needed to equip it fall within the next 2 years, placing the smartphone-linked opportunity in leading-edge N2 lines.
Rapid AI-, IoT- And Edge-Device Node Investments
AI-linked memory investment increases demand for equipment that can help convert additional fabrication capacity into production-ready output. In Q2 2026, SK hynix said customer demand exceeded supply capabilities and that it was accelerating the mass-production schedule for its Cheongju M15X fab. An accelerated ramp can bring forward the point when production tools must be ready, concentrating the opportunity around manufacturing execution. The same disclosure tied further capacity investment to the planned opening of the Yongin Phase 1 cleanroom in early 2027. Equipment suppliers therefore face both an accelerated production schedule at M15X and a cleanroom-dependent expansion opportunity, making tool readiness and facility availability distinct conditions for converting investment into output.
Government Subsidy Waves (CHIPS Act, EU Chips Act, Etc.) Boosting Tool Capex
Public support broadens the financing base for semiconductor facilities, making investment less dependent on manufacturers funding every expansion themselves. By July 15, 2026, the United States Department of Commerce had awarded 9 new incentive projects since July 2025, bringing its facilities and equipment program to 49 projects across 24 companies. In July 2026, the European Commission approved Germany’s EUR 659 million (USD 751.6 million) direct-grant package for 4 new semiconductor value-chain facilities.[1] These commitments support potential equipment demand by lowering the private funding required for eligible investment. Direct funding in the United States program was tied to proof of milestone completion or to workforce activities. Tool suppliers consequently face an investment opportunity whose conversion follows facility execution rather than the award announcement alone.
Transition To GAA And High-NA EUV Necessitating New Toolsets
Commercial qualification makes advanced lithography an equipment investment opportunity by connecting a new tool platform to saleable processor production. By July 15, 2026, Intel Foundry had entered high-volume manufacturing for a subset of Intel Core Ultra Series 3 processors using ASML’s EXE High-NA EUV technology. Specific Intel 18A layers were dual-qualified on High-NA EUV in Oregon, with products shipping at yields matched to the NXE platform. The qualification creates a choice of manufacturing routes for those specific layers. Layer-level adoption can therefore create a commercial route for High-NA tools alongside existing installations, allowing selected capabilities to enter production before a broader fleet transition.
Restraints Impact Analysis of Semiconductor Equipment Market*
| Restraint | (~) % Impact on CAGR Forecast | Geographic Relevance | Impact Timeline |
|---|---|---|---|
| Extremely High CAPEX And Long Pay-Back Cycles | -1.3% | Capital-intensive fabrication projects in Germany | Long term (≥ 4 years) |
| Specialty-Material Supply Bottlenecks Delaying Tool Shipments | -1% | Europe and Asia-Pacific supply chains | Short term (≤ 2 years) |
| Export-Control Restrictions On China-Bound Tools | -0.6% | China-bound supply from the United States | Medium term (2-4 years) |
| Acute Shortage Of Skilled Field-Service Engineers | -0.4% | Taiwan semiconductor manufacturing locations | Long term (≥ 4 years) |
| Source: Mordor Intelligence | |||
Extremely High CAPEX And Long Pay-Back Cycles
Capital-return requirements can prevent manufacturing expansion from becoming equipment demand even when a semiconductor producer has the technology to proceed. In 2025, Intel discontinued planned German fab expansion and said future node and facility investments required a clear path to an acceptable capital return. It described leading-edge manufacturing as capital-intensive, with investments taking years to yield returns. ASML also warned that high interest rates and financial-market volatility could make it harder for semiconductor manufacturers to raise debt or equity capital for equipment purchases. Together, return thresholds and financing exposure can constrain the conversion of technical plans into funded manufacturing assets. The resulting restraint reaches tool suppliers before procurement, through projects that fail the buyer’s investment hurdle.
Specialty-Material Supply Bottlenecks Delaying Tool Shipments
Material availability can constrain equipment delivery before a completed tool reaches the semiconductor manufacturer, exposing buyers to disruption upstream of final assembly. ASML reported that some suppliers had faced operational disruptions from raw-material shortages and said such disruptions could delay parts deliveries and, in turn, its product shipments. The commercial exposure arises because a tool shipment depends on the availability of its constituent parts and subassemblies. Even when the buyer’s manufacturing project is funded, an upstream interruption can postpone the point at which that investment becomes usable capacity. For the equipment supplier, the remaining constraint is the timing of deliverable systems, with potential delay passed along the production chain.
*Our forecasts treat driver/restraint impacts as directional, not additive. The impact forecasts reflect baseline growth, mix effects, and variable interactions.
Semiconductor Equipment Market Segment Analysis
By Equipment Type:
Advanced Manufacturing Supports Front-End LeadershipFront-end equipment accounted for a 70.6% share of the semiconductor equipment market size in 2026 and is forecast to be the fastest-growing segment, at a CAGR of 8.7% during 2027-2032. In March 2026, SK hynix agreed to purchase EUV lithography scanners from ASML, with ASML Korea as the contracting counterparty. The decision connects a memory producer’s manufacturing investment to a specific production technology. For tool suppliers, this creates a commercial opportunity around the fabrication capabilities that a chipmaker chooses to install. Technology-specific commitments can therefore support equipment demand before the associated manufacturing capacity contributes additional chip output.
Back-end equipment participates through a distinct set of investments in the later stages of semiconductor production. Within this segment, SEMI reported that global assembly and packaging equipment sales increased 20.8% in 2025. It forecast a further 9.6% increase to USD 6.7 billion in 2026. Growth in this category creates opportunities for suppliers serving packaging operations alongside those pursuing wafer-fabrication investment. The commercial distinction is where the equipment contributes to manufacturing, so expansion in packaging can create a separate pool of equipment demand without requiring the same tool capabilities as front-end production.

By Supply-Chain Participant:
Foundry Scale and OSAT Expansion Shape DemandFoundries represented a 53% semiconductor equipment market share in 2026, making them the largest segment. TSMC kept its planned company-wide 2026 capital expenditure budget at USD 60 billion to USD 64 billion. That budget shows the scale of capital controlled by a single foundry buyer. A large foundry account can therefore concentrate equipment revenue opportunity and capital-cycle exposure in the same customer relationship.
Outsourced semiconductor assembly and test (OSAT) is forecast to be the fastest-growing segment, at a CAGR of 8.6% during 2027-2032. Amkor, a packaging and test services provider, reported company-wide Q2 2026 net sales of USD 1.9 billion, up 26% from Q2 2025. Expansion at an outsourced packaging and test provider can increase its need for assembly and test equipment, directing the opportunity toward OSAT capacity investment.
By Wafer Size:
Large-Wafer Investment Serves Diverse Applications300 mm equipment was the largest segment, with a 63.94% share in 2026, and is forecast to be the fastest-growing segment, at a CAGR of 8.6% during 2027-2032. SEMI projected global spending on 300 mm front-end fab equipment to rise 31% year over year in 2026. It expected investment growth at double-digit rates to continue through 2029. This extends the equipment opportunity across a multi-year investment horizon within the same manufacturing format. Suppliers serving that format can therefore pursue additional capacity investment without depending on each buyer changing its wafer diameter.
300 mm adoption also reaches power-management manufacturing, broadening equipment exposure beyond a single class of computing chips. Texas Instruments began production and customer deliveries from its 300 mm SM1 fab in Sherman, Texas, by December 17, 2025. Initial analog power products addressed automotive lighting, battery management and data-center power needs. That application mix connects the manufacturing format to functions used across vehicles and computing infrastructure, rather than to only one final device. Equipment demand in this format can consequently benefit from several applications sharing a production platform, giving suppliers exposure to manufacturing requirements across different end markets.
By End-Use Industry:
Computing Investment and Automotive Power Capacity DivergeComputing and data-center applications formed the largest segment, with a 32.31% share in 2026. Micron broke ground on an HBM advanced-packaging facility in Singapore on January 8, 2025, to meet AI data-center demand. The planned investment was approximately USD 7 billion through the end of the decade and beyond. This connects the equipment opportunity to a memory producer’s packaging capacity, adding a manufacturing investment channel beyond the processors installed in computing systems. Suppliers can therefore participate in computing demand through the production infrastructure supporting memory, with the facility’s extended investment horizon spreading the opportunity beyond its groundbreaking.
Automotive and mobility is forecast to be the fastest-growing segment, at a CAGR of 9% during 2027-2032. Infineon opened its Dresden Smart Power Fab in July 2026, doubling the site’s manufacturing capacity for intelligent power semiconductors and analog/mixed-signal technologies. Infineon identified automotive uses, including software-defined vehicles, alongside industrial applications for its chips. In July 2026, Micron announced automotive-memory capacity expansions designed to support long product lifecycles and sustained supply for critical production programs. Supply continuity consequently links automotive equipment demand to long-lived production programs, giving capacity investment a purpose beyond a short increase in device shipments.
Geography Analysis
Asia-Pacific Semiconductor Equipment Market
Asia-Pacific accounted for a 53.34% share of the semiconductor equipment market size in 2026 and is forecast to be the fastest-growing geography, at a CAGR of 9.6% during 2027-2032. China held the largest country position for 13 consecutive quarters through Q2 2026, with billings exceeding USD 10 billion for 12 consecutive quarters. South Korean billings reached USD 9.08 billion in Q2 2026, up 54% year over year, while Taiwan recorded USD 10.89 billion, up 24%. The region consequently combines a sustained buying base with growing equipment spending in several manufacturing centers, giving suppliers access to expansion beyond one country’s investment cycle.
North American equipment spending fell 20% to USD 10.9 billion in 2025 as investment moderated following earlier capacity expansion. Europe’s spending fell 41% to USD 2.9 billion in 2025 amid automotive and industrial demand weakness, while Q2 2026 billings rose 70% year over year. The European quarterly increase establishes renewed purchasing activity for that period, while North America’s annual moderation illustrates how capacity builds can be followed by lower equipment spending. Long-run regional growth can therefore coexist with periods of reduced tool investment, making the timing of capacity projects central to suppliers’ revenue exposure.
In South America, BNDES approved financing on June 10, 2026, for Zilia Technologies to expand production and acquire assembly, testing, handling and measurement equipment for its Atibaia factory in Brazil. Funding was subject to contract formalization and other applicable conditions, placing execution between approval and equipment deployment. For the Middle East, Tower Semiconductor’s March 2025 announcement identified an operating 200 mm foundry facility in Israel and, separately, a silicon-photonics platform in production and ramping to high volume with InnoLight. That Israeli facility provides a local demand base for 200 mm fabrication tools. In Africa, South Africa’s October 16, 2026 tariff schedule sets ordinary customs duty at zero for semiconductor manufacturing machines classified under heading 84.86, excluding that duty from qualifying tools’ landed costs.
Regulatory Framework and Outlook
This comparison of selected jurisdictions assesses conditions for equipment suppliers establishing local operations and serving semiconductor fabs. Licensing in the United States depends on specified items, destinations and known end uses, while China’s equipment-duty relief depends on buyer eligibility and qualifying own use. These conditions make access to buyers and the duration of investment relief commercially relevant alongside the headline policy benefit.
Regulatory Table of Semiconductor Equipment Market
| Decision factor | United States | Germany | China | Brazil | United Arab Emirates | South Africa |
|---|---|---|---|---|---|---|
| Primary authority | Bureau of Industry and Security | Federal Office for Economic Affairs and Export Control (BAFA) | General Administration of Customs and State Taxation Administration | Ministry of Science, Technology and Innovation, through its Secretariat for Science and Technology for Digital Transformation | Ministry of Industry and Advanced Technology and customs authorities | South African Revenue Service and Department of Science and Innovation |
| Key instruments or direction | Export Administration Regulations section 744.23 end-use controls | Regulation (EU) 2021/821; September 2026 equipment additions pending entry into force | Semiconductor self-use equipment import-duty relief through December 31, 2030; annual eligibility | PADIS zero-rating for qualifying fixed-asset machinery and equipment | Industrial-input duty-exemption service; planned Phase 2 R&D incentive assessment | Section 11D 150% deduction for qualifying operational R&D |
| Commercial effect | Licenses required for covered items, destinations and known end uses | Licensing review for covered exports; additional tool categories pending | Eligible own-use imports benefit, excluding goods in the domestic-investment, foreign-investment, and major technical equipment and product catalogs | Relief requires authorized entities, eligible activities and qualifying fixed assets | Prior registration, production license or initial machine approval, and customs review required | Ministerial approval required; operational R&D eligibility runs through December 31, 2033 |
| Current policy attractiveness | Medium | Medium | High | High | Medium | Medium |
| Future direction of policy attractiveness | No change | Hardening | Hardening | No change | Easing | No change |
| Source: Mordor Intelligence | ||||||
For the United States, Medium and No change reflect continuing item- and end-use-based licensing, while Germany’s Medium and Hardening reflect the September 2026 additions awaiting scrutiny and publication. China’s High and Hardening reflect eligible own-use duty relief expiring December 31, 2030, while Brazil’s High and No change reflect conditional PADIS equipment relief with evaluation from 2029 permitting only possible reorientation. UAE Medium reflects conditional machinery-duty relief, while Easing reflects Cabinet Decision 215 of 2025, issued March 18, 2026, allowing UAE-established taxable entities to claim credits for qualifying local R&D for tax periods beginning on or after January 1, 2026, subject to minimum R&D staffing, Emirates Research and Development Council pre-approval, ongoing compliance and bearing R&D costs. South Africa’s Medium and No change reflect section 11D deductions for suppliers’ qualifying local operational R&D through December 31, 2033, subject to ministerial approval, reducing eligible development costs.
Value Chain Stages
The equipment value chain compares critical-component supply, system manufacture and support after installation, each with a different route to supplier earnings. ASML’s 2025 annual report identified Carl Zeiss SMT as its sole critical-optics supplier and said that supplier’s capacity limited lithography-system production. This dependency means demand for ASML’s finished lithography tools can create upstream capacity pressure before conversion into deliveries.
Value Chain Analysis Table of Semiconductor Equipment Market
| Primary activity | Key participants | Value capture | Bottleneck | Resilience response |
|---|---|---|---|---|
| Critical optical-component production | Critical-optics suppliers such as Carl Zeiss SMT | Optical-component sales | Sole-source critical-optics dependency reported by ASML in 2025 | Coordinate optics capacity with downstream system demand |
| Equipment manufacture and delivery | Equipment manufacturers such as ASML Holding N.V., Tokyo Electron Limited | Equipment sales | ASML system builds depend on optics availability | Sequence system builds around confirmed component availability |
| Spares and technical support | Spares and technical-service providers such as ASM International N.V., Tokyo Electron Limited | Spares sales and technical-service revenue | Matching service coverage to deployed tools | Cross-train service teams and position critical spares |
| Source: Mordor Intelligence | ||||
ASM’s Spares & Services revenue grew 18% at constant currencies in 2025, demonstrating a distinct supplier earnings stream after initial equipment sales. Component suppliers capture value from the build, while service providers can participate in the subsequent operation of manufacturing assets. Expansion therefore creates both an immediate production obligation and a longer support opportunity, making installed equipment commercially relevant beyond the original tool sale.
Competitive Landscape
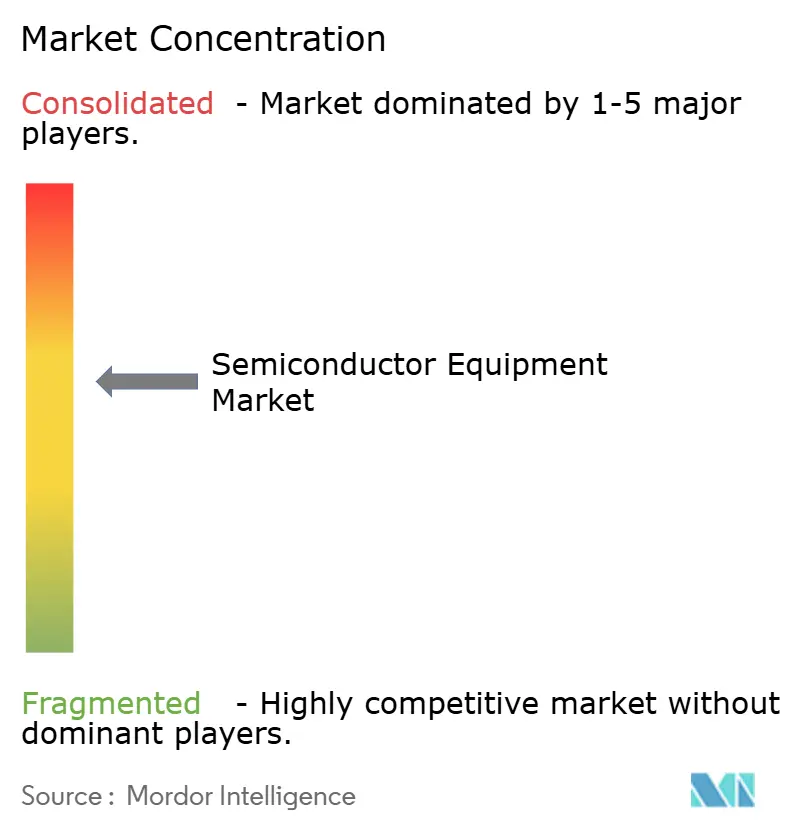
Competition has a moderately concentrated core of specialized suppliers, with production acceptance creating a practical barrier for challengers. Applied Materials, Inc. reported Semiconductor Systems revenue of USD 20.8 billion for the fiscal year ended October 26, 2025, up 4% from fiscal 2024. Lam Research Corporation supplies conductor-etch tools, while Tokyo Electron Limited manufactures semiconductor production equipment. KLA Corporation supplies process-control equipment and related services, and ASML Holding N.V. manufactures lithography systems. KLA’s process-control segment revenue rose 12% in fiscal 2026 and ASML’s total net sales grew 15.6% in 2025, both on leading-edge foundry, logic and memory investment, so these suppliers’ results track the capacity programs their buyers fund.
An installed base and collaborative R&D provide distinct foundations for equipment suppliers’ customer strategies. In its July 29, 2026 presentation for the June quarter, Lam Research reported a conductor-etch installed base of more than 40,000 chambers.[2] Applied Materials announced plans in October 2026 for an EPIC Center in Silicon Valley for collaborative process technology and equipment R&D, with capital spending expected to scale over time to approximately USD 5 billion as customer projects commence. Lam can pursue repeat business from an established production footprint, while Applied Materials’ planned collaboration would engage customers during process development.
Future competition will depend on both alignment with customer manufacturing roadmaps and access to the buyers pursuing them. In September 2026, ASML and Samsung announced expanded collaboration, with Samsung planning High-NA EUV introduction into future DRAM high-volume manufacturing by 2028. Such alignment can give an equipment supplier a role in a customer’s future manufacturing platform before production deployment. KLA warned in its 2026 annual report of possible lost anticipated China revenue unless it replaced orders with business covered by an export license or requiring none. Technical positioning therefore operates alongside regulatory access, with a supplier’s commercial opportunity constrained when prospective demand cannot become eligible orders.
Semiconductor Equipment Industry Leaders
-
Applied Materials, Inc.
-
Lam Research Corporation
-
Tokyo Electron Limited
-
KLA Corporation
-
ASML Holding N.V.
- *Disclaimer: Major Players sorted in no particular order
Semiconductor Equipment Market Companies Covered in this Report
- Applied Materials, Inc.
- ASML Holding N.V.
- Tokyo Electron Limited
- Lam Research Corporation
- KLA Corporation
- SCREEN Holdings Co., Ltd.
- Teradyne, Inc.
- Hitachi High-Tech Corporation
- Veeco Instruments Inc.
- ASM International N.V.
- Canon Inc.
- Nikon Corporation
- Onto Innovation Inc.
- Nova Ltd.
- Advantest Corporation
- Hanmi Semiconductor Co., Ltd.
- DISCO Corporation
- BE Semiconductor Industries N.V.
- Kulicke & Soffa Industries, Inc.
- FormFactor, Inc.
- Plasma-Therm LLC
- SUSS MicroTec SE
- Kokusai Electric Corporation
- Advanced Micro-Fabrication Equipment Inc. (AMEC)
- Naura Technology Group Co., Ltd.
Key Opportunities for Market Participants
These opportunities compare entry into advanced-packaging supply, equipment for new foundry capacity and preparation for future memory-fab installations. In August 2026, SK hynix said it was considering more than 100 companies collectively as materials, components and equipment suppliers for its West Lafayette AI-memory advanced-packaging fab.[3] That selection stage creates a more immediate route to commercial engagement than a construction milestone alone.
Market Opportunities Table of Semiconductor Equipment Market
| Opportunity | Why now | Buyer / lead segment | Recommended play | Main barrier | Likely beneficiaries |
|---|---|---|---|---|---|
| Advanced-packaging supplier entry | Supplier consideration for a new AI-memory packaging fab | SK hynix in West Lafayette | Seek qualification for a defined packaging process | Consideration must convert into supplier selection | Advanced-packaging equipment suppliers such as Tokyo Electron Limited |
| Equipment for new 300 mm foundry capacity | GlobalFoundries announced a Malta fab expected online in 2029 | GlobalFoundries and the foundry segment | Align process-equipment proposals with the new fab’s execution | Revenue conversion depends on a future fab build | Equipment partners such as Tokyo Electron Limited, which described its longstanding GlobalFoundries relationship |
| Deposition preparation for new memory capacity | Micron completed its first concrete pour at Clay on July 9, 2026 | Micron and memory manufacturing | Prepare deposition qualification for later tool installation | Construction must advance before production tools can operate | Deposition-tool suppliers such as ASM International N.V. |
| Source: Mordor Intelligence | |||||
The clearest near-term opening is engagement in packaging supplier selection because the buyer has identified an active consideration process. The foundry and memory projects instead support preparation for equipment demand tied to later facility execution. Equipment suppliers that wait for factory readiness risk entering after supplier choices have been made, making consideration the practical window to present a packaging-process proposal.
Recent Industry Developments in Semiconductor Equipment Market
- Oct 2026: GlobalFoundries announced 2 new fab projects in Malta, New York, including a 300 mm fab expected online in 2029 and a second fab subject to additional investment.
- Oct 2026: Applied Materials announced plans for its EPIC Center in Silicon Valley, dedicated to collaborative semiconductor process technology and manufacturing equipment R&D. Capital spending is expected to scale over time to approximately USD 5 billion as customer projects commence.
- Sep 2026: ASML and Samsung Electronics announced expanded collaboration on High-NA EUV and advanced semiconductor manufacturing technologies, with Samsung planning introduction into future DRAM high-volume manufacturing by 2028.
Semiconductor Equipment Market Report Scope and Research Methodology
Market Definition and Coverage
The semiconductor equipment market covers annual sales revenue from new, factory-built equipment sold worldwide to semiconductor manufacturers and outsourced assembly and test providers for semiconductor production. It counts front-end wafer-fabrication tools and back-end assembly, packaging, and test systems at their sale value. Sales are classified by equipment type, buyer, wafer size, end-use industry, and destination region.
Scope exclusions: Refurbished semiconductor manufacturing equipment, separately sold spare parts and replacement components, separately sold consumables and specialty materials, equipment installation, maintenance, repair and other service fees, and fab construction and cleanroom infrastructure are excluded.
Segments Covered in This Report
- By Equipment Type
- Front-end Equipment
- Lithography Equipment
- Etch Equipment
- Deposition Equipment
- Metrology/Inspection Equipment
- Cleaning Equipment
- Photoresist Processing Equipment
- Other Equipment Types
- Back-end Equipment
- Test Equipment
- Assembly and Packaging Equipment
- Front-end Equipment
- By Supply-Chain Participant
- Integrated Device Manufacturer (IDM)
- Foundry
- Outsourced Semiconductor Assembly and Test (OSAT)
- By Wafer Size
- 300 mm
- 200 mm
- Less than or Equal to 150 mm
- By End-Use Industry
- Computing and Data-Center
- Communications (5G, RF)
- Automotive and Mobility
- Consumer Electronics
- Industrial and Others
- By Geography
- North America
- United States
- Canada
- Mexico
- South America
- Brazil
- Argentina
- Rest of South America
- Europe
- Germany
- United Kingdom
- France
- Italy
- Spain
- Rest of Europe
- Asia-Pacific
- China
- Japan
- India
- South Korea
- ASEAN
- Rest of Asia-Pacific
- Middle East
- Saudi Arabia
- United Arab Emirates
- Rest of Middle East
- Africa
- South Africa
- Nigeria
- Rest of Africa
- North America
Data Sources, Market Sizing, and Validation
Desk Research
Public market context can be assembled from sources such as World Semiconductor Trade Statistics (WSTS) semiconductor sales data, the Semiconductor Equipment Association of Japan's July 2025 equipment forecast, Global Association A's July 2026 mid-year total equipment forecast and Global Association A's December 2025 equipment forecast by segment. These sources help track chip demand, equipment investment and the regional and equipment-category mix that informs semiconductor production spending.
Company annual reports, investor materials, government incentive announcements and reputable semiconductor trade reporting can then clarify capital programs, order timing, buyer roles and manufacturing changes that affect equipment purchases. Such evidence can be checked against the market definition and used to investigate conflicting movements across periods or regions. The named sources are not exhaustive, and further sources inform collection, validation and clarification.
Primary Interviews and Surveys
Interviews and structured surveys with equipment suppliers, semiconductor manufacturers, foundries and outsourced assembly and test providers can clarify purchase timing, replacement cycles and the mix of front-end and back-end systems. Respondents across executive, functional and operating roles can be asked to check secondary evidence and explain gaps in disclosed sales or investment data. Analyst estimates can then be triangulated against public company, association and trade evidence, with unresolved differences carried into review rather than presented as completed consensus.
Distribution of primary research fieldwork respondents
| Company type | Respondent position | Region |
|---|---|---|
| Top tier: 30% | CXOs: 20% | APAC: 50% |
| Mid tier: 45% | Functional/Unit leaders: 35% | EMEA: 30% |
| Smaller Players: 25% | Managers: 45% | Americas: 20% |
Market-Sizing & Forecasting
The model starts with a global top-down estimate of new equipment sales revenue and checks it selectively against supplier revenue roll-ups, reported fab investment and sampled equipment price times unit-volume evidence. It separates front-end wafer-fabrication tools from back-end assembly, packaging and test systems, then builds shares for buyer type, wafer size, end-use industry and destination region from the relevant supplier sales, fab investment and equipment-category evidence. Useful indicators include supplier order and shipment trends, semiconductor manufacturer capital expenditure, wafer-fab investment by region, equipment billings by category, and published wafer-size and end-market mix. Together they help test whether spending is shifting in value or buyer composition. A multivariate regression can relate equipment sales to capital expenditure, wafer-fab investment and semiconductor demand indicators where consistent historical series exist, and scenario analysis can address discontinuities such as subsidy changes, export controls or major technology transitions. Selective bottom-up checks use disclosed supplier sales or sampled price and shipped volume, with gaps bridged from the closest comparable category or period and flagged for analyst review. Primary respondents can check the direction and practical timing of variable-level forecasts, while analysts reconcile differences with the underlying public evidence.
Data Validation & Update Cycle
Analysts triangulate supplier disclosures, equipment billings, fab investment and semiconductor demand indicators, then check year-on-year movements, category shares and regional totals for anomalies against source periods and definitions. A second analyst reviews the calculations and source trail, and the lead analyst resolves unexplained variances before sign-off. Analysts re-contact respondents when a material estimate conflicts with disclosed plans or a later source changes the interpretation. The model is refreshed annually, updated between cycles when a material policy, capacity or technology event changes expected purchases, and given a fresh source and calculation review immediately before delivery.
Mordor Intelligence's Semiconductor Equipment Market Sizing Compared With Other Published Estimates
Published estimates can differ in the transactions and products they count and the inputs used to model demand. The semiconductor equipment market covers annual sales revenue from new, factory-built equipment sold worldwide to semiconductor manufacturers and outsourced assembly and test providers for semiconductor production.
Key Gap Drivers include the study's defined coverage and market-specific modeling choices. Useful indicators include supplier order and shipment trends, semiconductor manufacturer capital expenditure, wafer-fab investment by region, equipment billings by category, and published wafer-size and end-market mix.
Benchmark comparison
| Source | Market Size | Gaps in Research Methodology |
|---|---|---|
| Mordor Intelligence | USD 123.1 B (2027) | |
| Global Association A | USD 165.9 B (2026) | At its 2026 base, this estimate is 34.8% above this report's 2027 value of USD 123.1 B, 1 year later. The association's OEM-sales forecast uses collective supplier input and its equipment billings program. It shows a sharp increase through 2028. That more immediate sales evidence and stronger forecast trajectory can place its 2026 estimate above a later-year estimate. |
| Global Consultancy A | USD 112.4 B (2025) | At its 2025 base, this estimate is 8.7% below this report's 2027 value of USD 123.1 B, 2 years later. Its stated forecast period runs from the 2025 base through 2031, so the earlier measurement year contributes to a lower comparison with a later-year market estimate. |
Mordor Intelligence's analysts triangulate supplier disclosures, equipment billings, fab investment and semiconductor demand indicators, then check year-on-year movements, category shares and regional totals for anomalies against source periods and definitions.
Key Questions Answered in the Report
What is the semiconductor equipment market size and expected growth?
The market was valued at USD 114.8 billion in 2026 and is estimated to grow from USD 123.1 billion in 2027 to USD 179.7 billion by 2032, at a CAGR of 7.86% during 2027-2032.
Which forces drive demand for semiconductor manufacturing tools?
AI-linked memory investment and technology transitions support demand, illustrated by SK hynix’s accelerated M15X schedule in Q2 2026.
Which semiconductor tool category holds the largest share?
Front-end equipment held a 70.6% share in 2026 and is projected to grow at a CAGR of 8.7% during 2027-2032.
Who are the major semiconductor equipment suppliers?
Applied Materials, Inc., Lam Research Corporation, Tokyo Electron Limited, KLA Corporation and ASML Holding N.V. form the leading supplier group.
What constrains the outlook for chipmaking equipment?
Capital-return hurdles and material disruptions can constrain investment and delivery. Intel discontinued its planned German fab expansion in 2025.
Which region leads semiconductor equipment demand?
Asia-Pacific held a 53.34% share in 2026 and is projected to be the fastest-growing geography, at a CAGR of 9.6% during 2027-2032.