
Market Overview
| Study Period | 2020 - 2031 |
|---|---|
| Market Size (2026) | USD 245.67 Billion |
| Market Size (2031) | USD 348.61 Billion |
| Growth Rate (2026 - 2031) | 7.25 % |
| Fastest Growing Market | Asia-Pacific |
| Largest Market | North America |
| Market Concentration | Medium |
Major Players *Disclaimer: Major Players sorted in no particular order Image © Mordor Intelligence. Reuse requires attribution under CC BY 4.0. | |

Active Pharmaceutical Ingredients (API) Market Analysis by Mordor Intelligence
The Active Pharmaceutical Ingredients Market size is estimated at USD 245.67 billion in 2026, and is expected to reach USD 348.61 billion by 2031, at a CAGR of 7.25% during the forecast period (2026-2031).
Aging populations, the persistent rise of chronic illnesses, and surging biologics approvals keep demand strong, yet producer margins hinge on merchant manufacturing uptake, continuous-flow plant deployment, and on-shoring incentives in major economies. Governments in India, the United States, and the European Union disbursed more than USD 4 billion in combined Production Linked Incentive and tax-credit packages between 2024 and 2026, shifting new capacity toward domestic clusters. Contract development and manufacturing organizations (CDMOs) scaled faster than captives because continuous-flow and mini-plant technologies shorten cycle times and cut capital intensity for mid-volume APIs. Intensifying compliance rules, including nitrosamine testing and global GMP harmonization, temporarily raise costs but reinforce the case for larger, better-capitalized suppliers able to absorb regulatory overhead.
Key Report Takeaways
- By API type, synthetic molecules captured a 65.78% revenue share in 2025, while biological APIs are expected to expand at a 9.22% CAGR through 2031.
- By manufacturer model, the merchant segment held 48.27% of the active pharmaceutical ingredients market share in 2025 and is projected to grow at a 9.82% rate through 2031.
- By therapeutic area, oncology APIs are poised to expand at a 10.57% CAGR from 2026 to 2031, outpacing cardiovascular APIs, which held a 28.26% share of the active pharmaceutical ingredients market size in 2025.
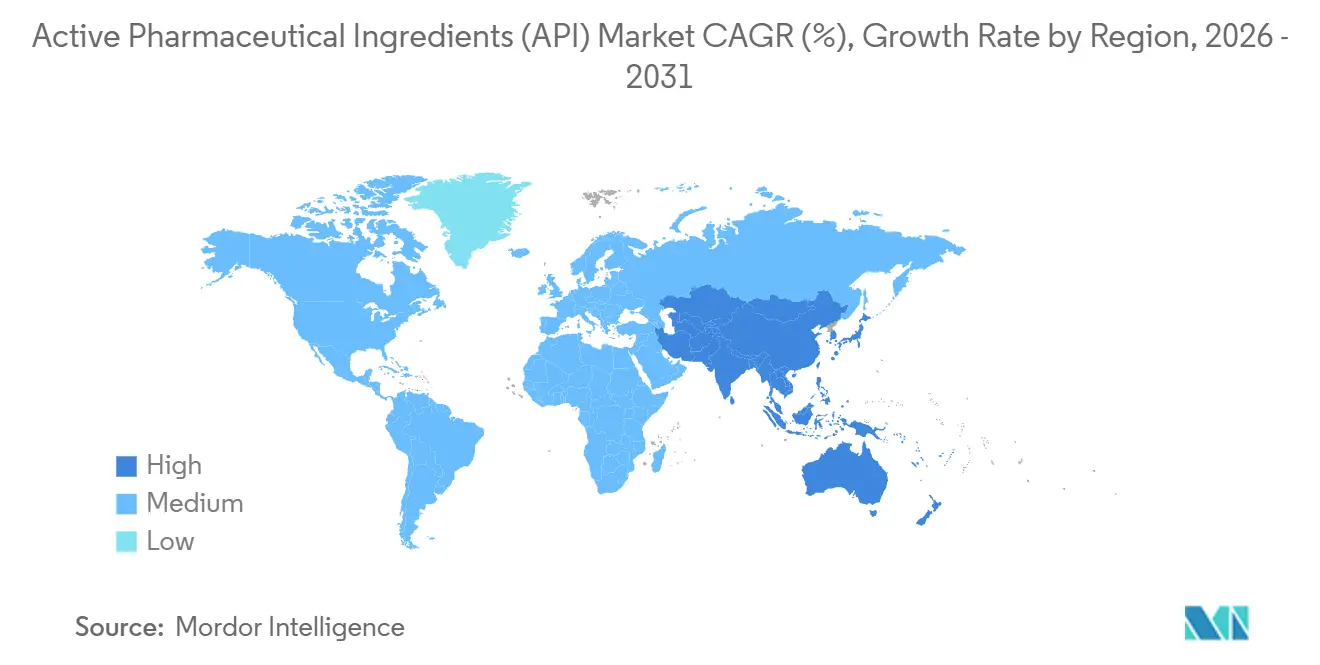
- By geography, Asia-Pacific posted the fastest trajectory with a 10.57% forecast CAGR through 2031, whereas North America commanded 39.64% of the 2025 revenue base.
Note: Market size and forecast figures in this report are generated using Mordor Intelligence’s proprietary estimation framework, updated with the latest available data and insights as of January 2026.
Market Trends and Insights
Drivers Impact Analysis of Active Pharmaceutical Ingredients (API) Market*
| Driver | (~) % Impact on CAGR Forecast | Geographic Relevance | Impact Timeline |
|---|---|---|---|
| Escalating chronic-disease drug demand | +1.8% | Global, peak in North America & Europe | Medium term (2-4 years) |
| Biologics & targeted-therapy pipeline growth | +2.1% | North America, Europe, core APAC markets | Long term (≥4 years) |
| Outsourced manufacturing cost advantages | +1.5% | Global, spill-over to Middle East & Africa | Short term (≤2 years) |
| Continuous-flow & mini-plant uptake | +0.9% | North America, Europe, India | Medium term (2-4 years) |
| Government PLI/on-shoring incentives | +1.2% | India, United States, European Union | Short term (≤2 years) |
| AI-enabled retrosynthesis | +0.7% | North America, Europe | Long term (≥4 years) |
| Source: Mordor Intelligence | |||
Escalating Chronic-Disease Drug Demand
Non-communicable diseases are forecast to increase global prescription volumes by 22% between 2025 and 2030, thereby amplifying baseline API requirements. Indian exports of statin and metformin APIs increased 14% year-over-year in 2025, as European wholesalers pre-built safety stocks. Oncology APIs for checkpoint inhibitors reached USD 12,000 per kilogram in merchant trade in 2025, nearly double the 2023 levels, highlighting the chronic-disease pull on premium molecules. Dedicated fermentation and synthesis lines are being added ahead of forecast demand, marking a departure from prior just-in-time practices.[1] Sizable but uneven spending pressures commodity suppliers, yet innovators with a specialty focus sustain stronger pricing.
Biologics & Targeted-Therapy Pipeline Expansion
Monoclonal antibodies, biosimilars, and antibody-drug conjugates made up 43% of FDA approvals in 2025, up from 31% in 2020.[2] Samsung Biologics brought a 256,000-liter plant online in May 2025 to meet the rising demand for biologics.[3] Lonza invested CHF 1.2 billion in mammalian-cell capacity across Switzerland and the United States, improving scale for advanced modalities. Peptide APIs for GLP-1 agonists still face tightness despite supplier expansion, reflecting rapid uptake in diabetes and obesity therapy. Extended review timelines, often 18-24 months for multi-region filings, remain a gating factor but are gradually easing under evolving biosimilar comparability rules.
Outsourced Manufacturing Cost Advantages
CDMOs can trim total ownership costs by up to 35% through shared utilities, dossier reuse, and flexible batch scheduling. WuXi AppTec reported 19% API revenue growth for the twelve months ended June 2025, primarily driven by North American biotech clients. Piramal Pharma Solutions added OEB-5 suites in Ahmedabad in March 2025 to support high-potency oncology programs. Rising regulatory overhead, including nitrosamine testing, favors merchant partners able to amortize compliance costs across large portfolios. As venture-backed firms shun capital-intensive assets, outsourced models gain momentum.
Continuous-Flow & Mini-Plant Technologies Gain Traction
Continuous reactors compress reaction times from hours to minutes and reduce solvent use by up to 60%, aligning with FDA Quality-by-Design expectations. Pfizer CentreOne’s Michigan line cut batch-release cycles by 30% after the August 2024 retrofit. Cambrex, via its Snapdragon unit, commercialized photochemical flow systems capable of novel C–H activation routes for oncology intermediates. A 2025 EMA draft clarified validation rules for continuous processes, accelerating European adoption. Modular mini-plants, capable of producing 10–50 kg per day, are proliferating in India and China, offering rapid clinical-stage supply without the need for mega-site lead times.
Restraints Impact Analysis of Active Pharmaceutical Ingredients (API) Market*
| Restraint | (~) % Impact on CAGR Forecast | Geographic Relevance | Impact Timeline |
|---|---|---|---|
| Rising global GMP & nitrosamine compliance | −0.9% | Global, acute in Europe & North America | Short term (≤2 years) |
| Generic-price compression | −1.1% | North America, Europe, emerging markets | Medium term (2-4 years) |
| Supply-chain opacity | −0.6% | Global, concentrated in Asia sourcing | Medium term (2-4 years) |
| Complex biotech regulatory harmonization | −0.5% | Multi-region filings, APAC & MEA delays | Long term (≥4 years) |
| Source: Mordor Intelligence | |||
Rising Global GMP & Nitrosamine-Control Compliance Costs
Mandatory nitrosamine testing, fully enforced from 2024, adds USD 150,000–300,000 per dossier and triggered 483 FDA observations at Indian and Chinese sites between 2024 and 2025. EMA aligned thresholds with the FDA in March 2025, removing lower-cost regulatory arbitrage. Smaller firms often lack the funds for high-resolution mass spectrometry upgrades, which accelerates consolidation. Commodity suppliers struggle to pass through new costs, whereas innovators embed compliance expense into project budgets.
Generic-Price Compression Squeezing API Margins
Average U.S. generic-drug prices fell 37% between 2020 and 2025, driven by PBM consolidation and aggressive state tenders. Indian API exporters experienced a decline in gross margins, dropping to 18-22% in 2025 compared to 26-30% in 2020. Dr. Reddy’s exited three generic lines in 2024 to focus on higher-potency niches. European hospital antibiotic bids in 2025 came in 40% below 2023 levels, forcing low-cost relocation strategies. Biologics and HPAPIs partly offset erosion due to higher complexity and fewer qualified suppliers.
*Our forecasts treat driver/restraint impacts as directional, not additive. The impact forecasts reflect baseline growth, mix effects, and variable interactions.
Active Pharmaceutical Ingredients (API) Market Segment Analysis
By API Type:
Biologics Outpace Synthetics as Pipelines EvolveSynthetic APIs held 65.78% revenue in 2025, anchored by small-molecule generics for cardiovascular and metabolic therapy, while biologics are slated to post a 9.22% CAGR to 2031, a trend that will raise the biologics share of the active pharmaceutical ingredients market size to nearly one-third. Highly potent APIs increased by 8.1% in 2025 as antibody-drug conjugate payloads advanced, prompting the development of new OEB-5 suites at Lonza and Piramal.
Developers favor biologics for their extended exclusivity and differentiated mechanisms, but large-scale capacity remains concentrated in a handful of players, which keeps average sell prices high. Synthetic producers counter by moving toward continuous-flow and green-chemistry routes that cut solvent waste and shrink batch footprints. Sustainable-sourcing certifications are increasingly influencing purchasing decisions for natural or phytochemical APIs, a small yet image-sensitive niche.


By Manufacturer Model:
Merchant Gains as Innovators Shed AssetsCaptive plants commanded 51.73% of 2025 revenue, but merchant producers are set to grow faster, lifting their slice of the active pharmaceutical ingredients market to more than 55% by 2031. WuXi AppTec’s 19% annual API sales gain illustrates the pivot, with biotech clients leveraging its regulatory files to avoid capital outlays.
Integrated drug makers maintain select captive lines for intellectual property control, yet fixed costs and underutilization prompt asset sales or hybrid agreements. CDMOs absorb compliance risk and offer faster scale-up, while real-time analytics and AI design tools reduce per-batch engineering, widening the cost gap versus in-house plants.
By Molecule Size:
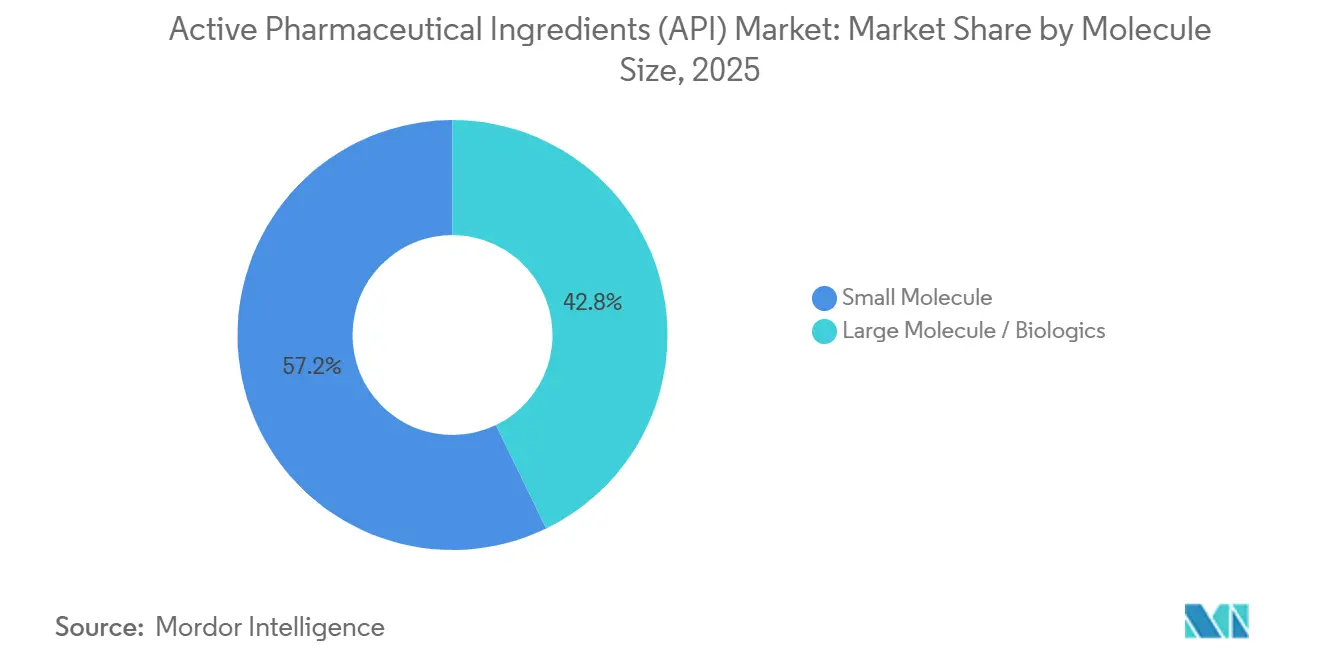
Large Molecules Gain ShareSmall molecules comprised 57.18% of the volume in 2025; however, large molecules are projected to grow at 8.06% through 2031, raising their portion of the active pharmaceutical ingredients market share to near parity by the end of the period. Novo Nordisk and Eli Lilly both expanded peptide lines after GLP-1 demand strained supply, with Lilly investing USD 1.8 billion in North Carolina.
Monoclonal antibodies average USD 3,500–6,000 per gram, reflecting the upstream complexity and rigorous viral-clearance validation, whereas commodity small molecules continue to face price pressure. Process intensification and single-use systems are narrowing cost gaps for biologics, supporting sustained momentum in large-molecule output.
By Therapeutic Area:
Oncology Leads GrowthCardiovascular APIs accounted for 28.26% of 2025 revenue, but oncology is expected to expand at a 10.57% CAGR through 2031, thereby increasing its contribution to the active pharmaceutical ingredients market size by mid-forecast. Twelve antibody-drug conjugates cleared the FDA in 2024-2025, each requiring high-potency payload manufacture under strict containment, restricting the supplier field to specialized CDMOs.
Metabolic disorder APIs grew, driven by the combined uptake of diabetes and obesity therapies. Infectious-disease APIs lag due to aggressive tenders, while CNS molecules continue to track steady mid-single-digit growth, supported by mental-health initiatives.
Geography Analysis
North America Active Pharmaceutical Ingredients (API) Market
North America captured 39.64% of the 2025 revenue in the active pharmaceutical ingredients market, driven by Pfizer CentreOne's expansions and the FDA's expedited pathways, which shave 6–9 months off oncology API timelines. The Inflation Reduction Act’s credit structure encourages the co-location of API and finished-dosage lines, as evident in AbbVie’s USD 1.5 billion biologics upgrade in Massachusetts, completed in March 2025. Canada’s regulatory alignment with the FDA speeds Drug Master File approvals, supporting modest domestic growth, while Mexico attracts European CDMOs seeking U.S. proximity through new Monterrey capacity at Recipharm.
Europe Active Pharmaceutical Ingredients (API) Market
Europe will benefit from the forthcoming Critical Medicines Act aimed at 15 essential APIs, though high labor costs temper expansion. Lonza invested CHF 1.2 billion in Swiss and UK sites through 2025, with a focus on mammalian cell and viral vector production. Post-Brexit MHRA rolling-review rules accelerate UK approvals, but dual compliance with EMA standards raises costs for cross-border suppliers. France, Italy, and Spain collectively utilize reshoring grants to revive their antibiotic and sterile-injectable lines, thereby balancing earlier offshoring to Asia.
APAC Active Pharmaceutical Ingredients (API) Market
The Asia-Pacific region is forecast to grow at 10.57% through 2031, the fastest among regions, driven by India’s PLI outlays and China’s shift from commodity to high-potency oncology intermediates. China’s NMPA issued 62 warning letters in 2024-2025, driving facility upgrades but also brief supply disruptions. Japan remains a specialty-API hub, with Fujifilm Diosynth expanding cell-culture capacity, while South Korea’s Samsung Biologics plant cements the country’s biosimilar prominence.
Regulatory Landscape
API manufacturing is governed by global GMP expectations anchored in ICH Q7 and implemented through regulator inspections and dossier-based controls, including DMFs. Since 2024, mandatory nitrosamine testing has increased compliance costs and inspection scrutiny across major exporting bases. In March 2025, the EMA aligned nitrosamine thresholds with the FDA, narrowing scope for lower-cost compliance pathways and strengthening the position of suppliers with strong analytical infrastructure.
In 2026, regulators added further requirements tied to modernization and traceability. The FDA expanded oversight and advanced-manufacturing enablement through activities linked to its Advanced Manufacturing Technologies (AMT) Designation Program (section 506L of the FD&C Act), while also proposing updates to establishment registration for distributed manufacturing and mandating registration for certain foreign API-producing facilities. In Europe, the EMA moved ahead with ISO IDMP implementation via the Product Management Service (PMS), including a June 2026 beta release of a public PMS API and a roadmap toward decommissioning legacy xEVMPD and moving to full write capabilities using FHIR-based exchange, which increases the need for structured product and substance data readiness for API-linked filings.
Competitive Landscape
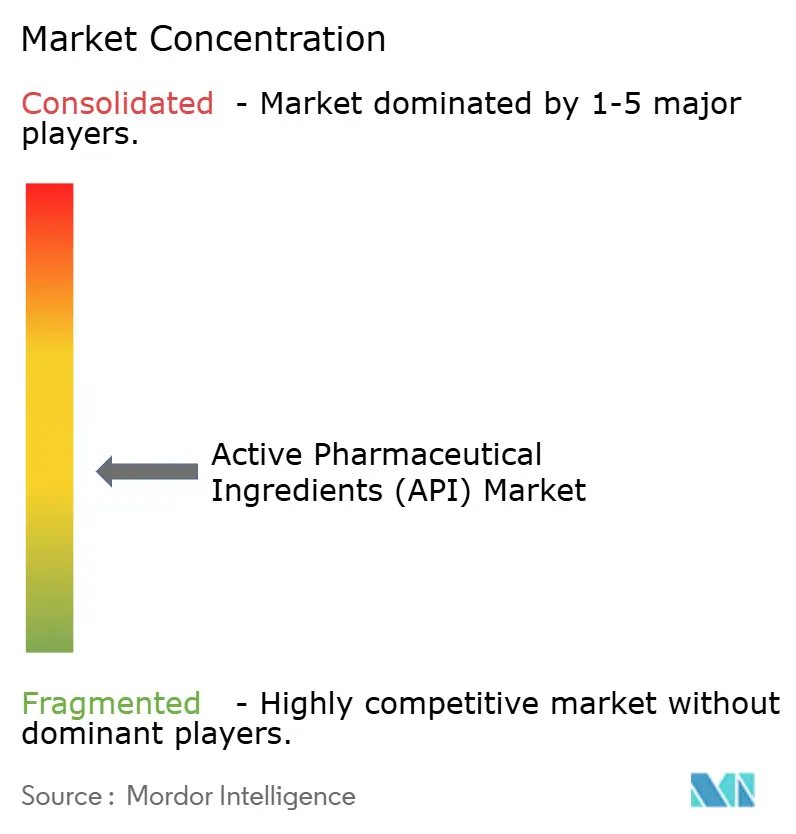
The active pharmaceutical ingredients market is moderately fragmented. WuXi AppTec, Lonza, and Samsung Biologics jointly invested USD 4.8 billion between 2024 and 2026 to expand capacity and introduce new technology, thereby compressing clinical-stage lead times to 12–16 months. GSK’s 2024 divestiture of its UK cephalosporin plant to Recipharm typifies large pharma offloading lower-margin assets while safeguarding biologics lines.
White-space opportunities cluster in cell- and gene-therapy APIs such as viral vectors and lipid nanoparticles, where only a handful of firms possess commercial capacity. Green chemistry routes that reduce Scope 3 emissions also differentiate suppliers as drug makers set climate targets. Emerging disruptors such as Snapdragon Chemistry advance photochemical flow reactors, enabling previously uneconomical transformations at scale. Evonik’s bio-surfactant excipients offer petroleum-free alternatives, securing the first FDA filings in 2025.
Regulatory compliance and pre-approved Drug Master Files form durable moats, allowing certified CDMOs to command 10–15% price premiums. AI integration into process development further segments leaders from followers, with WuXi AppTec reporting 25% quicker route design after deploying retrosynthesis tools in 2025.
Active Pharmaceutical Ingredients (API) Industry Leaders
-
Teva Pharmaceutical Industries Ltd
-
Pfizer Inc.
-
Merck KGaA
-
BASF SE
-
Viatris, Inc.
- *Disclaimer: Major Players sorted in no particular order
Active Pharmaceutical Ingredients (API) Market Companies Covered in this Report
- Abbvie
- Aurobindo Pharma
- BASF
- Boehringer Ingelheim
- Cambrex
- Catalent
- Cipla
- Dr. Reddy’s Laboratories
- GlaxoSmithKline
- Lonza Group
- Merck
- Novartis
- Pfizer CentreOne
- Piramal Group
- Recipharm
- Samsung Group
- Siegfried AG
- Sun Pharmaceuticals Industries
- Teva Pharmaceutical Industries
- WuXi App Tec
Read Analysis of Active Pharmaceutical Ingredients (API) Companies
Market Opportunities and Future Outlook
Near-term whitespace centers on investments that reduce supply risk and shorten tech-transfer timelines for complex drug substances, especially high-potency and biologics-adjacent APIs. AbbVie announced a USD 380 million build-out of two new API facilities at its North Chicago campus in February 2026. Eli Lilly committed an additional USD 4.5 billion across Indiana manufacturing sites in May 2026, supporting demand for regionalized networks where drug makers can manage lead times and change-control for critical molecules.
CDMOs and specialist manufacturers also have room to differentiate via advanced processing and compliance-by-design, backed by both capacity projects and regulatory digitization. Evonik outlined a USD 100 million, five-year modernization plan for its Tippecanoe Labs drug-substance site in Indiana in July 2026 and an 80 million euro fermentation upgrade in Slovakia in April 2026, while Cambrex completed engineering studies for a new 140,000-liter API plant in Iowa in March 2026. Alongside these capex signals, 2026 regulatory steps, including the FDA proposal addressing distributed manufacturing registration and the EMA transition toward ISO IDMP-aligned PMS data exchange, support demand for standardized, inspection-ready data packages and validated process controls, creating room for suppliers that can combine capacity with digital submission readiness and modern manufacturing toolkits.
Recent Industry Developments in Active Pharmaceutical Ingredients (API) Market
- June 2026: Teva announced 250 layoffs at its TAPI active pharmaceutical ingredients division in Neot Hovav, Israel, after a prolonged attempt to divest the unit did not conclude as planned. The action points to margin pressure in parts of the commoditized API base and suggests tighter capacity discipline among large generic-linked producers.
- October 2025: Merck KGaA announced plans to cease API manufacturing at its Arklow, Ireland plant by the end of 2028 following a strategic portfolio review. The decision reflects continued rationalization of lower-return API assets and a shift toward higher-value modalities and sites with stronger scale economics.
- October 2024: Merck announced a EUR 70 million investment to expand and triple antibody-drug conjugate (ADC) manufacturing capacity at its facility in St. Louis, Missouri. The expansion targets complex oncology supply chains where high-potency handling, containment, and specialized know-how limit the qualified supplier base.
Active Pharmaceutical Ingredients (API) Market Report Scope and Research Methodology
Market Definition and Coverage
This market covers the value of active pharmaceutical ingredients (APIs) sold as drug substances, across synthetic and biotech routes, used in human medicines across all regions.
Scope exclusions: We do not count excipients, finished dosage forms, veterinary APIs, diagnostic reagents, or in-process intermediates.
Segments Covered in This Report
- By API Type
- Synthetic APIs
- Biological APIs
- Highly-Potent APIs (HPAPIs)
- Natural / Phytochemical APIs
- By Manufacturer Model
- Captive / In-house
- Merchant / Outsourced
- By Molecule Size
- Small Molecule
- Large Molecule / Biologics
- By Therapeutic Area
- Oncology
- Cardiovascular
- Infectious Diseases
- Metabolic Disorders
- CNS & Neurology
- Other Therapeutic Area
- By Geography
- North America
- United States
- Canada
- Mexico
- Europe
- Germany
- United Kingdom
- France
- Italy
- Spain
- Rest of Europe
- Asia-Pacific
- China
- Japan
- India
- Australia
- South Korea
- Rest of Asia-Pacific
- Middle East & Africa
- GCC
- South Africa
- Rest of Middle East & Africa
- South America
- Brazil
- Argentina
- Rest of South America
- North America
Data Sources, Market Sizing, and Validation
Desk Research
Desk work starts with building the demand and supply context for APIs, then aligning it to how drug substances are traded, manufactured, and regulated across regions. Public sources help us set reliable anchors, such as pharma output levels, trade flows, and the manufacturing footprint, before assumptions are tested through interviews.
Common references include sources such as the US FDA and EMA databases for approvals and manufacturing expectations, the WHO for essential medicines context, UN Comtrade for API-linked trade patterns, OECD health statistics for medicines consumption signals, and the World Bank for macro and currency series. We also review annual reports, 10-K style filings, investor presentations, trade association publications, and reputable press coverage. For select companies, we cross-check financial statements and patent activity using paid subscriptions for company intelligence and patent databases. The sources listed here are illustrative and not exhaustive, and many other documents were used for data collection, validation, and clarification.
Primary Interviews and Surveys
Primary discussions were run with a mix of API manufacturers, contract producers, distributors, and downstream buyers, so the pricing logic and volume movement could be interpreted in concrete terms. Respondent inputs were captured across APAC, EMEA, and the Americas, and follow-ups were done when desk signals and interview responses did not align on capacity changes, utilization, or inflation pass-through.
Distribution of primary research fieldwork respondents
| Company type | Respondent position | Region |
|---|---|---|
| Top tier: 28% | CXOs: 16% | APAC: 51% |
| Mid tier: 52% | Functional/Unit leaders: 24% | EMEA: 30% |
| Smaller Players: 20% | Managers: 60% | Americas: 19% |
Market-Sizing & Forecasting
Sizing uses a top-down build where pharma production and trade data are used to reconstruct the API demand pool, and then it is translated into value using region-appropriate price and mix assumptions. To keep the totals practical, we corroborate the outcome with selective bottom-up approximations, such as sampled ASP times volume checks for key API groups and supplier and channel checks in major producing countries, then adjust where the two views disagree.
The model relies on a short list of inputs that can be tracked consistently: prescription and genericization trends, manufacturing capacity additions and utilization changes, API price movement (including solvent and key chemical feedstock pressure), regulatory actions that shift supply availability, and import-export shifts by major hubs. Where data is thin for smaller producing countries, we fill gaps with regional proxy ratios tied to pharma output and trade intensity, and then normalize through expert checks.
For forecasting, we run scenario analysis around demand growth, price realization, and supply tightness. The scenario weights are set after triangulating consensus views from interviewees. The final time series is smoothed so one-off shocks do not overstate the long-term trend, while still showing step changes when capacity or regulatory events persist.
Data Validation & Update Cycle
Outputs are validated through multiple checks, including consistency against independent indicators such as pharma output growth, API-linked trade direction, and capacity announcements, before the numbers are signed off. Large variances are flagged, reviewed by another analyst, and then traced back to re-check assumptions on currency timing and unit pricing.
The study is refreshed annually, and interim updates are triggered when material events occur, such as major plant shutdowns, regulatory actions, or sharp changes in input costs that affect API pricing. Before delivery, we run a final pass on recent news, public filings, and trade signals so clients receive an updated view rather than an older snapshot.
Mordor Intelligence's Global Active Pharmaceutical Ingredients API Market Size Compared Against Other Published Estimates
Published API market values often differ because teams do not always measure the same thing, even when the title looks similar. Differences usually come from what is counted as an API, which pricing point is used, what base year currency is assumed, and how quickly models are refreshed after supply and regulatory events.
The benchmark table shows a clear spread, and in Mordor Intelligence's model the value is tied to ex-factory drug substance sales for human therapeutics, which keeps finished dosage forms, excipients, veterinary APIs, and in-process intermediates out of scope. Other estimates can also move higher or lower depending on whether they include broader pharmaceutical chemicals, apply more aggressive price escalation, or rely on older base-year conversions that do not reflect recent mix shifts between small and large molecules.
Benchmark comparison
| Source | Market Size | Gaps in Research Methodology |
|---|---|---|
| Mordor Intelligence | USD 245.67 B (2026) | |
| Global Consultancy A | USD 270.53 B (2025) | Uses a different base year and may apply a broader revenue boundary for APIs across segments, which can shift totals when mix and regional pricing differ, and when currency timing is not aligned to the study year. |
| Trade Journal B | USD 240.80 B (2024) | Often reflects a press-released snapshot with limited visibility on exclusions and price basis, so changes in API pricing and supply conditions between 2024 and 2026 are not fully carried into the reported value. |
Reading the three figures together, most of the gap comes from scope edges, base-year choice, and how price and mix are carried forward. A consistent definition, repeatable variables, and clear year alignment make the final number easier to audit and reuse in planning.
Key Questions Answered in the Report
What is the projected value of the active pharmaceutical ingredients market by 2031?
The market is expected to reach USD 348.61 billion by 2031, growing at a 7.25% CAGR.
Which segment will post the fastest growth through 2031?
Oncology APIs are forecast to grow at a 10.57% CAGR, the highest among therapeutic areas.
How quickly are biologics APIs expanding compared to synthetic APIs?
Biologics APIs are projected to rise at 9.22% CAGR, versus mid-single-digit growth for synthetics, reflecting pipeline shifts toward complex modalities.
Which region will lead growth in the next five years?
Asia-Pacific is set to post a 10.57% CAGR through 2031, outpacing all other regions due to capacity additions and cost advantages.
Why are CDMOs gaining share in API production?
Outsourcing offers up to 35% cost savings, faster regulatory timelines through pre-approved dossiers, and flexibility that suits asset-light innovator strategies.