飼料顔料市場規模

|
|
調査期間 | 2017 - 2029 |
|
|
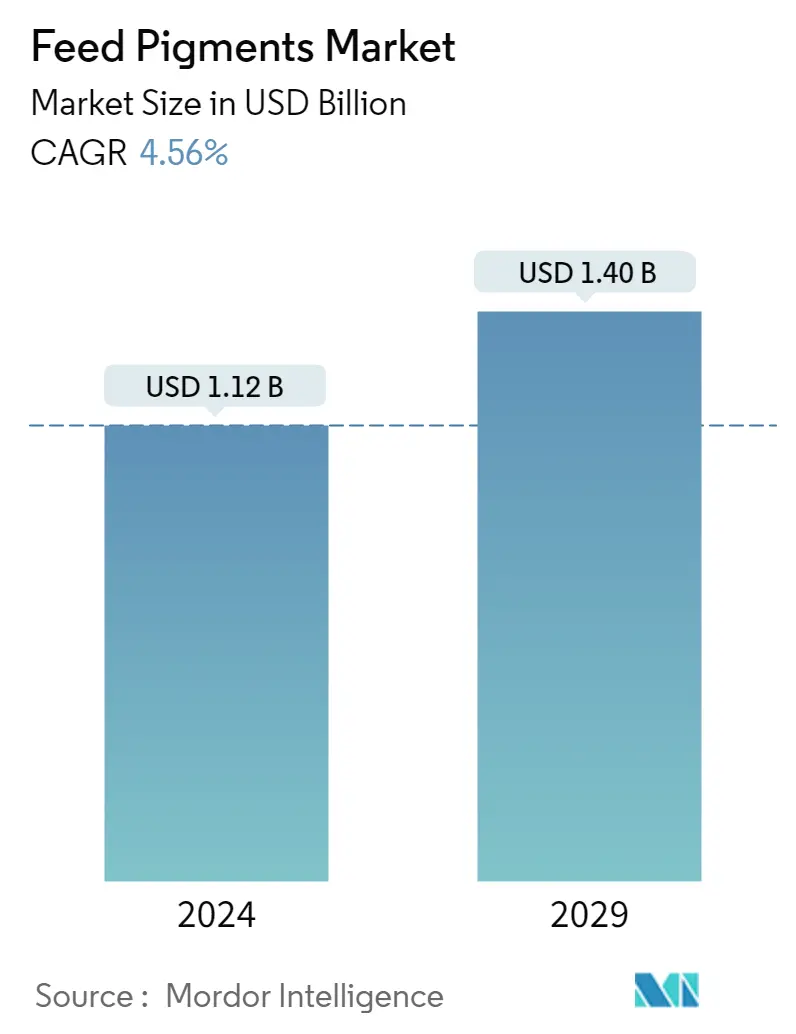
市場規模 (2024) | USD 11.2億ドル |
|
|
市場規模 (2029) | USD 14億ドル |
|
|
市場集中度 | 低い |
|
|
副添加剤別トップシェア | カロテノイド |
|
|
CAGR(2024 - 2029) | 4.56 % |
主要プレーヤー |
||
|
|
||
|
*免責事項:主要選手の並び順不同 |
飼料顔料市場分析
飼料顔料市場規模は4.56%年に11.2億米ドルと推定され、2029年までに14.0億米ドルに達すると予測されており、予測期間(2024年から2029年)中に4.57%のCAGRで成長します。
カロテノイドは最大の添加物
- 飼料用顔料は、嗜好性を改善し、有機的特徴を強化し、動物に健康上の利点を提供する上で重要な役割を果たしている。飼料用顔料は2022年に世界の飼料添加物市場の3.1%を占めた。あらゆる動物の健康維持に欠かせないものである。
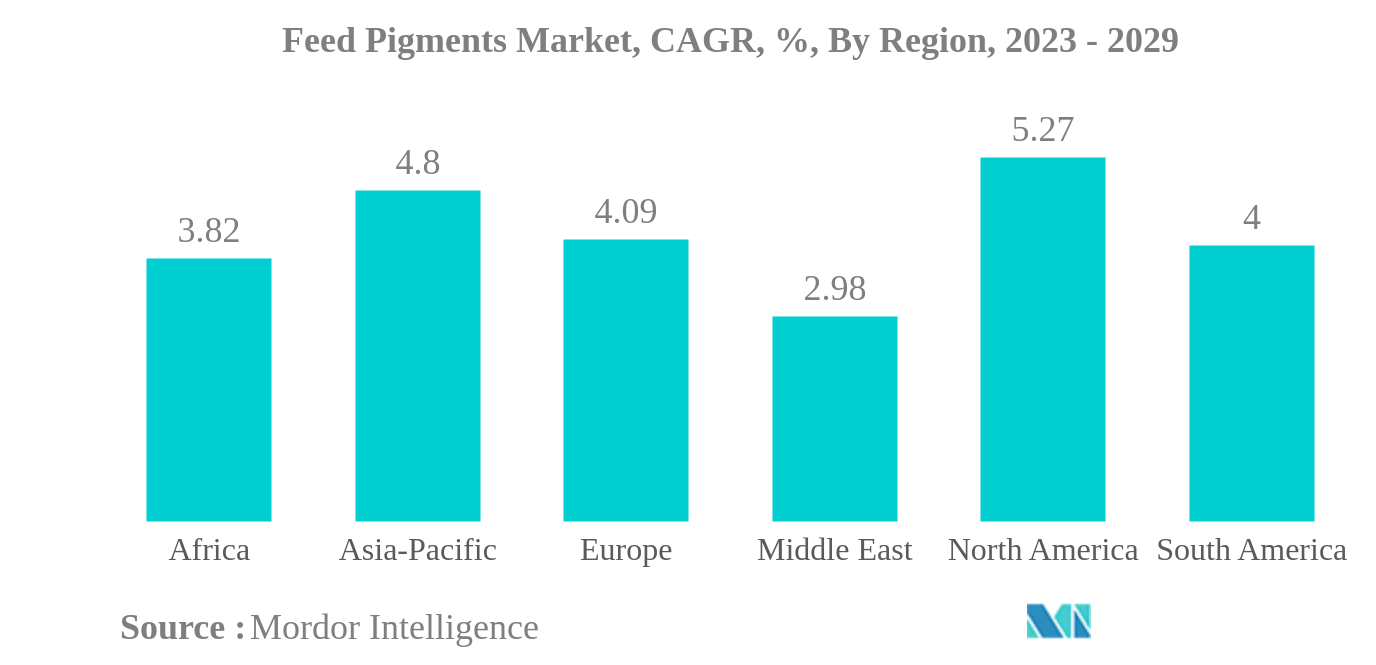
- アジア太平洋地域は、2022年の飼料顔料市場で最大のシェアを占めた。同地域は2022年に世界市場の31.5%を占めた。アジア太平洋地域に続いて、北米とヨーロッパがそれぞれ世界市場の25.4%と23.6%を占めている。アジア太平洋地域は、添加物の浸透率が深く、動物人口が多いため、より大きなシェアを占めている。
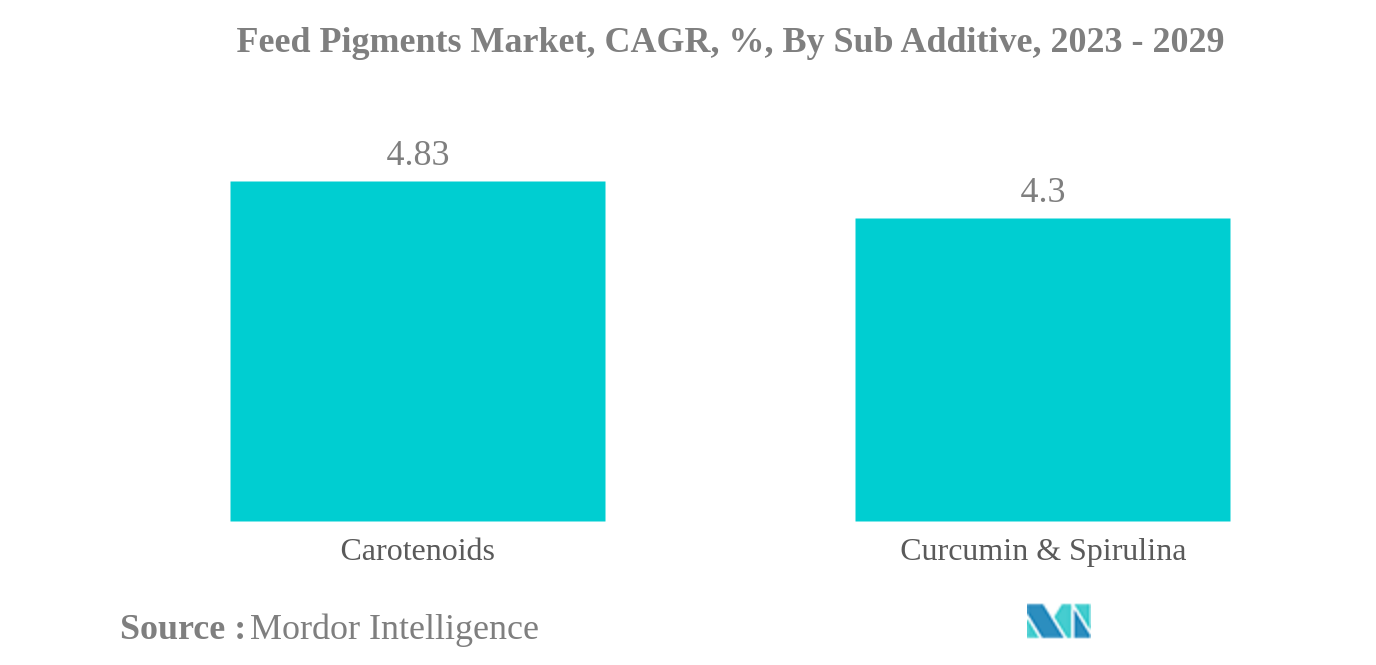
- カロテノイドは動物が消費する最大の飼料色素である。2022年の市場規模は5.2億米ドルで、クルクミンとスピルリナがこれに続く。カロテノイドは、動物を様々な病気から守り、免疫システムを強化する抗酸化物質として作用する。
- 家禽セグメントは、飼料顔料の最大の消費者であった。家禽の成長と生産性における顔料の重要性により、2022年には飼料用顔料の世界市場の65.1%を占めた。
- 予測期間中、クルクミンとスピルリナ分野はCAGR 4.3%を記録すると予想されている。これらは酵素活性、動物のパフォーマンス、卵の品質、動物の抗酸化状態を改善する。クルクミンを含む色素ベースの飼料は、子羊の体重増加、生産成績、代謝、免疫力を大幅に改善することができる。
- 飼料添加物の有益な使用法に関する意識の高まり、家畜人口の増加、食肉・乳製品用の商業的農業の増加が、世界の飼料用顔料市場を牽引すると予想される。同市場は予測期間中にCAGR 4.6%を記録すると予想される。
アジア太平洋地域が最大
- 世界の飼料添加物市場は、2022年に飼料添加物としての顔料の利用が低いことを目撃した。これは主に顔料のコストが高いためで、商業畜産業者にとっては高価な選択肢となっている。しかし、顔料は、その色を改善することによって、肉や他の動物製品の市場価値を高めることが知られている。顔料セグメントは、2022年の世界の飼料添加物市場の3.1%を占めた。
- 顔料の種類の中では、カロテノイドとクルクミンとスピルリナが最も顕著なセグメントとして浮上し、金額ベースで世界の顔料市場でそれぞれ51.1%と48.9%のシェアを占めている。これら両分野は予測期間中に急成長が見込まれ、年平均成長率はそれぞれ4.8%と4.3%である。
- アジア太平洋地域は、2022年の飼料用顔料の世界市場において最大の地域セグメントであり、3億米ドルのシェアを占めている。高い普及率と約5億トンに達する飼料生産量の増加が、この地域の成長の主な原動力となった。一方、米国は国別では世界最大の飼料用顔料市場に浮上し、2022年の世界市場シェアの17.8%を占め、ほぼ1.8億米ドルに相当する。中国とブラジルが米国に続き、それぞれ13.7%と7%のシェアを占めている。
- タイは世界の飼料用顔料市場で最も急成長している国であり、予測期間中のCAGRは5.9%を記録すると予想されている。天然の抗生物質特性を持つクルクミンと、タンパク質生産を強化するスピルリナの使用量が増加していることから、予測期間中のCAGRは4.6%となり、飼料用顔料の世界市場を牽引すると予想される。
飼料用顔料産業の概要
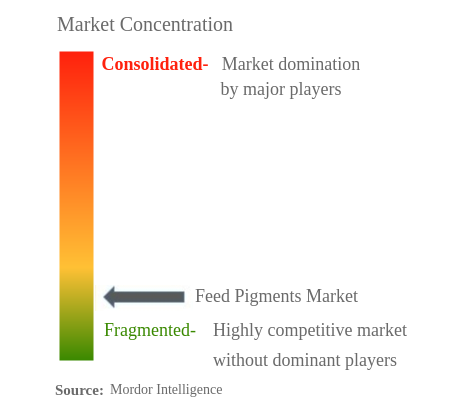
飼料用顔料市場は細分化されており、上位5社で30.95%を占めている。この市場の主要プレーヤーは、BASF SE、Bordas S.A.、DSM Nutritional Products AG、Nutrex NV、Synthite Industries Pvt. Ltd(アルファベット順)である。
飼料用顔料市場のリーダー
BASF SE
Bordas S.A.
DSM Nutritional Products AG
Nutrex NV
Synthite Industries Pvt. Ltd
*免責事項:主要選手の並び順不同
飼料用顔料市場ニュース
- September 2022 DSMはブラジルの大手動物栄養・技術企業であるProdap社を買収した。この戦略により、同社は技術提供、コンサルティングサービス、専門的な栄養ソリューションを組み合わせ、畜産の効率と持続可能性を向上させる。
- 2022年7月 インペクストラコはメキシコの施設を拡張し、製品の保管スペースとビジネスチャンスを向上させ、同国におけるインペクストラコブランドの存在感を高めた。
- 2022年5月 ケミン・インダストリーズはメキシコに新しいオフィスと配送センターを開設し、最高品質のサービスとカスタマイズされたソリューションを提供することで、ケミンアニマルニュートリションに貢献。
飼料用顔料市場レポート-目次
1. 導入
1.1. 研究の前提条件と市場の定義
1.2. 研究の範囲
1.3. 研究方法
2. 主要な業界トレンド
2.1. 動物の頭数
2.2. 飼料の生産
2.3. 規制の枠組み
2.4. バリューチェーンと流通チャネルの分析
3. 市場セグメンテーション
3.1. 副添加剤
3.1.1. カロテノイド
3.1.2. クルクミンとスピルリナ
3.2. 動物
3.2.1. 水産養殖
3.2.1.1. サブアニマル別
3.2.1.1.1. 魚
3.2.1.1.2. エビ
3.2.1.1.3. その他の水産養殖種
3.2.2. 家禽
3.2.2.1. サブアニマル別
3.2.2.1.1. ブロイラー
3.2.2.1.2. 層
3.2.2.1.3. その他の家禽類
3.2.3. 反芻動物
3.2.3.1. サブアニマル別
3.2.3.1.1. 肉牛
3.2.3.1.2. 乳牛
3.2.3.1.3. その他の反芻動物
3.2.4. 豚
3.2.5. 他の動物
3.3. 地域
3.3.1. アフリカ
3.3.1.1. 国別
3.3.1.1.1. エジプト
3.3.1.1.2. ケニア
3.3.1.1.3. 南アフリカ
3.3.1.1.4. アフリカの残りの部分
3.3.2. アジア太平洋地域
3.3.2.1. 国別
3.3.2.1.1. オーストラリア
3.3.2.1.2. 中国
3.3.2.1.3. インド
3.3.2.1.4. インドネシア
3.3.2.1.5. 日本
3.3.2.1.6. フィリピン
3.3.2.1.7. 韓国
3.3.2.1.8. タイ
3.3.2.1.9. ベトナム
3.3.2.1.10. 残りのアジア太平洋地域
3.3.3. ヨーロッパ
3.3.3.1. 国別
3.3.3.1.1. フランス
3.3.3.1.2. ドイツ
3.3.3.1.3. イタリア
3.3.3.1.4. オランダ
3.3.3.1.5. ロシア
3.3.3.1.6. スペイン
3.3.3.1.7. 七面鳥
3.3.3.1.8. イギリス
3.3.3.1.9. ヨーロッパの残りの部分
3.3.4. 中東
3.3.4.1. 国別
3.3.4.1.1. イラン
3.3.4.1.2. サウジアラビア
3.3.4.1.3. 中東の残りの地域
3.3.5. 北米
3.3.5.1. 国別
3.3.5.1.1. カナダ
3.3.5.1.2. メキシコ
3.3.5.1.3. アメリカ
3.3.5.1.4. 北米のその他の地域
3.3.6. 南アメリカ
3.3.6.1. 国別
3.3.6.1.1. アルゼンチン
3.3.6.1.2. ブラジル
3.3.6.1.3. チリ
3.3.6.1.4. 南アメリカの残りの地域
4. 競争環境
4.1. 主要な戦略的動き
4.2. 市場シェア分析
4.3. 会社の風景
4.4. 会社概要
4.4.1. BASF SE
4.4.2. Bordas S.A.
4.4.3. DSM Nutritional Products AG
4.4.4. EW Nutrition
4.4.5. Impextraco NV
4.4.6. Innov Ad NV/SA
4.4.7. Kemin Industries
4.4.8. Nutrex NV
4.4.9. Synthite Industries Pvt. Ltd
4.4.10. Vitafor Belgium
5. 飼料添加物のCEO向けの重要な戦略的質問
6. 付録
6.1. グローバルな概要
6.1.1. 概要
6.1.2. ポーターのファイブ・フォース・フレームワーク
6.1.3. グローバルバリューチェーン分析
6.1.4. 世界市場規模とDRO
6.2. 出典と参考文献
6.3. 表と図のリスト
6.4. 主な洞察
6.5. データパック
6.6. 用語集
表と図のリスト
- 図 1:
- 飼料用顔料の世界市場、家禽別の頭数、数、2017-2022年
- 図 2:
- 飼料用顔料の世界市場、動物頭数、数、反芻動物別、2017-2022年
- 図 3:
- 飼料用顔料の世界市場、豚頭数、頭数、豚別、2017-2022年
- 図 4:
- 世界の飼料用顔料市場、飼料生産量、メートルトン、養殖業別、2017-2022年
- 図 5:
- 飼料顔料の世界市場、飼料生産量、メートルトン、家禽別、2017-2022年
- 図 6:
- 飼料用顔料の世界市場、飼料生産量、メートルトン、反芻動物別、2017-2022年
- 図 7:
- 世界の飼料用顔料市場、飼料生産量、メートルトン、豚肉別、2017-2022年
- 図 8:
- 飼料用顔料の世界市場、数量、メートルトン、2017年~2029年
- 図 9:
- 飼料用顔料の世界市場、金額、米ドル、2017年~2029年
- 図 10:
- 飼料用顔料の世界市場:副添加物別、数量、トン、2017年~2029年
- 図 11:
- 飼料用顔料の世界市場:副添加物別、金額、米ドル、2017年~2029年
- 図 12:
- 飼料用顔料の世界市場、体積シェア(%)、副添加物別、2017~2029年
- 図 13:
- 飼料用顔料の世界市場、金額シェア(%)、副添加物別、2017~2029年
- 図 14:
- 飼料用顔料の世界市場:副添加物別、数量、トン、2017年~2029年
- 図 15:
- 飼料用顔料の世界市場:副添加物別、金額、米ドル、2017年~2029年
- 図 16:
- 飼料用顔料の世界市場:金額シェア(%):動物別、2022~2029年
- 図 17:
- 飼料用顔料の世界市場:副添加物別、数量、トン、2017年~2029年
- 図 18:
- 飼料用顔料の世界市場:副添加物別、金額、米ドル、2017年~2029年
- 図 19:
- 飼料用顔料の世界市場:金額シェア(%):動物別、2022~2029年
- 図 20:
- 飼料用顔料の世界市場:動物別、数量、トン、2017年~2029年
- 図 21:
- 飼料用顔料の世界市場:動物別、金額、米ドル、2017年~2029年
- 図 22:
- 飼料用顔料の世界市場:動物別数量シェア(%)、2017~2029年
- 図 23:
- 飼料用顔料の世界市場、金額シェア(%)、動物別、2017~2029年
- 図 24:
- 飼料用顔料の世界市場:亜動物別、数量、トン、2017年~2029年
- 図 25:
- 飼料用顔料の世界市場:亜動物別、金額、米ドル、2017年~2029年
- 図 26:
- 飼料用顔料の世界市場:サブアニマル別数量シェア(%):2017~2029年
- 図 27:
- 飼料用顔料の世界市場、金額シェア(%)、亜動物別、2017~2029年
- 図 28:
- 飼料用顔料の世界市場:亜動物別、数量、トン、2017年~2029年
- 図 29:
- 飼料用顔料の世界市場:亜動物別、金額、米ドル、2017年~2029年
- 図 30:
- 飼料用顔料の世界市場、金額シェア(%)、副添加物別、2022~2029年
- 図 31:
- 飼料用顔料の世界市場:亜動物別、数量、トン、2017年~2029年
- 図 32:
- 飼料用顔料の世界市場:亜動物別、金額、米ドル、2017年~2029年
- 図 33:
- 飼料用顔料の世界市場、金額シェア(%)、副添加物別、2022~2029年
- 図 34:
- 飼料用顔料の世界市場:亜動物別、数量、トン、2017年~2029年
- 図 35:
- 飼料用顔料の世界市場:亜動物別、金額、米ドル、2017年~2029年
- 図 36:
- 飼料用顔料の世界市場、金額シェア(%)、副添加物別、2022~2029年
- 図 37:
- 飼料用顔料の世界市場:亜動物別、数量、トン、2017年~2029年
- 図 38:
- 飼料用顔料の世界市場:亜動物別、金額、米ドル、2017年~2029年
- 図 39:
- 飼料用顔料の世界市場:サブアニマル別数量シェア(%):2017~2029年
- 図 40:
- 飼料用顔料の世界市場、金額シェア(%)、亜動物別、2017~2029年
- 図 41:
- 飼料用顔料の世界市場:亜動物別、数量、トン、2017年~2029年
- 図 42:
- 飼料用顔料の世界市場:亜動物別、金額、米ドル、2017年~2029年
- 図 43:
- 飼料用顔料の世界市場、金額シェア(%)、副添加物別、2022~2029年
- 図 44:
- 飼料用顔料の世界市場:亜動物別、数量、トン、2017年~2029年
- 図 45:
- 飼料用顔料の世界市場:亜動物別、金額、米ドル、2017年~2029年
- 図 46:
- 飼料用顔料の世界市場、金額シェア(%)、副添加物別、2022~2029年
- 図 47:
- 飼料用顔料の世界市場:亜動物別、数量、トン、2017年~2029年
- 図 48:
- 飼料用顔料の世界市場:亜動物別、金額、米ドル、2017年~2029年
- 図 49:
- 飼料用顔料の世界市場、金額シェア(%)、副添加物別、2022~2029年
- 図 50:
- 飼料用顔料の世界市場:亜動物別、数量、トン、2017年~2029年
- 図 51:
- 飼料用顔料の世界市場:亜動物別、金額、米ドル、2017年~2029年
- 図 52:
- 飼料用顔料の世界市場:サブアニマル別数量シェア(%):2017~2029年
- 図 53:
- 飼料用顔料の世界市場、金額シェア(%)、亜動物別、2017~2029年
- 図 54:
- 飼料用顔料の世界市場:亜動物別、数量、トン、2017年~2029年
- 図 55:
- 飼料用顔料の世界市場:亜動物別、金額、米ドル、2017年~2029年
- 図 56:
- 飼料用顔料の世界市場、金額シェア(%)、副添加物別、2022~2029年
- 図 57:
- 飼料用顔料の世界市場:亜動物別、数量、トン、2017年~2029年
- 図 58:
- 飼料用顔料の世界市場:亜動物別、金額、米ドル、2017年~2029年
- 図 59:
- 飼料用顔料の世界市場、金額シェア(%)、副添加物別、2022~2029年
- 図 60:
- 飼料用顔料の世界市場:亜動物別、数量、トン、2017年~2029年
- 図 61:
- 飼料用顔料の世界市場:亜動物別、金額、米ドル、2017年~2029年
- 図 62:
- 飼料用顔料の世界市場、金額シェア(%)、副添加物別、2022~2029年
- 図 63:
- 飼料用顔料の世界市場:動物別、数量、トン、2017年~2029年
- 図 64:
- 飼料用顔料の世界市場:動物別、金額、米ドル、2017年~2029年
- 図 65:
- 飼料用顔料の世界市場、金額シェア(%)、副添加物別、2022~2029年
- 図 66:
- 飼料用顔料の世界市場:動物別、数量、トン、2017年~2029年
- 図 67:
- 飼料用顔料の世界市場:動物別、金額、米ドル、2017年~2029年
- 図 68:
- 飼料用顔料の世界市場、金額シェア(%)、副添加物別、2022~2029年
- 図 69:
- 飼料用顔料の世界市場:地域別、数量、メートルトン、2017年~2029年
- 図 70:
- 飼料用顔料の世界市場:地域別、金額、米ドル、2017年~2029年
- 図 71:
- 飼料用顔料の世界市場、地域別数量シェア(%)、2017~2029年
- 図 72:
- 飼料用顔料の世界市場、地域別金額シェア(%)、2017~2029年
- 図 73:
- 飼料用顔料の世界市場:国別、数量、トン、2017年~2029年
- 図 74:
- 飼料用顔料の世界市場:国別、金額、米ドル、2017年~2029年
- 図 75:
- 飼料用顔料の世界市場:国別数量シェア(%)、2017~2029年
- 図 76:
- 飼料用顔料の世界市場、国別金額シェア(%)、2017~2029年
- 図 77:
- 飼料用顔料の世界市場:国別、数量、トン、2017年~2029年
- 図 78:
- 飼料用顔料の世界市場:国別、金額、米ドル、2017年~2029年
- 図 79:
- 飼料用顔料の世界市場、金額シェア(%)、副添加物別、2022~2029年
- 図 80:
- 飼料用顔料の世界市場:国別、数量、トン、2017年~2029年
- 図 81:
- 飼料用顔料の世界市場:国別、金額、米ドル、2017年~2029年
- 図 82:
- 飼料用顔料の世界市場、金額シェア(%)、副添加物別、2022~2029年
- 図 83:
- 飼料用顔料の世界市場:国別、数量、トン、2017年~2029年
- 図 84:
- 飼料用顔料の世界市場:国別、金額、米ドル、2017年~2029年
- 図 85:
- 飼料用顔料の世界市場、金額シェア(%)、副添加物別、2022~2029年
- 図 86:
- 飼料用顔料の世界市場:国別、数量、トン、2017年~2029年
- 図 87:
- 飼料用顔料の世界市場:国別、金額、米ドル、2017年~2029年
- 図 88:
- 飼料用顔料の世界市場、金額シェア(%)、副添加物別、2022~2029年
- 図 89:
- 飼料用顔料の世界市場:国別、数量、トン、2017年~2029年
- 図 90:
- 飼料用顔料の世界市場:国別、金額、米ドル、2017年~2029年
- 図 91:
- 飼料用顔料の世界市場:国別数量シェア(%)、2017~2029年
- 図 92:
- 飼料用顔料の世界市場、国別金額シェア(%)、2017~2029年
- 図 93:
- 飼料用顔料の世界市場:国別、数量、トン、2017年~2029年
- 図 94:
- 飼料用顔料の世界市場:国別、金額、米ドル、2017年~2029年
- 図 95:
- 飼料用顔料の世界市場、金額シェア(%)、副添加物別、2022~2029年
- 図 96:
- 飼料用顔料の世界市場:国別、数量、トン、2017年~2029年
- 図 97:
- 飼料用顔料の世界市場:国別、金額、米ドル、2017年~2029年
- 図 98:
- 飼料用顔料の世界市場、金額シェア(%)、副添加物別、2022~2029年
- 図 99:
- 飼料用顔料の世界市場:国別、数量、トン、2017年~2029年
- 図 100:
- 飼料用顔料の世界市場:国別、金額、米ドル、2017年~2029年
- 図 101:
- 飼料用顔料の世界市場、金額シェア(%)、副添加物別、2022~2029年
- 図 102:
- 飼料用顔料の世界市場:国別、数量、トン、2017年~2029年
- 図 103:
- 飼料用顔料の世界市場:国別、金額、米ドル、2017年~2029年
- 図 104:
- 飼料用顔料の世界市場、金額シェア(%)、副添加物別、2022~2029年
- 図 105:
- 飼料用顔料の世界市場:国別、数量、トン、2017年~2029年
- 図 106:
- 飼料用顔料の世界市場:国別、金額、米ドル、2017年~2029年
- 図 107:
- 飼料用顔料の世界市場、金額シェア(%)、副添加物別、2022~2029年
- 図 108:
- 飼料用顔料の世界市場:国別、数量、トン、2017年~2029年
- 図 109:
- 飼料用顔料の世界市場:国別、金額、米ドル、2017年~2029年
- 図 110:
- 飼料用顔料の世界市場、金額シェア(%)、副添加物別、2022~2029年
- 図 111:
- 飼料用顔料の世界市場:国別、数量、トン、2017年~2029年
- 図 112:
- 飼料用顔料の世界市場:国別、金額、米ドル、2017年~2029年
- 図 113:
- 飼料用顔料の世界市場、金額シェア(%)、副添加物別、2022~2029年
- 図 114:
- 飼料用顔料の世界市場:国別、数量、トン、2017年~2029年
- 図 115:
- 飼料用顔料の世界市場:国別、金額、米ドル、2017年~2029年
- 図 116:
- 飼料用顔料の世界市場、金額シェア(%)、副添加物別、2022~2029年
- 図 117:
- 飼料用顔料の世界市場:国別、数量、トン、2017年~2029年
- 図 118:
- 飼料用顔料の世界市場:国別、金額、米ドル、2017年~2029年
- 図 119:
- 飼料用顔料の世界市場、金額シェア(%)、副添加物別、2022~2029年
- 図 120:
- 飼料用顔料の世界市場:国別、数量、トン、2017年~2029年
- 図 121:
- 飼料用顔料の世界市場:国別、金額、米ドル、2017年~2029年
- 図 122:
- 飼料用顔料の世界市場、金額シェア(%)、副添加物別、2022~2029年
- 図 123:
- 飼料用顔料の世界市場:国別、数量、トン、2017年~2029年
- 図 124:
- 飼料用顔料の世界市場:国別、金額、米ドル、2017年~2029年
- 図 125:
- 飼料用顔料の世界市場:国別数量シェア(%)、2017~2029年
- 図 126:
- 飼料用顔料の世界市場、国別金額シェア(%)、2017~2029年
- 図 127:
- 飼料用顔料の世界市場:国別、数量、トン、2017年~2029年
- 図 128:
- 飼料用顔料の世界市場:国別、金額、米ドル、2017年~2029年
- 図 129:
- 飼料用顔料の世界市場、金額シェア(%)、副添加物別、2022~2029年
- 図 130:
- 飼料用顔料の世界市場:国別、数量、トン、2017年~2029年
- 図 131:
- 飼料用顔料の世界市場:国別、金額、米ドル、2017年~2029年
- 図 132:
- 飼料用顔料の世界市場、金額シェア(%)、副添加物別、2022~2029年
- 図 133:
- 飼料用顔料の世界市場:国別、数量、トン、2017年~2029年
- 図 134:
- 飼料用顔料の世界市場:国別、金額、米ドル、2017年~2029年
- 図 135:
- 飼料用顔料の世界市場、金額シェア(%)、副添加物別、2022~2029年
- 図 136:
- 飼料用顔料の世界市場:国別、数量、トン、2017年~2029年
- 図 137:
- 飼料用顔料の世界市場:国別、金額、米ドル、2017年~2029年
- 図 138:
- 飼料用顔料の世界市場、金額シェア(%)、副添加物別、2022~2029年
- 図 139:
- 飼料用顔料の世界市場:国別、数量、トン、2017年~2029年
- 図 140:
- 飼料用顔料の世界市場:国別、金額、米ドル、2017年~2029年
- 図 141:
- 飼料用顔料の世界市場、金額シェア(%)、副添加物別、2022~2029年
- 図 142:
- 飼料用顔料の世界市場:国別、数量、トン、2017年~2029年
- 図 143:
- 飼料用顔料の世界市場:国別、金額、米ドル、2017年~2029年
- 図 144:
- 飼料用顔料の世界市場、金額シェア(%)、副添加物別、2022~2029年
- 図 145:
- 飼料用顔料の世界市場:国別、数量、トン、2017年~2029年
- 図 146:
- 飼料用顔料の世界市場:国別、金額、米ドル、2017年~2029年
- 図 147:
- 飼料用顔料の世界市場、金額シェア(%)、副添加物別、2022~2029年
- 図 148:
- 飼料用顔料の世界市場:国別、数量、トン、2017年~2029年
- 図 149:
- 飼料用顔料の世界市場:国別、金額、米ドル、2017年~2029年
- 図 150:
- 飼料用顔料の世界市場、金額シェア(%)、副添加物別、2022~2029年
- 図 151:
- 飼料用顔料の世界市場:国別、数量、トン、2017年~2029年
- 図 152:
- 飼料用顔料の世界市場:国別、金額、米ドル、2017年~2029年
- 図 153:
- 飼料用顔料の世界市場、金額シェア(%)、副添加物別、2022~2029年
- 図 154:
- 飼料用顔料の世界市場:国別、数量、トン、2017年~2029年
- 図 155:
- 飼料用顔料の世界市場:国別、金額、米ドル、2017年~2029年
- 図 156:
- 飼料用顔料の世界市場:国別数量シェア(%)、2017~2029年
- 図 157:
- 飼料用顔料の世界市場、国別金額シェア(%)、2017~2029年
- 図 158:
- 飼料用顔料の世界市場:国別、数量、トン、2017年~2029年
- 図 159:
- 飼料用顔料の世界市場:国別、金額、米ドル、2017年~2029年
- 図 160:
- 飼料用顔料の世界市場、金額シェア(%)、副添加物別、2022~2029年
- 図 161:
- 飼料用顔料の世界市場:国別、数量、トン、2017年~2029年
- 図 162:
- 飼料用顔料の世界市場:国別、金額、米ドル、2017年~2029年
- 図 163:
- 飼料用顔料の世界市場、金額シェア(%)、副添加物別、2022~2029年
- 図 164:
- 飼料用顔料の世界市場:国別、数量、トン、2017年~2029年
- 図 165:
- 飼料用顔料の世界市場:国別、金額、米ドル、2017年~2029年
- 図 166:
- 飼料用顔料の世界市場、金額シェア(%)、副添加物別、2022~2029年
- 図 167:
- 飼料用顔料の世界市場:国別、数量、トン、2017年~2029年
- 図 168:
- 飼料用顔料の世界市場:国別、金額、米ドル、2017年~2029年
- 図 169:
- 飼料用顔料の世界市場:国別数量シェア(%)、2017~2029年
- 図 170:
- 飼料用顔料の世界市場、国別金額シェア(%)、2017~2029年
- 図 171:
- 飼料用顔料の世界市場:国別、数量、トン、2017年~2029年
- 図 172:
- 飼料用顔料の世界市場:国別、金額、米ドル、2017年~2029年
- 図 173:
- 飼料用顔料の世界市場、金額シェア(%)、副添加物別、2022~2029年
- 図 174:
- 飼料用顔料の世界市場:国別、数量、トン、2017年~2029年
- 図 175:
- 飼料用顔料の世界市場:国別、金額、米ドル、2017年~2029年
- 図 176:
- 飼料用顔料の世界市場、金額シェア(%)、副添加物別、2022~2029年
- 図 177:
- 飼料用顔料の世界市場:国別、数量、トン、2017年~2029年
- 図 178:
- 飼料用顔料の世界市場:国別、金額、米ドル、2017年~2029年
- 図 179:
- 飼料用顔料の世界市場、金額シェア(%)、副添加物別、2022~2029年
- 図 180:
- 飼料用顔料の世界市場:国別、数量、トン、2017年~2029年
- 図 181:
- 飼料用顔料の世界市場:国別、金額、米ドル、2017年~2029年
- 図 182:
- 飼料用顔料の世界市場、金額シェア(%)、副添加物別、2022~2029年
- 図 183:
- 飼料用顔料の世界市場:国別、数量、トン、2017年~2029年
- 図 184:
- 飼料用顔料の世界市場:国別、金額、米ドル、2017年~2029年
- 図 185:
- 飼料用顔料の世界市場:国別数量シェア(%)、2017~2029年
- 図 186:
- 飼料用顔料の世界市場、国別金額シェア(%)、2017~2029年
- 図 187:
- 飼料用顔料の世界市場:国別、数量、トン、2017年~2029年
- 図 188:
- 飼料用顔料の世界市場:国別、金額、米ドル、2017年~2029年
- 図 189:
- 飼料用顔料の世界市場、金額シェア(%)、副添加物別、2022~2029年
- 図 190:
- 飼料用顔料の世界市場:国別、数量、トン、2017年~2029年
- 図 191:
- 飼料用顔料の世界市場:国別、金額、米ドル、2017年~2029年
- 図 192:
- 飼料用顔料の世界市場、金額シェア(%)、副添加物別、2022~2029年
- 図 193:
- 飼料用顔料の世界市場:国別、数量、トン、2017年~2029年
- 図 194:
- 飼料用顔料の世界市場:国別、金額、米ドル、2017年~2029年
- 図 195:
- 飼料用顔料の世界市場、金額シェア(%)、副添加物別、2022~2029年
- 図 196:
- 飼料用顔料の世界市場:国別、数量、トン、2017年~2029年
- 図 197:
- 飼料用顔料の世界市場:国別、金額、米ドル、2017年~2029年
- 図 198:
- 飼料用顔料の世界市場、金額シェア(%)、副添加物別、2022~2029年
- 図 199:
- 飼料用顔料の世界市場、最も活発な企業、戦略的移転件数別、2016年~2022年
- 図 200:
- 飼料用顔料の世界市場、最も採用された戦略、2016~2022年
- 図 201:
- 飼料用顔料の世界市場シェア(%)、主要プレーヤー別、2022年
飼料用顔料の産業区分
カロテノイド、クルクミン、スピルリナは副添加物のセグメントとしてカバーされている。 水産養殖、家禽、反芻動物、豚は動物別セグメントとしてカバーされている。 アフリカ、アジア太平洋、ヨーロッパ、中東、北米、南米は地域別セグメントとしてカバーされている。| 副添加剤 | |
| カロテノイド | |
| クルクミンとスピルリナ |
| 動物 | |||||||
| |||||||
| |||||||
| |||||||
| 豚 | |||||||
| 他の動物 |
| 地域 | ||||||||||||||
| ||||||||||||||
| ||||||||||||||
| ||||||||||||||
| ||||||||||||||
| ||||||||||||||
|
市場の定義
- 機能 - 本研究の目的上、飼料添加物とは、適切な割合で給与することにより、体重増加、飼料要求率、飼料摂取量などの特性を向上させるために使用される、商業的に製造された製品であると考えられる。
- 再販業者 - 二重計上を避けるため、付加価値を付けずに飼料添加物を再販している企業は市場範囲から除外されている。
- エンド・コンシューマー - 複合飼料メーカーは、調査対象市場の最終消費者と見なされる。サプリメントやプレミックスとして直接使用する飼料添加物を購入する農家は対象外とする。
- 社内消費 - 飼料添加物の製造だけでなく、配合飼料の生産に従事している企業も調査の対象である。ただし、市場規模を推定する際には、そうした企業による飼料添加物の内部消費は除外している。
研究方法論
Mordor Intelligenceは、すべてのレポートで4段階の方法論に従います。
- ステップ1:キー変数の特定: 特定の製品セグメントと国に関連する定量化可能な主要変数(業界および外部)は、デスクトップ調査と文献レビューに基づいて、関連する変数と要因のグループから選択されます。主要な専門家の入力。これらの変数は、回帰モデリング(必要に応じて)によってさらに確認されます。
- ステップ2:市場モデルを構築する: 堅牢な予測手法を構築するために、ステップ1で特定された変数と要因は、利用可能な歴史的市場数に対してテストされます。反復的なプロセスを通じて、市場予測に必要な変数が設定され、これらの変数を基にモデルが構築されます。
- ステップ3:検証して最終化する: この重要なステップでは、市場調査の専門家の広範なネットワークを介して、すべての市場数値、変数、アナリストの呼び出しが検証されます。回答者は、調査対象市場の包括的な画像を生成するために、レベルと機能を横断して選択されます。
- ステップ4:研究成果: シンジケートレポート、カスタムコンサルティングアサインメント、データベース&サブスクリプションプラットフォーム。


