Zero-Waste Grocery Stores Market Size and Share
Market Overview
| Study Period | 2020 - 2031 |
|---|---|
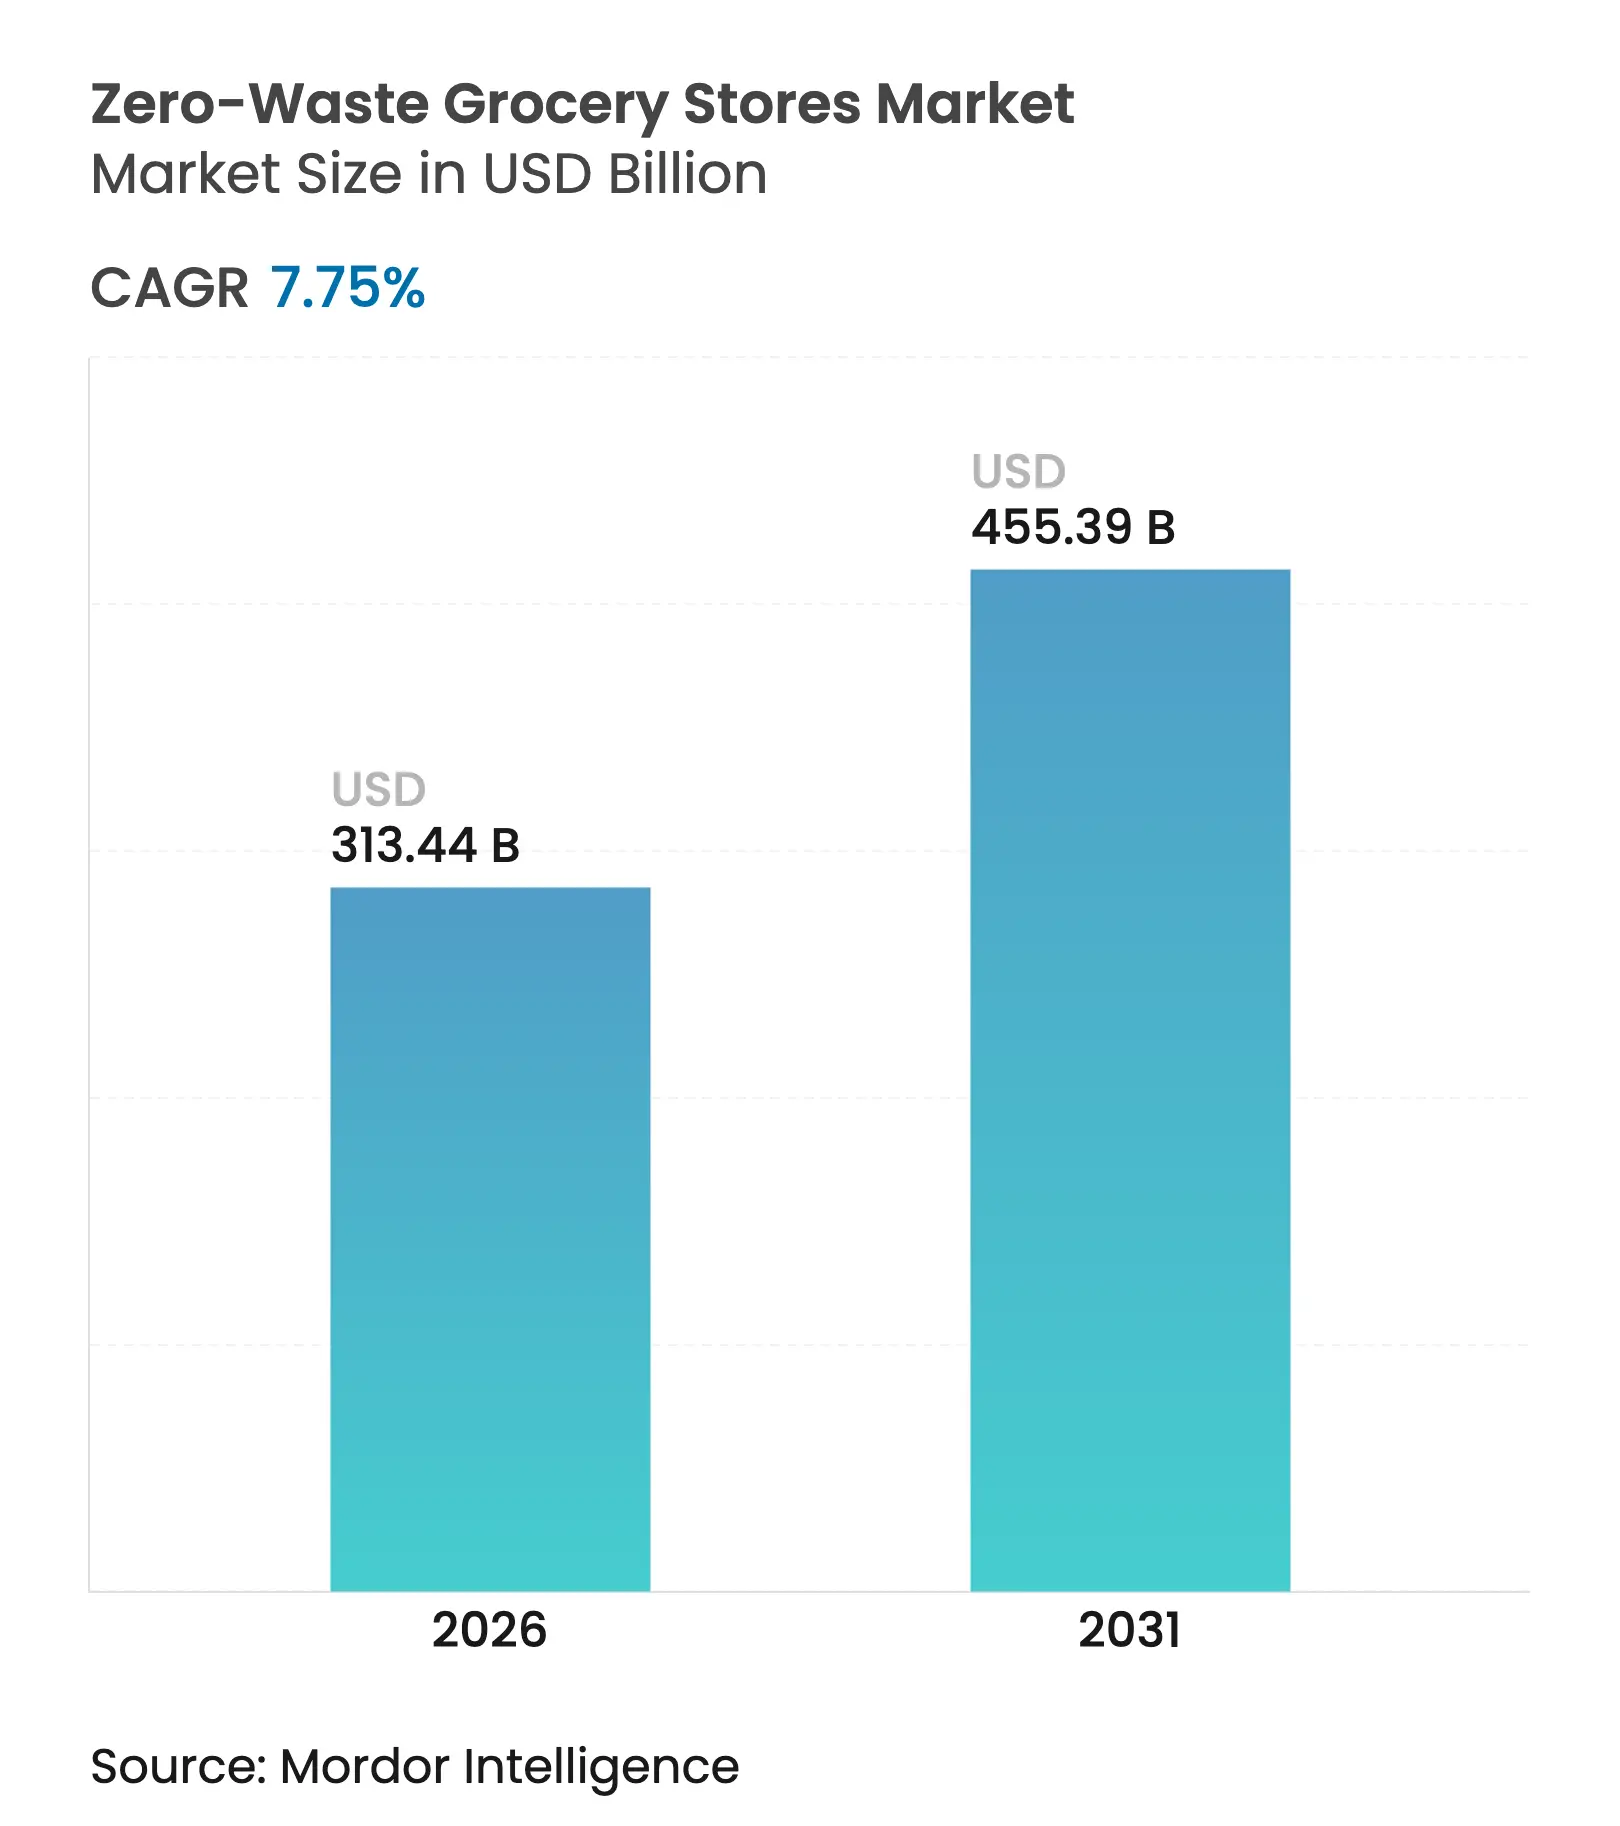
| Market Size (2026) | USD 313.44 Billion |
| Market Size (2031) | USD 455.39 Billion |
| Growth Rate (2026 - 2031) | 7.75 % CAGR |
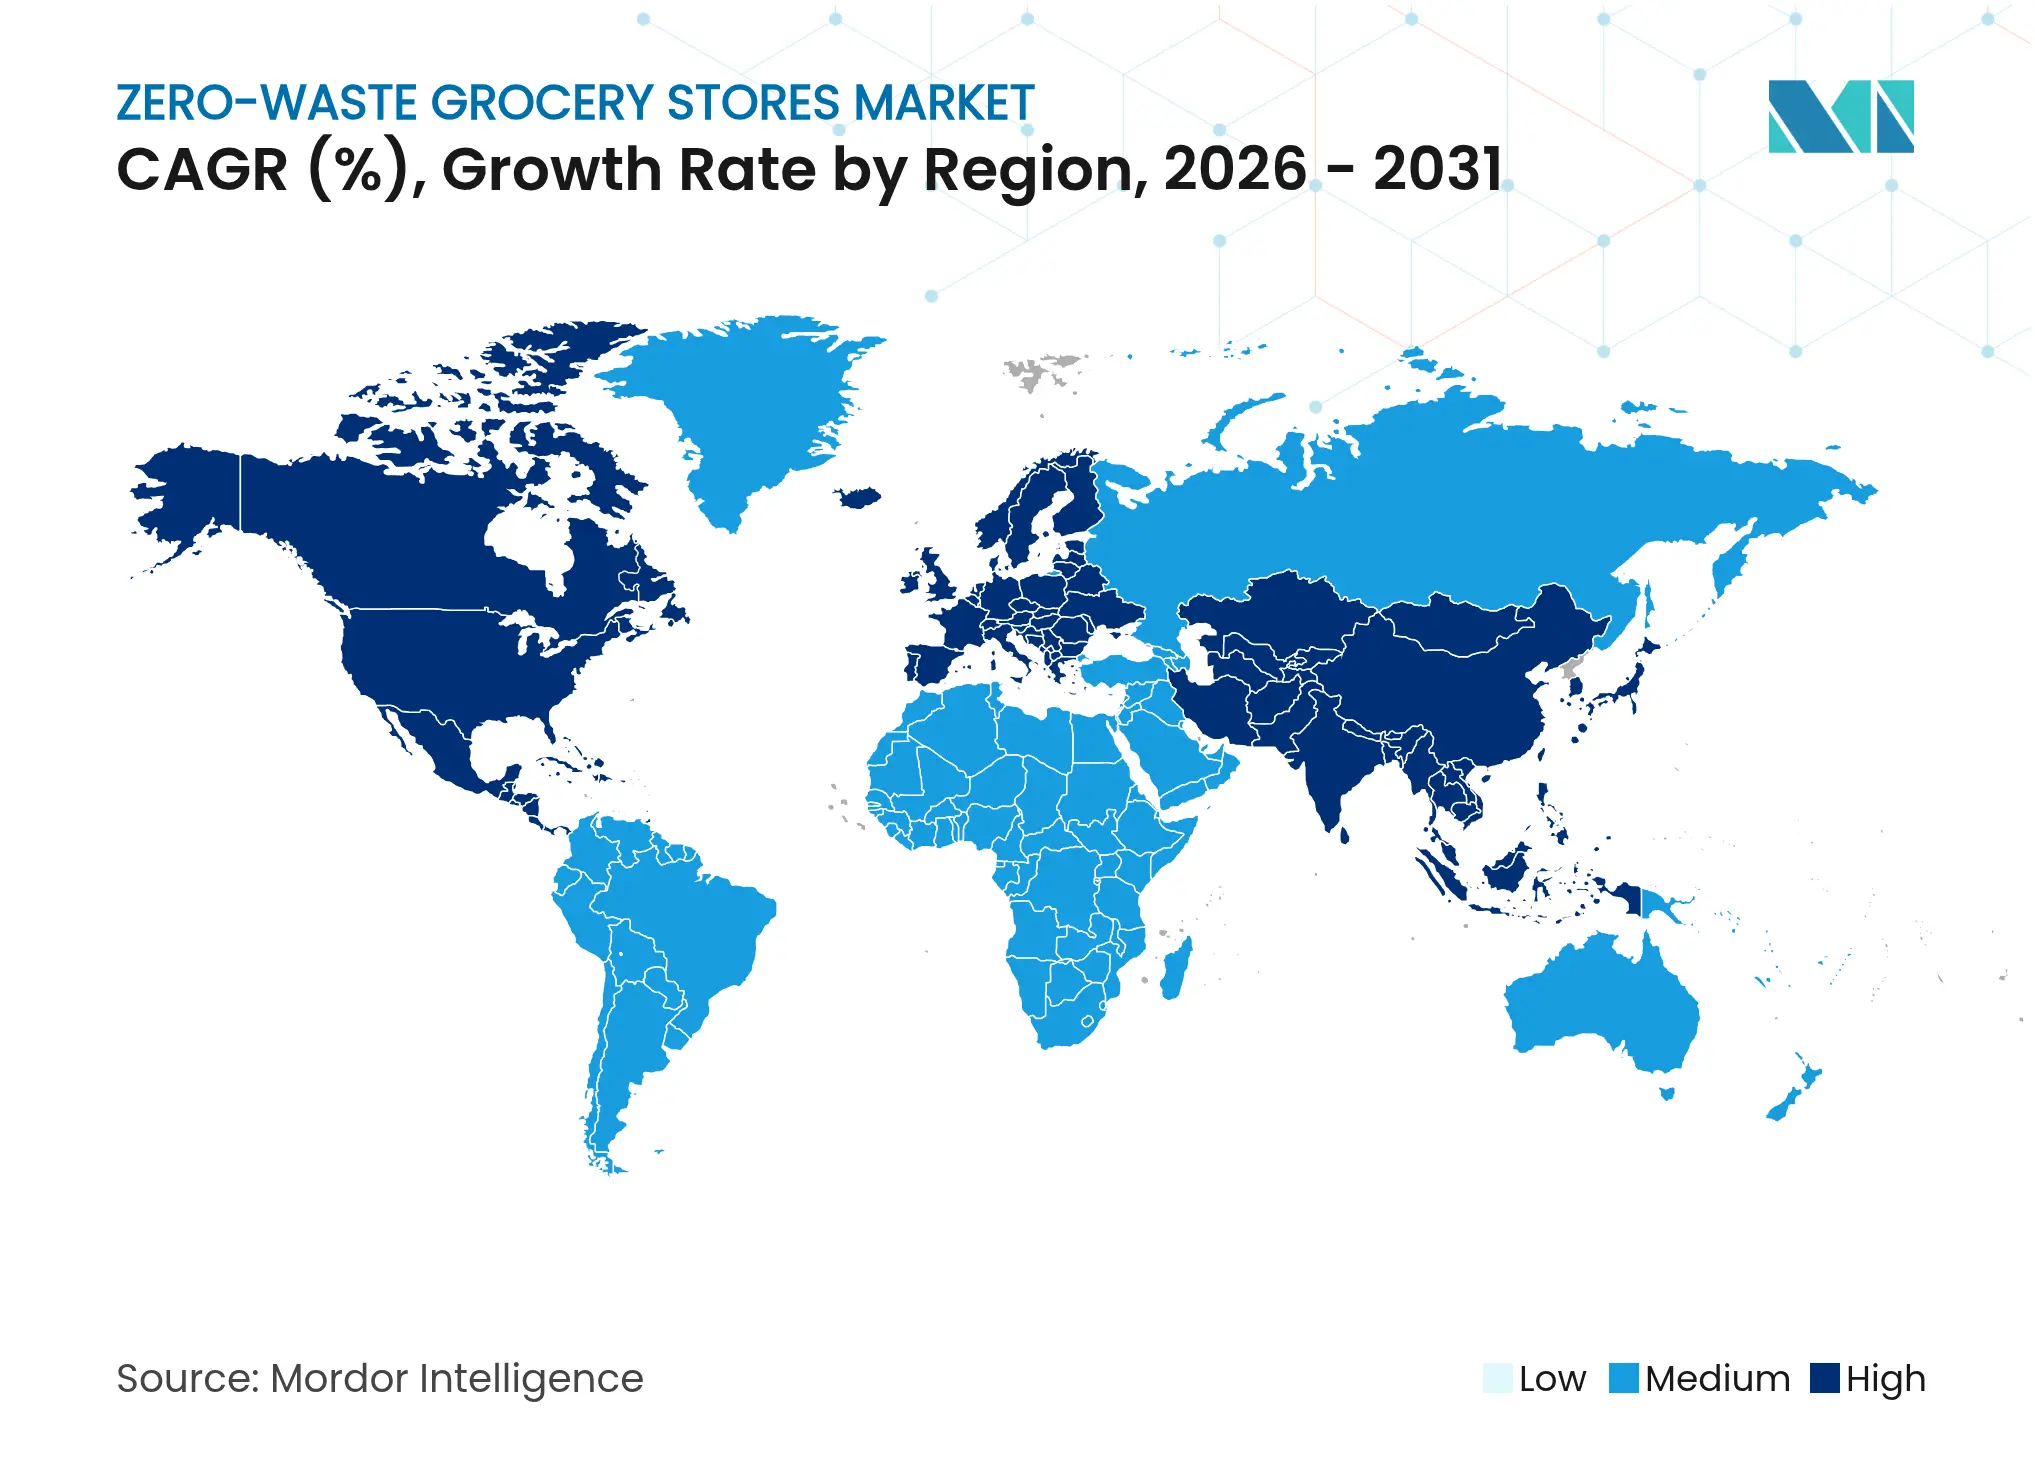
| Fastest Growing Market | Asia Pacific |
| Largest Market | North America |
| Market Concentration | Medium |
Major Players *Disclaimer: Major Players sorted in no particular order. Image © Mordor Intelligence. Reuse requires attribution under CC BY 4.0. |
Zero-Waste Grocery Stores Market Analysis by Mordor Intelligence
The zero-waste grocery market size in 2026 is estimated at USD 313.44 billion, growing from 2025 value of USD 290.9 billion with 2031 projections showing USD 455.39 billion, growing at 7.75% CAGR over 2026-2031. Robust growth is propelled by strict single-use plastic regulations, rising consumer eco-consciousness, and technological upgrades that close cost gaps between package-free and conventional retail. Europe’s policy leadership, North America’s venture investment in AI-enabled inventory tools, and Asia-Pacific’s urbanization collectively expand the addressable base of the zero-waste grocery market. Retail pilots inside mainstream supermarkets de-risk capital commitments, while purpose-built bulk dispensing stores deepen customer education and loyalty. AI-driven markdown engines, such as those adopted by East of England Co-op, shrink waste and improve margins, reinforcing the economic case for zero-waste adoption.
Key Report Takeaways
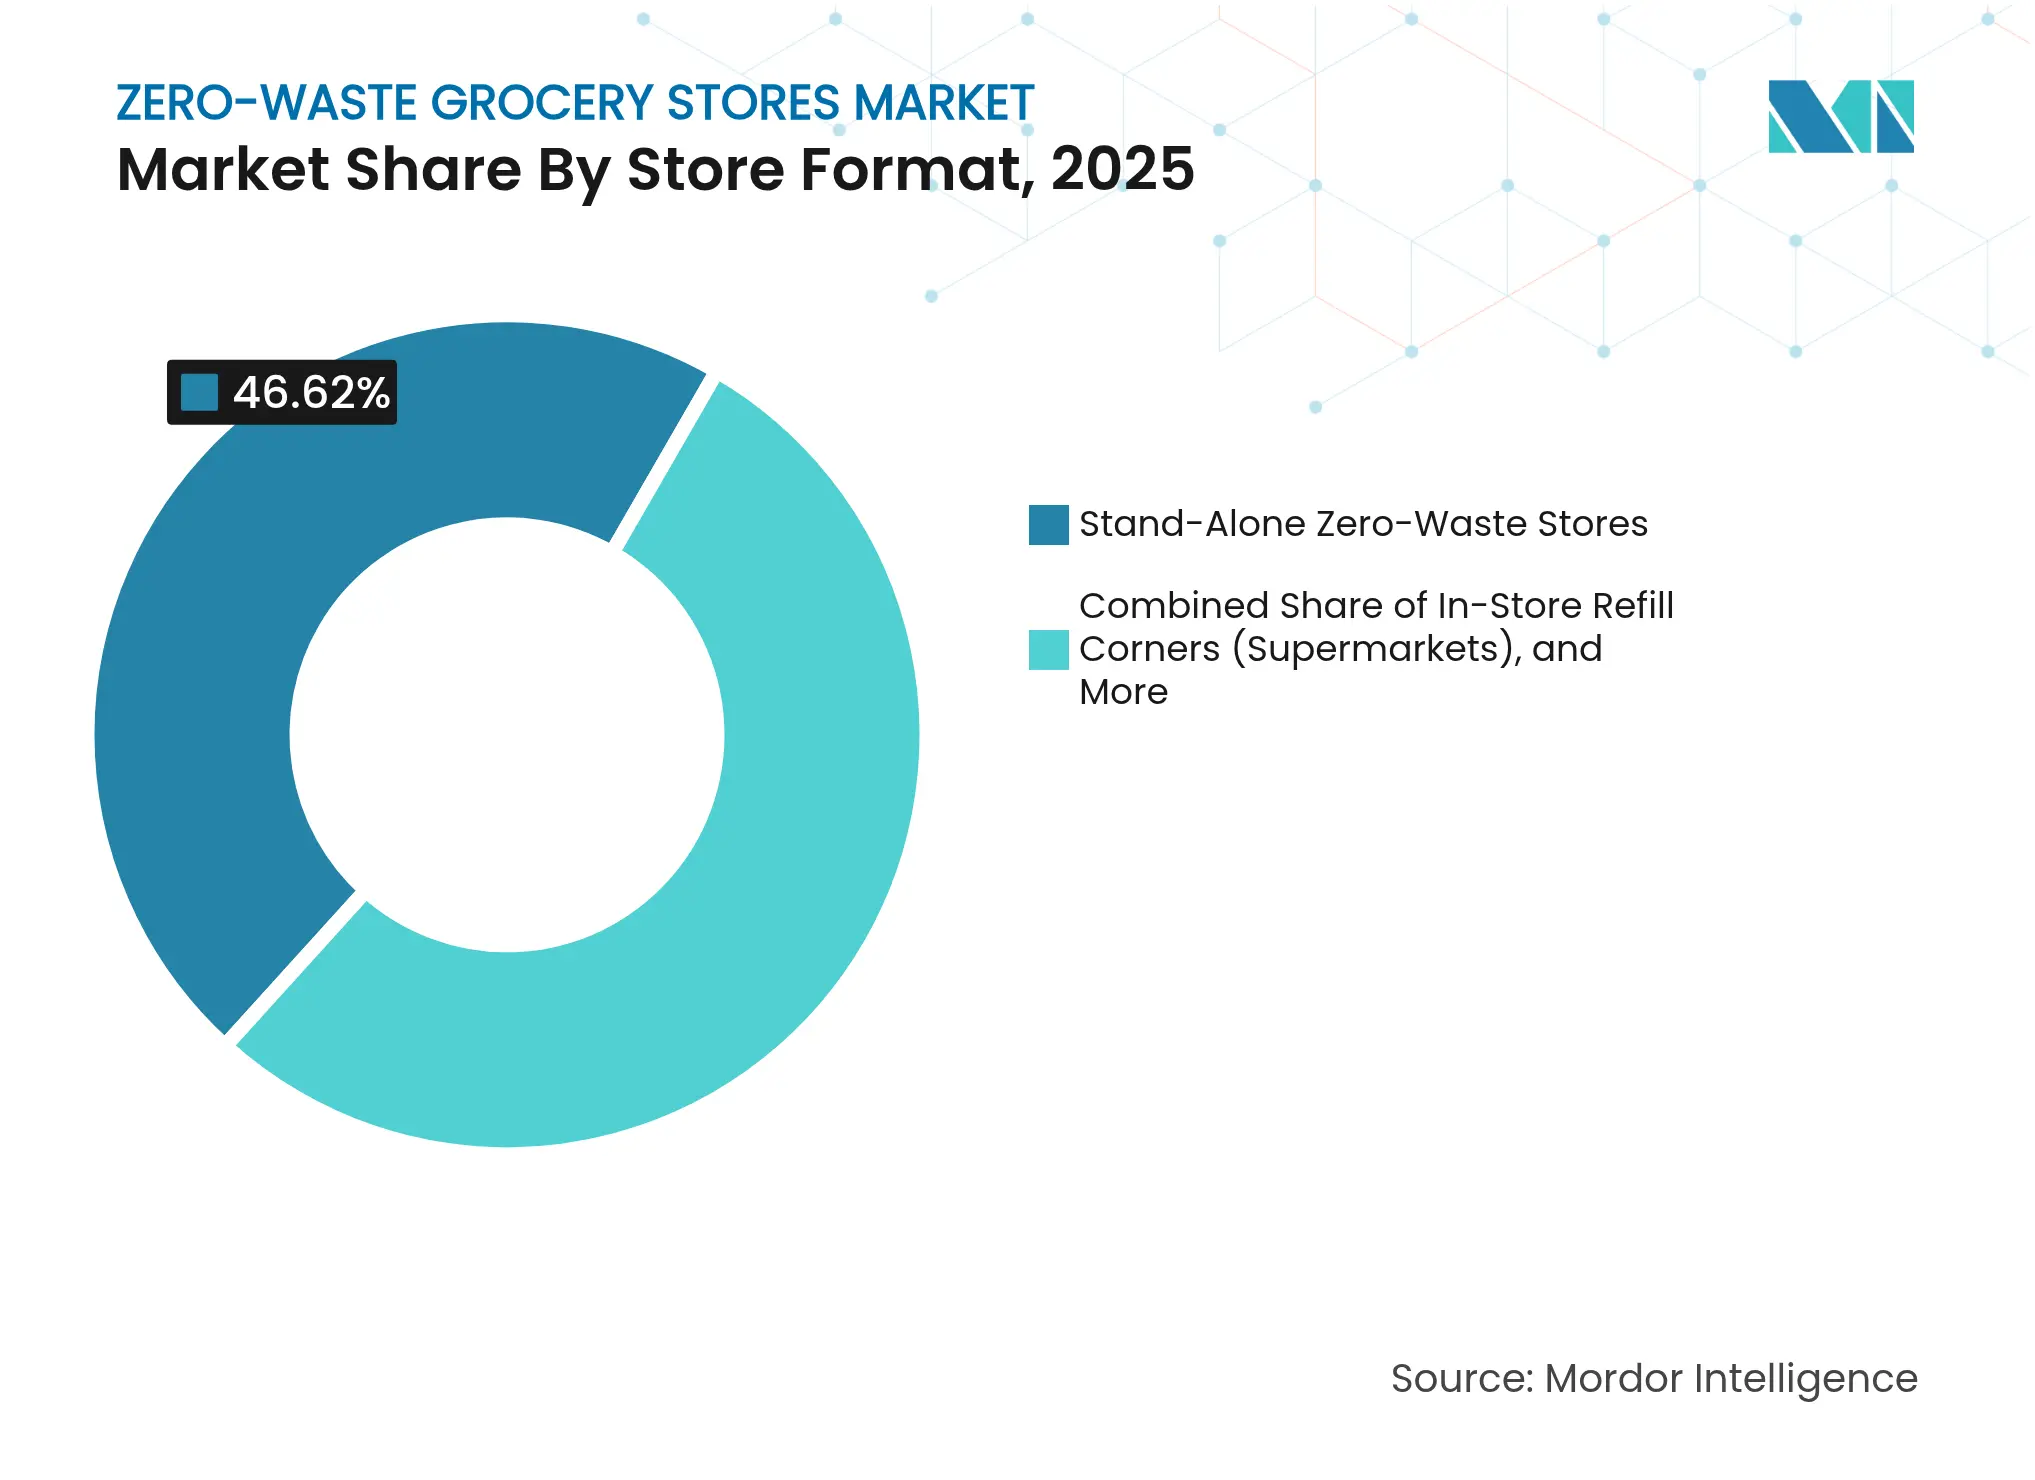
- By store format, stand-alone zero-waste stores held 46.62% of the zero-waste grocery market share in 2025, while online platforms are forecast to grow at an 11.32% CAGR to 2031.
- By product category, food staples accounted for 36.85% of the zero-waste grocery market size in 2025, whereas household cleaning products are advancing at a 9.78% CAGR through 2031.
- By packaging model, bulk dry dispensing systems captured 46.05% share of the zero-waste grocery market size in 2025; reusable container deposit-return models are increasing at a 9.94% CAGR to 2031.
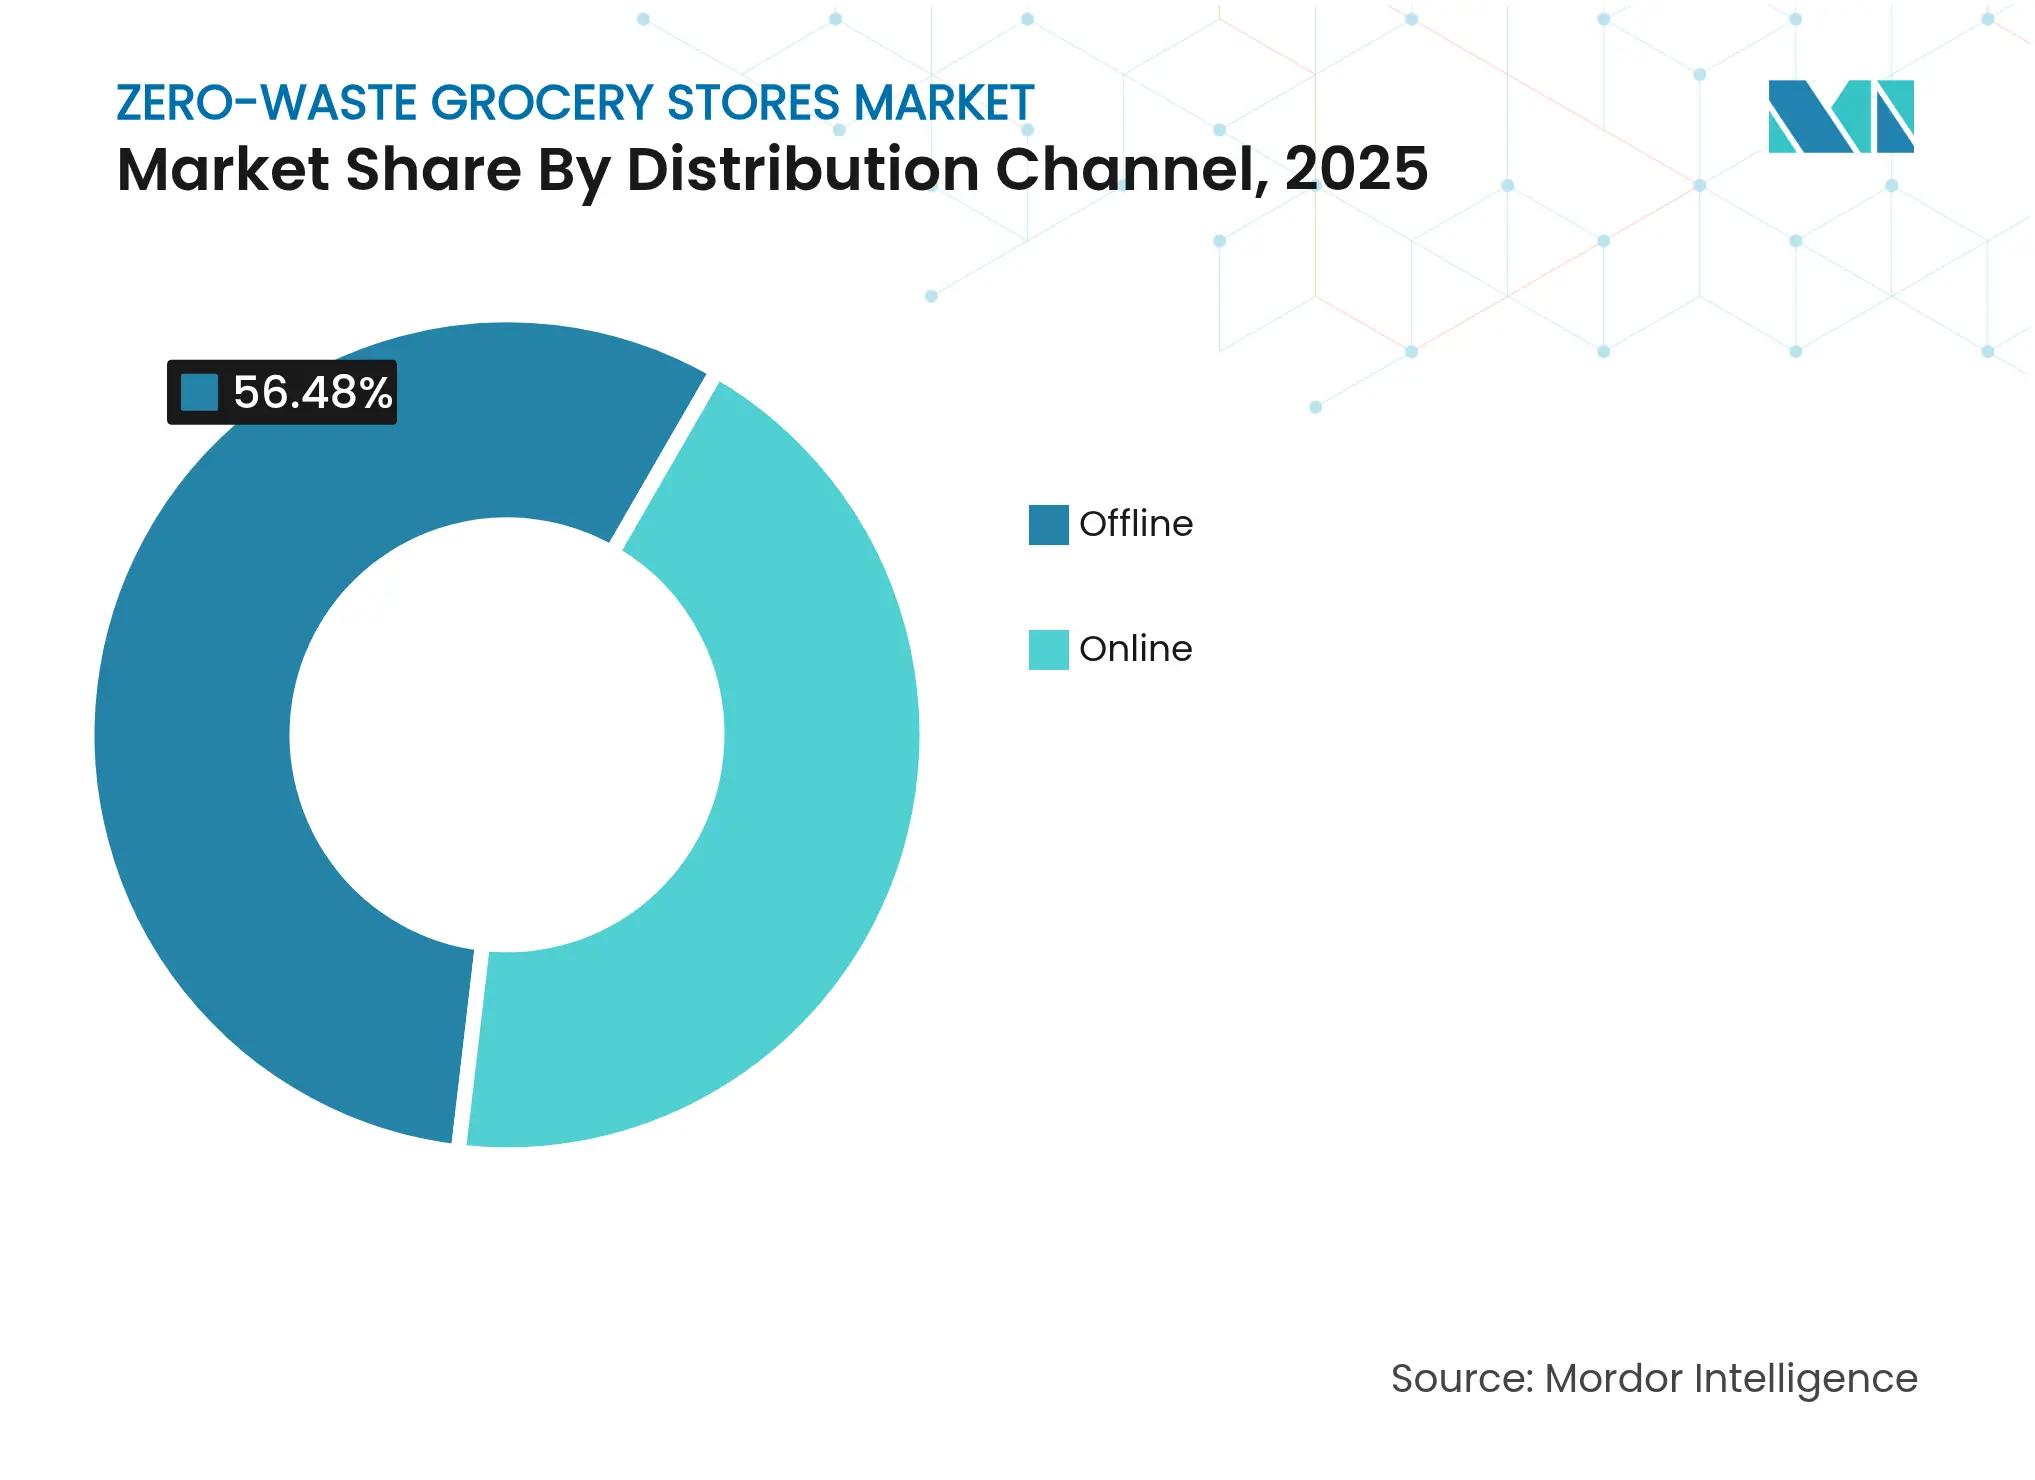
- By distribution channel, offline stand-alone operations maintained 56.48% share of the zero-waste grocery market size in 2025, but online direct-to-consumer platforms are rising at a 13.28% CAGR through 2031.
- By geography, Europe led with 34.52% revenue share in 2025; North America is projected to expand at an 8.69% CAGR through 2031 in the zero-waste grocery market.
- Bulk Barn, The Source Bulk Foods, Day by Day, Nada, and Unverpackt represent the current market leaders, each leveraging distinct competitive advantages in their respective geographic markets and customer segments.
Note: Market size and forecast figures in this report are generated using Mordor Intelligence's proprietary estimation framework, updated with the latest available data and insights as of 2026.
Global Zero-Waste Grocery Stores Market Trends and Insights
Drivers Impact Analysis
| Driver | (~) % Impact on CAGR Forecast | Geographic Relevance | Impact Timeline | |||
|---|---|---|---|---|---|---|
Government bans and levies on single-use
plastics
Government bans and levies on single-use
plastics
| +1.8% | Global, with early adoption in EU and North America | Medium term (2-4 years) |
(~) % Impact on CAGR Forecast
:
+1.8%
|
Geographic Relevance
:
Global, with early adoption in EU and
North America
|
Impact Timeline
:
Medium term (2-4 years)
|
Rising eco-conscious Millennial and Gen-Z
shoppers
Rising eco-conscious Millennial and Gen-Z
shoppers
| +1.5% | Global, strongest in developed markets | Long term (≥ 4 years) | |||
Retailers' ESG targets accelerating
zero-waste pilots
Retailers' ESG targets accelerating
zero-waste pilots
| +1.2% | North America and EU, expanding to APAC | Medium term (2-4 years) | |||
Bulk/dispensing tech driving
unit-economics parity
Bulk/dispensing tech driving
unit-economics parity
| +1.0% | Global, led by technology hubs | Short term (≤ 2 years) | |||
AI-enabled shrink-reduction and inventory
optimisation
AI-enabled shrink-reduction and inventory
optimisation
| +0.8% | Developed markets with digital infrastructure | Short term (≤ 2 years) | |||
High-street vacancy repricing enabling
micro-stores
High-street vacancy repricing enabling
micro-stores
| +0.6% | Urban centers in North America and Europe | Medium term (2-4 years) | |||
| Source: Mordor Intelligence | ||||||
Government Bans and Levies on Single-Use Plastics
Regulatory measures are accelerating refill and deposit systems and reusable packaging, including Germany's 2024 plastics levy that directs revenue to waste-management funds, Austria's 2025 deposit-return scheme imposing a EUR 0.25 fee (USD 0.30) on PET and aluminum beverage containers to target 90% collection by 2027, and Canada's ban on six single-use plastic categories by December 2025 that requires grocers to move away from disposable bags and cutlery.
Rising Eco-Conscious Millennial and Gen-Z Shoppers
Younger cohorts increasingly align grocery spend with climate values. Digital natives weigh carbon footprints in everyday purchases and actively reward brands that minimize packaging waste, raising baseline demand for refill, bulk, and deposit-return offerings. Social-media visibility amplifies zero-waste advocacy, turning reusable-container habits into status behaviors that spark network effects. As Millennials enter peak earning years, household basket mixes shift toward concentrated refills for cleaning products alongside loose staples such as grains and legumes. The demographic tilt reduces customer-acquisition costs for zero-waste operators because word-of-mouth and user-generated content supplement paid marketing. Over the forecast horizon, sustained income growth among Gen Z supports price premiums on sustainable SKUs, solidifying long-run revenue streams.
Retailers’ ESG Targets Accelerating Zero-Waste Pilots
Corporate boards increasingly tie executive compensation to waste-diversion outcomes, accelerating pilot programs that test package-free aisles and closed-loop container flows. Target diverted 85% of operational waste in 2024 and set a 50% food-waste-reduction goal for 2025, signaling board-level commitment to circular retail. Kroger’s Zero Hunger | Zero-Waste road map achieved 52% retail food-waste diversion and shaved 12% from total greenhouse-gas output. Walmart surpassed a 78% landfill-diversion rate in 2024 and aims for global zero-waste by 2025, integrating refill partnerships across its hypermarket footprint. Peer pressure around ESG scorecards pushes lagging retailers to adopt similar initiatives, widening the addressable zero-waste grocery market.
Bulk/Dispensing Tech Driving Unit-Economics Parity
Advances in gravity-fed silos, smart scales, and sensor-equipped liquid taps now automate tare, price, and traceability functions that once required manual intervention. TOMRA’s Reuse Collection Point system logs each reusable container via QR code, providing real-time carbon metrics and achieving 85% return rates in Danish pilots. Danish start-ups integrating RFID sensors into bulk bins cut shrink by double-digit percentages through automated real-time stock alerts. Such efficiency gains bridge historic cost gaps versus pre-packaged SKUs and enable competitive pricing that broadens consumer adoption.
Restraints Impact Analysis
| Restraint | (~) % Impact on CAGR Forecast | Geographic Relevance | Impact Timeline | |||
|---|---|---|---|---|---|---|
High
CapEx for dispensing and reverse-logistics systems
High
CapEx for dispensing and reverse-logistics systems
| -1.4% | Global, particularly challenging in emerging markets | Short term (≤ 2 years) |
(~) % Impact on CAGR Forecast
:
-1.4%
|
Geographic Relevance
:
Global,
particularly challenging in emerging markets
|
Impact Timeline
:
Short
term (≤ 2 years)
|
Stringent
food-safety / health-code compliance burden
Stringent
food-safety / health-code compliance burden
| -0.9% | Developed markets with strict regulatory frameworks | Medium term (2-4 years) | |||
Consumer
"convenience gap" vs packaged groceries
Consumer
"convenience gap" vs packaged groceries
| -0.7% | Global, strongest impact in time-constrained urban markets | Medium term (2-4 years) | |||
Supply-chain
traceability for bulk sourcing
Supply-chain
traceability for bulk sourcing
| -0.5% | Global, with higher complexity in developing supply chains | Long term (≥ 4 years) | |||
| Source: Mordor Intelligence | ||||||
High CapEx for Dispensing and Reverse-Logistics Systems
Dispensing hardware, automated cleaning lines, and secondary transport fleets require hefty capital outlays. Lifecycle analyses of reusable vending machines show hardware accounts for up to 87% of incremental costs versus single-use-pack models. Economic viability hinges on return rates exceeding 70%, a behavioral threshold that typically takes years of consumer education to achieve. Small independents often lack balance-sheet flexibility and struggle to access financing aligned with longer payback cycles, constraining early-stage geographic expansion in cost-sensitive markets.
Stringent Food-Safety / Health-Code Compliance Burden
Bulk and refill concepts intersect with evolving health codes. The U.S. FDA’s Preventive Controls Rule mandates detailed hazard audits, sanitation protocols, and recordkeeping for facilities handling unpackaged foods, raising administrative overhead. The Conference for Food Protection’s 2024 guidance on consumer-owned reusable containers requires grocers to verify container integrity and sanitation, adding front-of-house labor steps. Multi-jurisdictional chains must reconcile differing regional rules, lengthening rollout timelines and dampening short-term growth.
Segment Analysis
By Store Format: Online Platforms Drive Digital Transformation
Online platforms register an 11.32% CAGR through 2031 compared with static growth in brick-and-mortar peers, revealing that digital fulfilment is no longer optional for the zero-waste grocery market. In 2025, stand-alone outlets still claimed 46.62% of the zero-waste grocery market share by delivering immersive refill experiences and community education events that foster brand stickiness. Yet e-commerce operators leverage centralized bulk handling to minimize spillage and reach postal codes that cannot sustain a full store, shifting the competitive cost curve.
Platform players routinely integrate AI demand forecasts, subscription bundles, and carbon-footprint dashboards. As click-and-collect lockers roll out in commuter stations, omnichannel retailers merge online assortments with micro-store convenience. Micro-mobility refill trucks complement the model, letting grocers field-test neighborhoods before committing to long leases. Together, these hybrid tactics transform inventory turns and elevate average order value, cementing digital’s role in the zero-waste grocery market.
Note: Segment shares of all individual segments available upon report purchase
By Product Category: Household Cleaning Accelerates Beyond Food
Food staples maintain a commanding 36.85% slice of the zero-waste grocery market size in 2025, anchored by grains, rice, and legumes that already lend themselves to gravity-fed bins. However, concentrated formulations and high repeat rates propel household cleaning SKUs at a 9.78% CAGR to 2031, the fastest in the sector. The switch to powder or tablet cleaners halves shipment weights, adding freight efficiency to the sustainability equation.
Personal-care and beauty refills deepen basket diversity, while pet-food kibbles in sealed bulk silos open a new revenue leg. Fresh produce adoption lags due to moisture and contamination risks, but pioneering retailers trial reusable mesh crates cooled by regenerative refrigeration. By widening assortments beyond pantry basics, operators even out seasonality and increase visit frequency, fuelling sustained growth in the zero-waste grocery market.
By Packaging Model: Reusable Containers Gain Momentum
Bulk dry dispensing systems dominate with 46.05% of 2025 turnover, reflecting early low-tech implementations that require modest maintenance. Yet reusable container deposit schemes are clipping in at a 9.94% CAGR, narrowing the gap. Customer-facing kiosks scan QR-coded jars, return deposits directly to digital wallets, and issue loyalty points that reinforce habit loops. These technologies cut queue times and simplify audit trails for regulatory compliance.
Liquid refill stations, once limited to boutique cosmetics, are scaling into mainstream groceries, handling dish soap, laundry detergent, and even cooking oil. As cleaning-in-place robots reduce labor, deposit-return economics rival single-use packaging at volumes surpassing 5,000 fills per sku per month. Refinements in stainless-steel keg pools and centralized washing hubs de-risk contamination, allowing wider SKU expansion. The trajectory underlines how innovation in packaging models will reshape the zero-waste grocery market.

Recognized by Experts. Trusted by Leaders.
A trusted intelligence partner to global decision-makers across 90+ countries.


By Distribution Channel: Online DTC Platforms Accelerate
Offline stores captured 56.48% of 2025 revenue, benefiting from curated experiences and educational workshops that anchor local loyalty. Still, online direct-to-consumer platforms are sprinting at a 13.28% CAGR to 2031, buoyed by subscription box predictability and algorithmic assortment curation. Home refill bundle deliveries reduce last-mile emissions when optimised for density and return pickup routes.
Supermarket refill corners fill another niche, borrowing existing foot traffic to lower customer-acquisition costs. Operators exploit store-within-store deals to access captive audiences while testing new regional SKUs. Meanwhile, pure-play platforms invest in tamper-evident reusable shipper boxes, achieving round-trip return rates above 80% in urban pilot zones. This convergence around omnichannel options broadens consumer reach and locks in recurring revenue streams across the zero-waste grocery market.
Note: Segment shares of all individual segments available upon report purchase
By Consumer Demographic: Millennials Lead Adoption
Millennials, who now dominate household formation, form the backbone of zero-waste uptake thanks to higher disposable income and ingrained sustainability norms. Gen Z, digitally fluent and activist-minded, exhibits the fastest adoption curve as social influence catalyzes trial and sharing. Gen X joins the shift by leveraging loyalty-program incentives to blend convenience with eco-ethics.
Baby Boomers remain a smaller revenue pool yet show openness in affluent enclaves where premium refill stations double as community hubs. Marketers tune channel strategies accordingly: TikTok tutorials resonate with Gen Z, long-form newsletters win Gen X, while in-store events engage Boomers. Tailoring value propositions—cost savings, waste reduction, or ingredient purity—by cohort sharpens targeting efficiency and expands lifetime value in the zero-waste grocery market.
Geography Analysis
Europe retains clear leadership at 34.52% of 2025 revenue, rooted in tight regulatory timelines, dense urban centres, and consumer willingness to pay green premiums. EU directives mandating 90% PET bottle collection by 2029 ensure constant demand for refill and deposit infrastructure. France’s extended producer responsibility law compels grocers to finance recycling schemes, further accelerating zero-waste adoption. The UK identified that 51% of supermarket plastic packaging is avoidable, creating an immediate substitution pool for loose fresh produce. High-speed rail links and consolidated supply chains make continent-wide container loops feasible, amplifying economies of scale in the zero-waste grocery market.
North America, projected to post an 8.69% CAGR, benefits from growing policy coherence. Canada’s Federal Plastics Registry obliges companies to report plastic volumes, nudging them toward refill formats. The U.S. federal government's commitment to phase out single-use plastics in federal procurement by 2035 cues private retailers to pivot similarly . Venture funding channels capital to AI inventory start-ups like Afresh, which cut store-level food waste by 14.8%, improving zero-waste margins. Retailers such as Whole Foods Market partner with Too Good To Go to offload surplus, proving consumer appetite for anti-waste apps that dovetail with refill missions.
Asia-Pacific offers vast runway despite heterogeneous regulations. The Singapore-Australia Green Economy Agreement outlines mutual recognition of sustainable-packaging standards, smoothing cross-border grocery flows. Rapid urbanization concentrates demand yet strains waste infrastructure, making refill models attractive to municipal planners. Still, patchwork safety rules slow multi-country rollouts, and fragmented logistics raise reverse-logistics costs. Long-term capital commitments—estimated at USD 50 billion for regional circular-economy upgrades—suggest that operators with strong balance sheets will shape the region’s zero-waste grocery market trajectory.

Competitive Landscape
Market Concentration
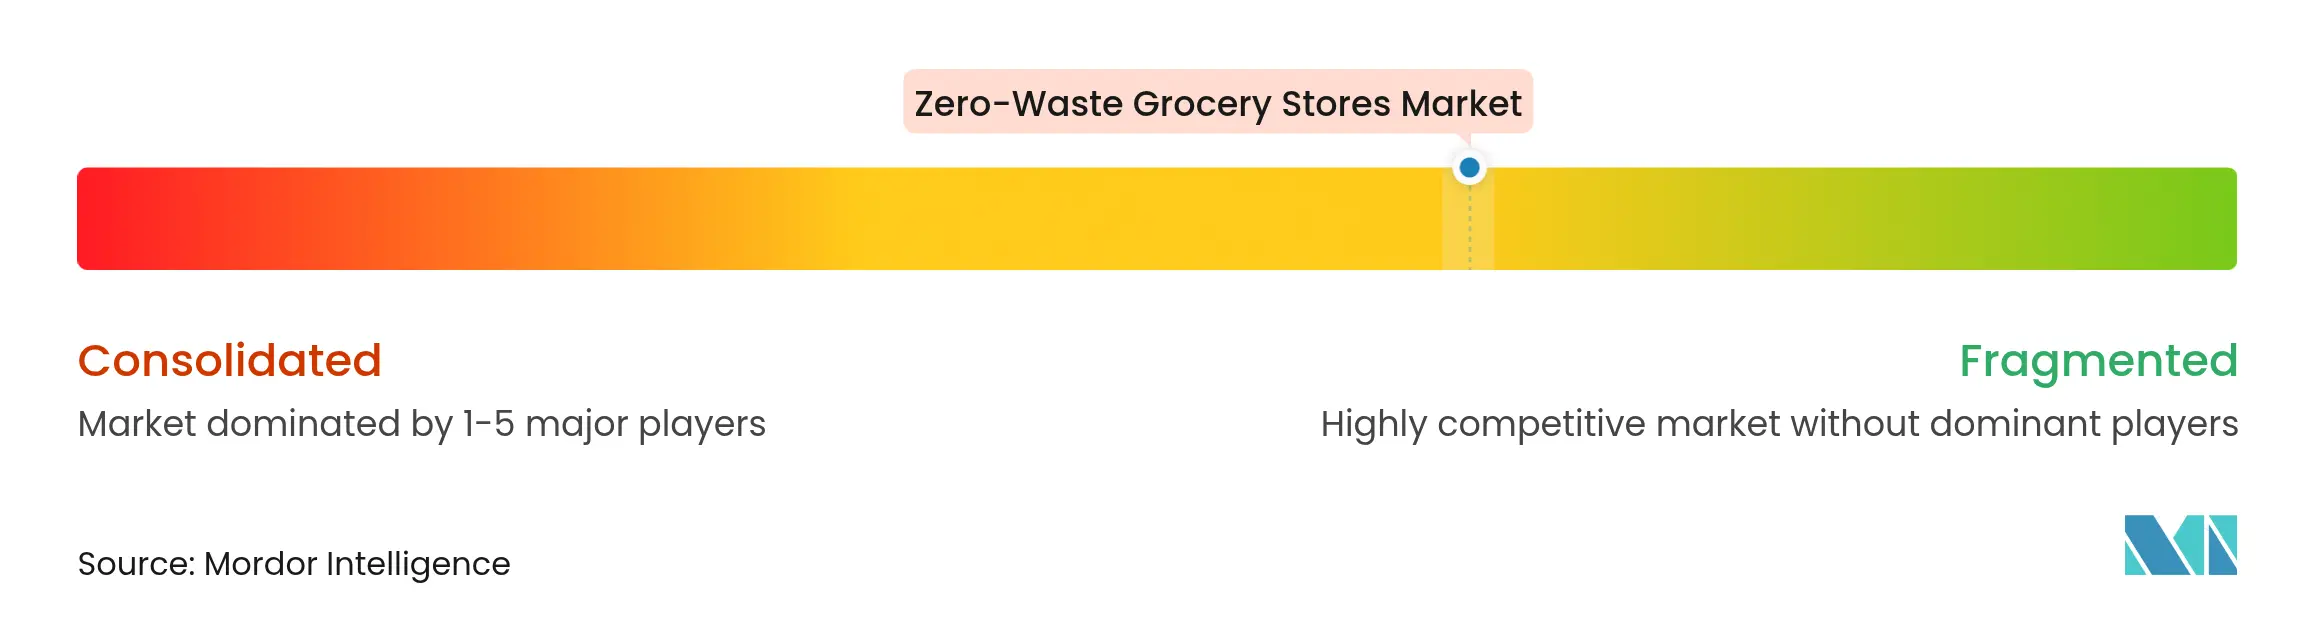
Competitive intensity is moderate, with niche specialists and mainstream grocers jostling for share. Early pure-play leaders such as Day by Day (France), Nada (Canada), Bulk Barn (Canada), and The Source Bulk Foods (Australia) built brand equity around immersive refill experiences. Their localized footprints allow high service levels but expose them to scalability constraints. To overcome this, several partner with technology vendors to automate tare and checkout, freeing staff for customer education.
Large chains integrate zero-waste aisles within existing supermarkets, using scale to secure bulk-buy contracts and negotiate favorable reverse-logistics terms. For instance, UK-based Asda’s “Refill Zone” pilot cut plastic packaging by 40 tonnes in its first year, demonstrating the leverage big-box formats bring. Grocery majors increasingly deploy data platforms that predict high-velocity SKUs suitable for refill, compressing assortment risks. Meanwhile, startups focusing on reusable-container SaaS—tracking deposits, cleaning cycles, and carbon metrics—sell B2B solutions that embed switching costs and cement their platform position.
Strategic partnerships flourish. TOMRA’s hardware integrates with enterprise software from order-management vendor Nextuple, enabling end-to-end visibility from point-of-return to shelf. East of England Co-op’s AI markdown engine licenses forecasting algorithms to regional peers, underscoring how technology IP emerges as a moat. Consolidation rumblings grow as venture-backed refill platforms seek acquisitions that provide physical footprints and established supplier contracts. In the medium term, expect hybrid alliances where technology providers take minority stakes in grocers to lock in long-term hardware and data-analytics revenue streams, tightening competition in the zero-waste grocery market.
Zero-Waste Grocery Stores Industry Leaders

*Disclaimer: Major Players sorted in no particular order
Recent Industry Developments
- May 2025: TOMRA launched automated collection points for reusable takeaway containers featuring QR-code tracking, achieving 85% redemption rates in Danish pilots.
- October 2024: The Source Bulk Foods at Burwood Brickworks expanded its bulk range, stocking 500+ zero-packaging products aimed at reducing household waste.
- October 2024: Nextuple enhanced its Order Management Studio with AI/ML order-promising tools tailored to bulk inventory, helping grocers cut spoilage and stock-outs.
Table of Contents for Zero-Waste Grocery Stores Industry Report
1. Introduction
- 1.1Study Assumptions & Market Definition
- 1.2Scope of the Study
2. Research Methodology
3. Executive Summary
4. Market Landscape
- 4.1Market Overview
- 4.2Market Drivers
- 4.2.1Government Bans And Levies On Single-Use Plastics
- 4.2.2Rising Eco-Conscious Millennial And Gen-Z Shoppers
- 4.2.3Retailers’ ESG Targets Accelerating Zero-Waste Pilots
- 4.2.4Bulk/Dispensing Tech Driving Unit-Economics Parity
- 4.2.5AI-Enabled Shrink-Reduction And Inventory Optimization
- 4.2.6High-Street Vacancy Repricing Enabling Micro-Stores
- 4.3Market Restraints
- 4.3.1High Capex For Dispensing And Reverse-Logistics Systems
- 4.3.2Stringent Food-Safety / Health-Code Compliance Burden
- 4.3.3Consumer “Convenience Gap” Vs Packaged Groceries
- 4.3.4Supply-Chain Traceability For Bulk Sourcing
- 4.4Value / Supply-Chain Analysis
- 4.5Regulatory Landscape
- 4.6Technological Outlook
- 4.7Porter's Five Forces
- 4.7.1Supplier Power
- 4.7.2Buyer Power
- 4.7.3Threat of New Entrants
- 4.7.4Threat of Substitutes
- 4.7.5Competitive Rivalry
5. Market Size & Growth Forecasts
- 5.1By Store Format
- 5.1.1Stand-Alone Zero-Waste Stores
- 5.1.2In-Store Refill Corners (Supermarkets)
- 5.1.3Online Zero-Waste Grocery Platforms
- 5.1.4Mobile Refill Trucks
- 5.2By Product Category
- 5.2.1Food Staples (Grains, Pulses, etc.)
- 5.2.2Fresh Produce
- 5.2.3Dairy and Alternatives
- 5.2.4Personal Care and Cosmetics
- 5.2.5Household Cleaning Products
- 5.2.6Pet Food
- 5.3By Packaging Model
- 5.3.1Bulk Dry Dispensing
- 5.3.2Liquid Refill Stations
- 5.3.3Reusable Container Deposit-Return
- 5.3.4Package-Free Produce Display
- 5.4By Distribution Channel
- 5.4.1Offline
- 5.4.1.1Stand-Alone Stores
- 5.4.1.2Refill Corners in Supermarkets
- 5.4.2Online
- 5.5By Consumer Demographic
- 5.5.1Millennials
- 5.5.2Generation Z
- 5.5.3Generation X
- 5.5.4Baby Boomers
- 5.6By Geography
- 5.6.1North America
- 5.6.1.1Canada
- 5.6.1.2United States
- 5.6.1.3Mexico
- 5.6.2South America
- 5.6.2.1Brazil
- 5.6.2.2Peru
- 5.6.2.3Chile
- 5.6.2.4Argentina
- 5.6.2.5Rest of South America
- 5.6.3Asia-Pacific
- 5.6.3.1India
- 5.6.3.2China
- 5.6.3.3Japan
- 5.6.3.4Australia
- 5.6.3.5South Korea
- 5.6.3.6South East Asia (Singapore, Malaysia, Thailand, Indonesia, Vietnam, and Philippines)
- 5.6.3.7Rest of Asia-Pacific
- 5.6.4Europe
- 5.6.4.1United Kingdom
- 5.6.4.2Germany
- 5.6.4.3France
- 5.6.4.4Spain
- 5.6.4.5Italy
- 5.6.4.6BENELUX (Belgium, Netherlands, Luxembourg)
- 5.6.4.7NORDICS (Denmark, Finland, Iceland, Norway, Sweden)
- 5.6.4.8Rest of Europe
- 5.6.5Middle East And Africa
- 5.6.5.1United Arab of Emirates
- 5.6.5.2Saudi Arabia
- 5.6.5.3South Africa
- 5.6.5.4Nigeria
- 5.6.5.5Rest of Middle East And Africa
6. Competitive Landscape
- 6.1Market Concentration
- 6.2Strategic Moves
- 6.3Market Share Analysis
- 6.4Company Profiles (includes Global level Overview, Market level overview, Core Segments, Financials as available, Strategic Information, Market Rank/Share for key companies, Products & Services, and Recent Developments)
- 6.4.1Package Free
- 6.4.2Nada
- 6.4.3The Source Bulk Foods
- 6.4.4Bulk Barn
- 6.4.5Unverpackt
- 6.4.6Day by Day
- 6.4.7Original Unverpackt
- 6.4.8Precycle
- 6.4.9The Fillery
- 6.4.10Greenweez
- 6.4.11Loop (TerraCycle)
- 6.4.12Zero & Co
- 6.4.13The Refillery
- 6.4.14Zero Market
- 6.4.15Replenish Grocers
- 6.4.16Good Club
- 6.4.17Zero Grocery
- 6.4.18MIWA Technologies
- 6.4.19Refill & Co
- 6.4.20Nada Spain*
7. Market Opportunities & Future Outlook
- 7.1White-Space & Unmet-Need Assessment
Research Methodology Framework and Report Scope
Market Definitions and Key Coverage
Segmentation Overview
- By Store Format
- Stand-Alone Zero-Waste Stores
- In-Store Refill Corners (Supermarkets)
- Online Zero-Waste Grocery Platforms
- Mobile Refill Trucks
- Stand-Alone Zero-Waste Stores
- By Product Category
- Food Staples (Grains, Pulses, etc.)
- Fresh Produce
- Dairy and Alternatives
- Personal Care and Cosmetics
- Household Cleaning Products
- Pet Food
- Food Staples (Grains, Pulses, etc.)
- By Packaging Model
- Bulk Dry Dispensing
- Liquid Refill Stations
- Reusable Container Deposit-Return
- Package-Free Produce Display
- Bulk Dry Dispensing
- By Distribution Channel
- Offline
- Stand-Alone Stores
- Refill Corners in Supermarkets
- Stand-Alone Stores
- Online
- Offline
- By Consumer Demographic
- Millennials
- Generation Z
- Generation X
- Baby Boomers
- Millennials
- By Geography
- North America
- Canada
- United States
- Mexico
- Canada
- South America
- Brazil
- Peru
- Chile
- Argentina
- Rest of South America
- Brazil
- Asia-Pacific
- India
- China
- Japan
- Australia
- South Korea
- South East Asia (Singapore, Malaysia, Thailand, Indonesia, Vietnam, and Philippines)
- Rest of Asia-Pacific
- India
- Europe
- United Kingdom
- Germany
- France
- Spain
- Italy
- BENELUX (Belgium, Netherlands, Luxembourg)
- NORDICS (Denmark, Finland, Iceland, Norway, Sweden)
- Rest of Europe
- United Kingdom
- Middle East And Africa
- United Arab of Emirates
- Saudi Arabia
- South Africa
- Nigeria
- Rest of Middle East And Africa
- United Arab of Emirates
- North America
Detailed Research Methodology and Data Validation
Desk Research
Primary Research
Market-Sizing & Forecasting
Data Validation & Update Cycle
Why Mordor's Zero-Waste Grocery Stores Baseline Commands Reliability
Benchmark comparison
| Market Size | Anonymized source | Primary gap driver | ||
|---|---|---|---|---|
USD 290.9 B (2025) | Mordor Intelligence | - | Anonymized source:Mordor Intelligence | Primary gap driver:- |
USD 0.99 B (2024) | Regional Consultancy A | Tracks only dedicated stand-alone stores, omitting in-store refill corners and online loops, leading to a narrow scope. | ||
USD 12.8 B (2024) | Global Consultancy B | Excludes product value, counts operator service fees only, and applies conservative geographic coverage. |