Supermarkets Market Size and Share
Market Overview
| Study Period | 2021 - 2031 |
|---|---|
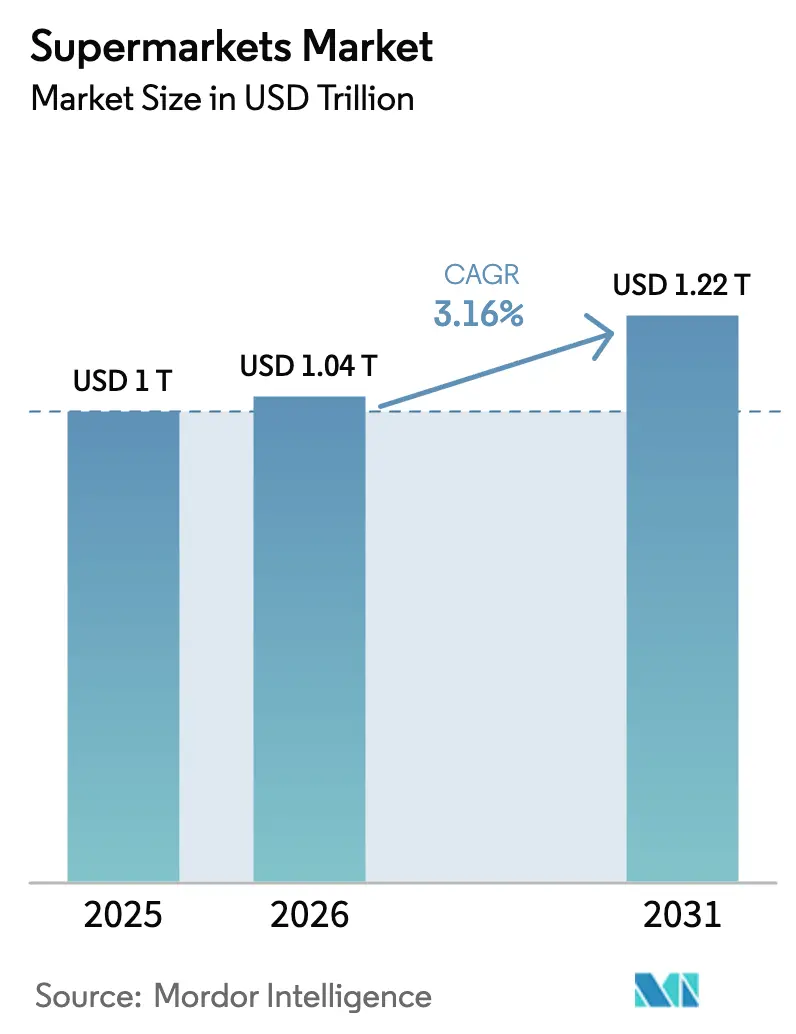
| Market Size (2026) | USD 1.04 Trillion |
| Market Size (2031) | USD 1.22 Trillion |
| Growth Rate (2026 - 2031) | 3.16% CAGR |
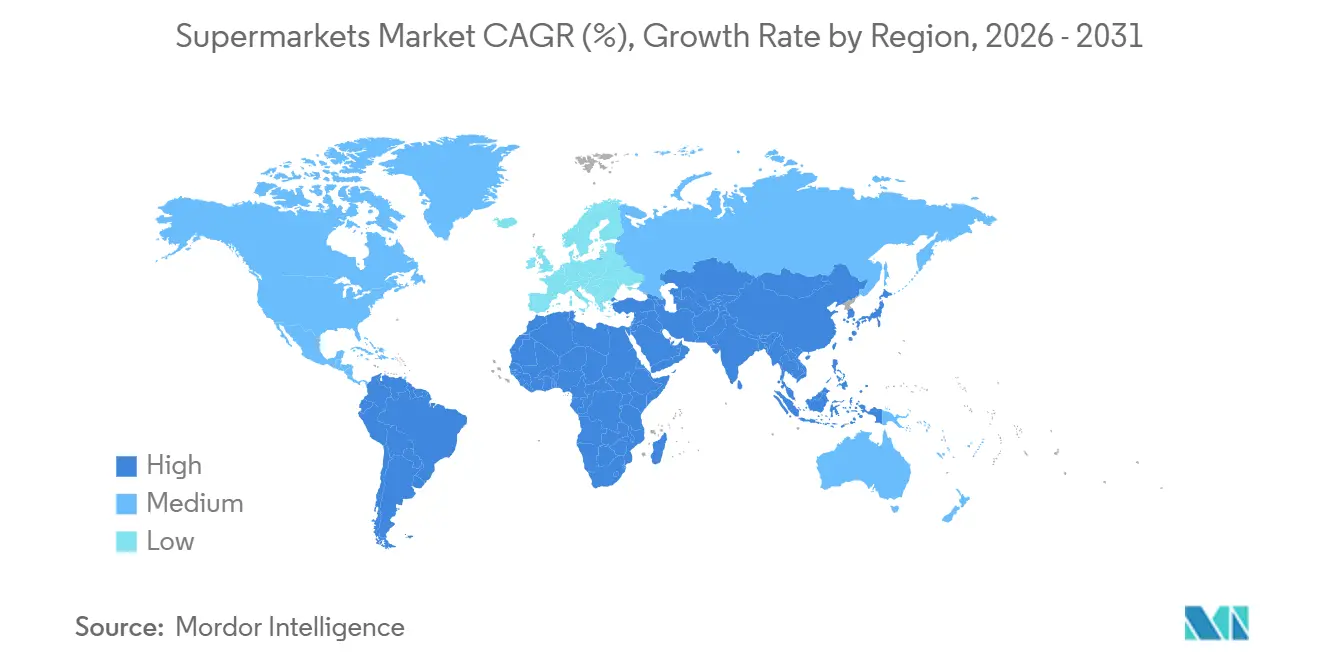
| Fastest Growing Market | Asia-Pacific |
| Largest Market | North America |
| Market Concentration | Low |
Major Players *Disclaimer: Major Players sorted in no particular order Image © Mordor Intelligence. Reuse requires attribution under CC BY 4.0. | |
Supermarkets Market Analysis by Mordor Intelligence
The Supermarkets Market size is projected to expand from USD 1 trillion in 2025 and USD 1.04 trillion in 2026 to USD 1.22 trillion by 2031, registering a CAGR of 3.16% between 2026 to 2031.
Growth reflects steady grocery demand while operators respond to tight margins, format shifts, and digital habits that pull more shopping journeys across channels. Scale remains a clear advantage as large groups deploy private labels, optimize supply chains, and integrate stores with online to defend traffic and share. Walmart’s FY2025 revenues underscore the scale of integrated models that use retail media and membership to strengthen economics[1]Walmart Inc., “Fiscal 2025 Results,” Walmart Corporate, corporate.walmart.com. European leaders also reinforce the Supermarket market through disciplined pricing, logistics density, and deeper banner portfolios that target different value tiers.
Key Report Takeaways
- By product category, packaged and processed food led with 38.37% revenue share in 2025, while ready-to-eat and prepared foods are forecast to expand at a 7.74% CAGR to 2031.
- By sales channel, the offline format held 65.54% share in 2025, while online and e-commerce are projected to grow at an 8.33% CAGR through 2031.
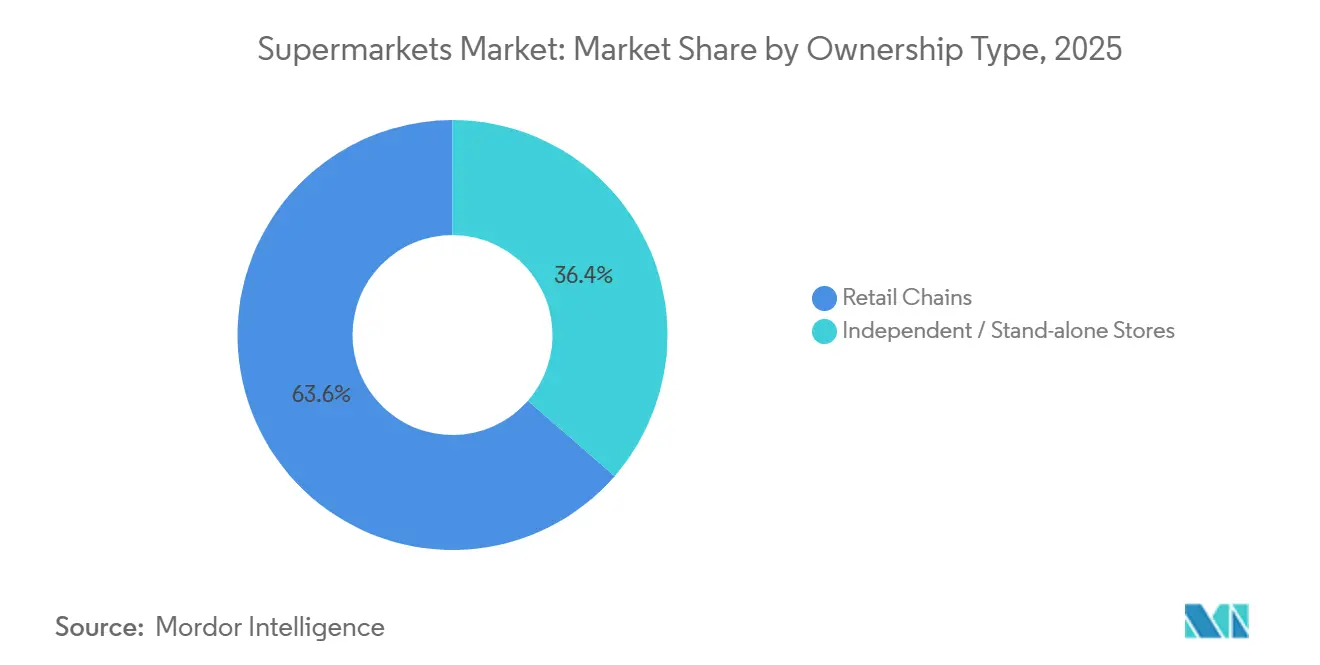
- By ownership type, retail chains accounted for 63.65% of 2025 sales and are projected to advance at a 6.98% CAGR to 2031.
- By geography, North America captured 40.66% in 2025, and Asia-Pacific is the fastest-growing region at a 7.87% CAGR through 2031.
Note: Market size and forecast figures in this report are generated using Mordor Intelligence’s proprietary estimation framework, updated with the latest available data and insights as of January 2026.
Global Supermarkets Market Trends and Insights
Drivers Impact Analysis*
| Driver | (~) % Impact on CAGR Forecast | Geographic Relevance | Impact Timeline |
|---|---|---|---|
| Rapid urbanization fueling demand for one-stop grocery shopping in Asia-Pacific megacities | +0.9% | Asia-Pacific core, spill-over to MENA | Medium term (2-4 years) |
| Rise of private-label penetration increasing basket margin in European discount supermarkets | +0.7% | Europe, North America secondary | Long term (≥ 4 years) |
| Digital loyalty apps driving higher visit frequency in North American chains | +0.5% | North America, early adoption in Asia-Pacific urban hubs | Short term (≤ 2 years) |
| AI-powered shelf optimization reducing stock-outs in high-throughput stores | +0.4% | Global, led by North America and Europe | Medium term (2-4 years) |
| Expansion of fresh convenience zones capturing time-starved consumers | +0.3% | Global, strongest in Europe and Asia-Pacific | Short term (≤ 2 years) |
| Government food-subsidy vouchers channeling spend through supermarkets, for example, Brazil | +0.2% | Brazil national, pilots in select South American cities | Long term (≥ 4 years) |
| Source: Mordor Intelligence | |||
Rapid Urbanization Fueling Demand for One-Stop Grocery Shopping in Asia-Pacific Megacities
Urban population growth and rising household incomes in Asia-Pacific continue to reshape grocery habits toward modern formats and one-stop stock-up trips that favor the Supermarket market[2]Australian Government, “Economic and Trade Insights,” Department of Foreign Affairs and Trade, dfat.gov.au. Operators are clustering stores in dense corridors and layering membership and fresh counters to draw larger baskets and recurring visits, which strengthens the Supermarket market in urban nodes. Sam’s Club China has scaled its warehouse grocery base and expanded assortments that fit apartment-living constraints while appealing to family needs. AEON plans to triple its Vietnamese footprint by 2030 with a mix of large-format stores and supermarkets, supported by ongoing investment and format localization. Vietnam’s Ministry of Industry and Trade has eased retail licensing processes and supported cold-chain upgrades that improve food safety and reduce losses, which further supports modern trade expansion.
Rise of Private-Label Penetration Increasing Basket Margin in European Discount Supermarkets
Private label has gained scale and depth in Europe, lifting the Supermarket market through better price-value and broader coverage of consumer needs across tiers. PLMA reported private-label sales reached USD 369.23 billion (EUR 354.5 billion) in the 52 weeks to July 2024, with a market share of nearly 39% across tracked markets, indicating continued consumer acceptance in core categories. Carrefour lifted private-label mix to 37% of food sales in 2025 and reiterated targets to grow the share further to reinforce price competitiveness and shopper loyalty. Tesco continued to scale its Finest premium range and broaden everyday value tiers, consistent with a portfolio strategy that anchors the Supermarket market across income bands. AEON’s TOPVALU reported solid growth in 2025, underscoring how large retailers use private label to strengthen margin structure and improve bargaining leverage with suppliers within the Supermarket market. EU food-safety frameworks and national certifications support trust in store brands and help narrow any perceived gap with multinational labels, improving conversion at the shelf.
Digital Loyalty Apps Driving Higher Visit Frequency in North American Chains
Membership and loyalty programs continue to shape purchase frequency and basket mix, providing retailers with data that increases the precision of offers and improves the economics of the Supermarket market. Walmart reported growth in its membership-related income in FY2025, and Sam’s Club expanded its Plus-tier adoption, reinforcing the value of benefits and savings for households that consolidate trips. Tesco Clubcard now reaches most United Kingdom households with high sales penetration, and the app user base continues to scale, which enhances the capacity to deliver targeted promotions and dynamic pricing. Target expanded its program reach and improved personalized in-app journeys that support convenient replenishment and value recognition in grocery. Retailers are unifying data platforms with point-of-sale and online carts to identify switching risk and to nudge shoppers with rewards that convert within the Supermarket market. The result is higher visit frequency among active members and greater share-of-wallet within banners that combine fuel rewards, subscriptions, and free pickup.
AI-Powered Shelf Optimization Reducing Stock-outs in High-Throughput Stores
Retailers are deploying AI to improve inventory accuracy, reduce waste, and enhance on-shelf availability across the Supermarket market. Walmart scaled AI tools that assist in inventory planning and routing and has developed models that power more relevant search and recommendations in digital grocery journeys. Target rolled out a generative-AI assistant to store teams across thousands of locations to speed inventory inquiries and support replenishment tasks that improve shelf readiness. Ahold Delhaize introduced an AI assistant within Albert Heijn’s app to support meal planning and discovery, which increases conversion and improves the experience in omnichannel grocery. Standards bodies and regulators are shaping responsible AI, which informs how retailers manage model transparency and bias controls in-store and online. The evolving EU AI Act provides a risk-based framework that guides deployment in high-volume retail contexts without undermining consumer protection in the Supermarket market.
Restraints Impact Analysis*
| Restraint | (~) % Impact on CAGR Forecast | Geographic Relevance | Impact Timeline |
|---|---|---|---|
| High operating and infrastructure costs | -0.8% | Global, acute in Europe and mature North American metros | Long term (≥ 4 years) |
| Intensifying competition from quick-commerce dark stores in urban hubs | -0.6% | India core, spreading to Southeast Asia and South America | Medium term (2-4 years) |
| Supply-chain volatility for fresh produce due to climate disruptions | -0.4% | North America, Europe, Asia-Pacific | Short term (≤ 2 years) |
| Thin profit margins | -0.3% | Global | Long term (≥ 4 years) |
| Source: Mordor Intelligence | |||
High Operating and Infrastructure Costs
Operating expenses in food retail remain elevated, pressuring profits and limiting the pace of reinvestment even as operators modernize supply chains in the Supermarket market. Tesco reported lower free cash flow in FY2024/25 as working capital normalized after prior input inflation, and investment priorities focused on pricing and renewal programs. Kroger recognized a USD 2.6 billion impairment related to automated fulfillment, highlighting execution risk in large-scale automation projects in grocery. Walmart reiterated that mix shifts into lower-margin categories can offset parts of gross profit gains in some quarters within the Supermarket market. Costco announced hourly pay increases for frontline roles in March 2026, which lifts wage costs while improving retention in tight labor markets. These dynamics push retailers to sharpen productivity and reallocate capital toward programs that raise availability, reduce shrink, and differentiate value.
Supply-Chain Volatility for Fresh Produce Due to Climate Disruptions
Weather-linked disruptions continue to influence farm output and pricing for key perishables, creating volatility that retailers must buffer in the Supermarket market. USDA ERS projected a 24.8% rise in egg prices for 2025, tied to avian influenza impacts on flocks, and forecast higher beef and veal prices in 2025 due to tight supplies. The agency also noted that food-at-home inflation reached 2.7% year-on-year in August 2025, which affects household budgets and trade-down behavior in grocery stores. Retailers respond by diversifying sourcing, expanding private-label alternatives, and scaling cold-chain investments to stabilize availability within the Supermarket market. Environmental standards and emissions programs are further nudging value chains toward measurement and mitigation practices that can improve long-run resilience. That transition takes time and capital, so near-term price and supply swings will remain a constraint for fresh ranges.
*Our forecasts treat driver/restraint impacts as directional, not additive. The impact forecasts reflect baseline growth, mix effects, and variable interactions.
Segment Analysis
By Product Category: Packaged Foods Anchor Sales, Ready-to-Eat Surges on Lifestyle Shifts
Packaged and processed food held 38.37% of the Supermarket market share in 2025, reflecting the broad availability, long shelf-life, and efficient distribution that center-store categories provide. Ready-to-eat and prepared foods are the fastest-growing category at a 7.74% CAGR through 2031 as time-pressed households shift to fresh convenience at the perimeter. Supermarket market operators are investing in in-store kitchens and daily-prepared assortments to increase meal occasions and lunch trips, while maintaining staples that anchor weekly baskets. Mercadona’s “Listo para Comer” program demonstrates how a prepared-foods zone pulls incremental demand within a full-basket destination. AEON Vietnam reports prepared and bakery ranges now represent a sizable portion of food sales in newer stores, which supports growth in urban markets.
The global ready-to-eat category has healthy momentum, and supermarkets capture a significant share of that channel flow, which reinforces category breadth that supports the Supermarket market. Cold-chain uplift and automated facilities improve service levels and freshness, helping retailers expand perimeter categories at scale. Health and personal care ranges continue to benefit from co-location strategies and pharmacy adjacencies that drive cross-shopping, which broadens trip missions in the Supermarket market. Household and cleaning products remain steady with private-label penetration, particularly as vertically integrated programs improve cost control and speed to shelf. Food labeling rules such as the United States Nutrition Facts panel update and EU front-of-pack guidance continue to shape product development and shelf presentation across formats.


By Sales Channel: Offline Retains Majority, Online Gains Share via Delivery Innovation
Offline and brick-and-mortar formats held 65.54% of 2025 sales, signaling the ongoing preference for hands-on produce selection and immediate fulfillment in the Supermarket market. Retailers are improving store missions with fresh convenience zones and services that keep trips productive while maintaining sharp pricing to protect core baskets. The Supermarket market size for online and e-commerce is projected to expand at an 8.33% CAGR through 2031 as last-mile economics, subscriptions, and pickup options become more efficient. Retailers are integrating loyalty programs with e-commerce carts and pickup windows, which support add-on items and targeted promotions at checkout. Regulatory guardrails such as GDPR and CCPA shape how retailers personalize digital offers, reinforcing a privacy-by-design approach in grocery apps.
Operators are balancing automation and store-based picking to improve unit economics on delivery and click-and-collect. Kroger adjusted its automation footprint and reweighted toward in-store fulfillment while continuing to scale e-commerce capabilities within the Supermarket market. Several retailers have increased on-demand coverage by partnering with third-party delivery platforms to expand reach without diluting service quality. Retail media and digital coupons now tie directly to basket-building in mobile channels, reinforcing the link between loyalty and online reorder behavior in the Supermarket market. These elements support a stable offline base and a growing digital layer that together strengthen omnichannel outcomes.
By Ownership Type: Chains Leverage Scale, Independents Hold Niche Appeal
Retail chains accounted for 63.65% of 2025 sales and are projected to grow at a 6.98% CAGR through 2031 as scale programs, procurement alliances, and private-label depth reinforce the Supermarket market. Chains deploy significant capital toward technology and logistics upgrades that improve service levels and inventory turns, which benefits trip missions and margins. The Supermarket industry also benefits from procurement alliances and joint buying that extract funding for price investment and innovation at the shelf, supporting competitiveness across banners. Large automated distribution centers and customer-fulfillment facilities are scaling in several countries to support daily replenishment and fresh availability. Mergers and portfolio moves in 2025 increased density and enabled tighter loops for last-mile delivery and regional supply.
Independent grocers remain important for local assortment, community engagement, and fresh service lines that build loyal followings in neighborhoods. Co-op models offer shared services that reduce the cost of digital tools and supplier negotiations, which support store modernization in the Supermarket market. At the same time, compliance with food-safety codes and labeling rules places a heavier administrative load on single-store operators that do not have central teams. The Supermarket industry continues to evolve as independents emphasize differentiation, local sourcing, and service experiences while chains scale a broad promise on value and availability. Both models will remain present, with chains growing faster due to capital intensity and digital infrastructure advantages.
Geography Analysis
North America captured 40.66% of the Supermarket market share in 2025, supported by the scale of national operators and active expansion programs. Walmart’s results highlight consistent comparable growth and stronger digital adoption that feeds a larger ecosystem around grocery. Loblaw accelerated store openings, pharmacy clinics, and a major new automated distribution center, which supports availability and convenience in Canada. Kroger continues to expand e-commerce and remodels, and expects digital profitability as it optimizes fulfillment and pickup operations. Costco plans dozens of new warehouses, including large projects in North America and Mexico, that expand fresh and essentials reach within the Supermarket market. Publix grew sales and continued its remodel cadence in the Southeast, which supports larger baskets and stronger fresh presentation. Food-safety oversight, organic standards, and federal nutrition programs shape assortments and promotions, while state-level waivers guide specific product eligibility under benefits.
Europe’s leaders sustained pricing discipline, private-label growth, and selective consolidation that reinforce the Supermarket market. Schwarz Gruppe reported revenue growth supported by Lidl and Kaufland, showing how a dual-banner approach enables reach across price points. Carrefour completed the Cora and Match acquisition and expanded its purchasing alliance, targeting efficiencies and a higher private-label share across food. Spain’s Mercadona increased sales and profitability and continued to expand in Portugal, supported by prepared foods and store modernization. European environmental goals and labeling pilots are shaping procurement and shelf signals as retailers move toward lower-impact products and transparent nutrition indicators. Frameworks that standardize sustainability disclosures are broadening, aiding suppliers and brands in reporting progress to stakeholders.
Asia-Pacific is the fastest-growing region at a 7.87% CAGR through 2031, anchored by large markets that continue to formalize food retail. Hema and Sam’s Club China expanded quickly in 2025 and raised the bar on membership value and convenience formats in major cities. Reliance Retail added thousands of stores in India and expanded gross revenue, reflecting momentum in organized grocery. AEON increased private-brand penetration and detailed plans to scale convenience banners and supermarkets in Japan and Southeast Asia. Australia’s Woolworths and Coles invested in large automated facilities that improve service levels and order accuracy for fresh categories across the Supermarket market. Food-safety compliance across the region remains strict, with agencies in China, India, and Japan governing labeling and hygiene protocols for retail. These regulatory and infrastructure shifts support a rapid shift toward organized retail and omnichannel grocery in fast-growing cities.

Competitive Landscape
The global supermarket sector exhibits low concentration, with the top 10 players (Walmart, Schwarz Gruppe, Carrefour, Aldi, Kroger, Tesco, Costco, Ahold Delhaize, Edeka, and REWE) collectively holding a significant share, leaving substantial room for regional champions (Reliance Retail, Woolworths, Mercadona) and independent operators. The Supermarket market shows low concentration at the global level, with leading operators present in most regions and strong national champions in key countries. Walmart continues to scale retail media and membership programs that monetize traffic and improve loyalty economics around grocery[3]Walmart Inc., “Advertising and Membership Updates,” Walmart Corporate, corporate.walmart.com. Schwarz Gruppe balances Lidl’s discount proposition with Kaufland’s broader assortment to capture distinct customer missions within a consolidated network. Carrefour’s portfolio simplification and alliance growth aim to sharpen price competitiveness and expand private label across categories[4]Carrefour, “Portfolio Simplification and Alliances,” Carrefour, carrefour.com. Tesco continues to refine its focus with disposals outside core retail banking, a program to upgrade stores, and an expanded marketplace that adds long-tail items.
Operators are deploying omnichannel strategies, automation, and purchasing alliances to protect pricing and improve service levels within the Supermarket market. Coles and others increased automation investment while ramping AI tools for planning and customer service across merchandising and supply chain. Ahold Delhaize executed bolt-on M&A in Central and Eastern Europe to add density and raise private-label scale, improving logistics efficiency. Canadian retailers such as Loblaw partnered with autonomous trucking firms to reduce logistics costs and emissions in large metropolitan areas. Several grocers expanded rapid delivery coverage and unified retail media platforms to drive vendor funding and incremental ad income in the Supermarket market.
Standards and compliance frameworks help reduce complexity across borders and improve trust for food products and data-driven programs. Quality and safety systems supported by global benchmarks and national regulators continue to shape the core practices that protect consumers in grocery. Data protection rules in key markets guide how banners deploy personalized pricing and loyalty features, which supports sustainable adoption of digital tools in the Supermarket market. The long-run competition pattern rests on a base of strong private-label programs, expanded fresh and prepared foods, and omnichannel convenience tied to resilient logistics. Execution will favor banners that blend value, availability, and easy digital journeys as traffic migrates across channels.
Supermarkets Industry Leaders
Walmart Inc.
Schwarz Gruppe
Carrefour SA
Aldi Süd & Nord
The Kroger Co.
- *Disclaimer: Major Players sorted in no particular order


Recent Industry Developments
- June 2025: REWE Group opened the 49,500-square-meter Magdeburg dry-goods logistics center, which is 50% automated, will supply 1,900 stores, and is expected to save 4 million kilometers of transport and cut emissions by 2,700 tonnes annually.
- April 2025: Coles Group issued USD 208.54 million (AUD 300 million) of 7.5-year medium-term notes to fund supply-chain automation, including the Truganina, Victoria automated distribution center build, and began the national rollout of Simply Liquorland.
- February 2025: Loblaw announced USD 1.52 billion (CAD 2.2 billion) of capital investment for 2025 as part of a USD 6.95 billion (CAD 10 billion) plan to 2030, including 80 new stores, more than 300 renovations, expanded Pharmacy Care Clinics, and a 1.2 million square foot automated distribution center in East Gwillimbury, Ontario.
- January 2025: Ahold Delhaize completed the acquisition of Profi in Romania for USD 1.35 billion (EUR 1.3 billion), strengthening its Central and Eastern Europe footprint.


Research Methodology Framework and Report Scope
Market Definitions and Key Coverage
Our study views the global supermarket market as the total annual revenue generated by chain-run or independent, fixed-location, self-service grocery stores that carry a broad food and non-food mix and generally exceed 10,000 sq ft. Larger hypermarket formats (>60,000 sq ft) are folded into this scope because their core offer and merchandising logic mirror supermarkets. According to Mordor Intelligence, the market is valued at about USD 1.01 trillion in 2025 and is projected to climb to USD 1.19 trillion by 2030.
Scope exclusion: corner shops, convenience stores under 10,000 sq ft, pure-play online grocers, and wholesale warehouse clubs sit outside this boundary.
Segmentation Overview
- By Product Category
- Fresh Food
- Packaged / Processed Food
- Beverages
- Household & Cleaning Products
- Health & Personal Care Products
- Ready-to-Eat / Prepared Foods
- Others
- By Sales Channel
- Offline / Brick-and-Mortar
- Online / E-commerce
- By Ownership Type
- Retail Chains
- Independent / Stand-alone Stores
- By Geography
- North America
- Canada
- United States
- Mexico
- Europe
- United Kingdom
- Germany
- France
- Spain
- Italy
- BENELUX (Belgium, Netherlands, Luxembourg)
- NORDICS (Denmark, Finland, Iceland, Norway, Sweden)
- Rest of Europe
- Asia-Pacific
- India
- China
- Japan
- Australia
- South Korea
- South-East Asia (Singapore, Malaysia, Thailand, Indonesia, Vietnam, Philippines)
- Rest of Asia Pacific
- South America
- Brazil
- Peru
- Chile
- Argentina
- Rest of South America
- Middle East and Africa
- United Arab Emirates
- Saudi Arabia
- South Africa
- Nigeria
- Rest of Middle East and Africa
- North America
Detailed Research Methodology and Data Validation
Primary Research
Mordor analysts supplement desk work through conversations with supermarket operators, national retail associations, store equipment vendors, and consumer packaged goods category managers across North America, Europe, Asia-Pacific, Latin America, and the Middle East and Africa. These discussions clarify margin structures, emerging format economics, and adoption curves for services such as click-and-collect.
Desk Research
We begin by mapping the industry using open data from tier-1 statistical and trade bodies such as UN Comtrade, USDA Economic Research Service, Eurostat Retail Trade, Statistics Bureau of Japan, and the Food and Agriculture Organization, together with macro indicators from the World Bank. Company filings, investor decks, and leading grocery trade journals enrich store count, average ticket, and format mix insights. Access to D&B Hoovers and Dow Jones Factiva helps us reconcile corporate disclosures with press-verified expansion moves. The sources listed are illustrative; many others inform cross-checks, gap filling, and trend verification.
Market-Sizing and Forecasting
We employ a top-down reconstruction that starts with government-reported retail food sales and dissects them by store format, adjusting for leakage to convenience and e-commerce. Results are cross-validated through selective bottom-up checks, sampled average sales per store multiplied by active store stock, and channel checks on basket size trends before final alignment. Key variables include urbanization pace, disposable income per capita, grocery price inflation, private-label penetration, outlet density, and e-commerce share within supermarket chains. Forecasts rely on multivariate regression combined with scenario analysis to reflect macro shifts in wages and inflation; coefficients are stress-tested with insights from our primary panel.
Data Validation and Update Cycle
Each model version passes anomaly and variance tests, senior analyst peer review, and region head sign-off. We refresh the full dataset annually and trigger interim updates when regulatory changes, major M&A, or commodity price shocks materially move baseline assumptions. Clients therefore receive the latest vetted view.
Why Mordor's Supermarkets Baseline Commands Reliability
Published numbers often diverge because firms choose dissimilar format cut-offs, vary the treatment of in-store cafés or pharmacy sales, and apply different inflation conversion or currency mix assumptions.
Key gap drivers we observe include competitors widening scope to convenience outlets, reporting aggressive inflation-adjusted growth without volume proof points, or applying fixed markup schedules that ignore private-label price compression. Mordor's model restricts scope to established format definitions, layers country-specific CPI paths, and benefits from an annual refresh cadence, which collectively keep estimates balanced and traceable.
Benchmark comparison
| Market Size | Anonymized source | Primary gap driver |
|---|---|---|
| USD 1.01 trillion (2025) | Mordor Intelligence | - |
| USD 1.90 trillion (2024) | Global Consultancy A | Includes convenience and wholesale clubs, uses global GDP deflator only |
| USD 1.74 trillion (2024) | Industry Association B | Treats online-only grocers as supermarkets, limited primary validation |
| USD 1.56 trillion (2024) | Regional Consultancy C | Applies single exchange-rate snapshot, no adjustment for private-label pricing |
In sum, our disciplined variable selection, dual validation loop, and timely refresh mean decision-makers can rely on Mordor's supermarket baseline as a balanced midpoint between overstated opportunity narratives and underreported conservative cases.


Key Questions Answered in the Report
What is the global Supermarket market size and forecast growth to 2031?
The global Supermarket market size is USD 1.04 trillion in 2026 and is projected to reach USD 1.22 trillion by 2031 at a 3.16% CAGR.
Which product categories are leading and which are growing the fastest in the Supermarket market?
Packaged and processed food leads by share in 2025, while ready-to-eat and prepared foods is the fastest-growing category through 2031 at a 7.74% CAGR.
How is the sales channel mix evolving in the Supermarket market?
Offline kept 65.54% of 2025 sales, while the online and e-commerce channel is projected to grow at an 8.33% CAGR through 2031.
Which regions hold the largest share and the fastest growth within the Supermarket market?
North America captured 40.66% in 2025, while Asia-Pacific is set to expand at a 7.87% CAGR through 2031.
How are private labels changing competition in the Supermarket market?
Private labels are lifting price-value and margins, with leading retailers growing their private-brand mix to deepen loyalty and fund sharp everyday pricing.
What digital and AI capabilities matter most for the Supermarket market today?
Loyalty ecosystems, retail media, and AI for inventory and recommendations are central, improving availability, relevance, and omnichannel economics across banners.
Page last updated on:


