
Xanthan Gum Market Size and Share
Market Overview
| Study Period | 2021 - 2031 |
|---|---|
| Market Size (2026) | USD 803.46 Million |
| Market Size (2031) | USD 948.17 Million |
| Growth Rate (2026 - 2031) | 3.37 % |
| Fastest Growing Market | Asia Pacific |
| Largest Market | Asia Pacific |
| Market Concentration | Medium |
Major Players *Disclaimer: Major Players sorted in no particular order Image © Mordor Intelligence. Reuse requires attribution under CC BY 4.0. | |
Xanthan Gum Market Analysis by Mordor Intelligence
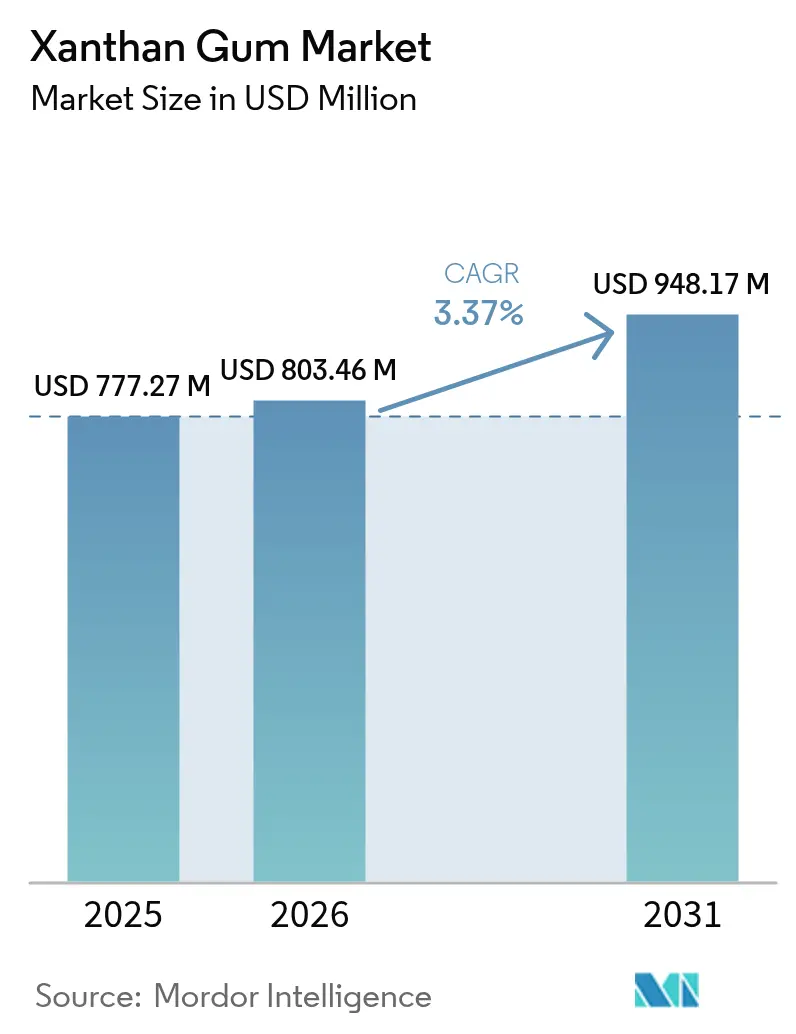
The xanthan gum market size was valued at USD 777.27 million in 2025 and estimated to grow from USD 803.46 million in 2026 to reach USD 948.17 million by 2031, at a CAGR of 3.37% during the forecast period (2026-2031). This growth is driven by the widespread use of xanthan gum as a cost-effective viscosity modifier across various industries. In the food industry, it is widely used in formulations, while specialty drilling fluid companies utilize its performance characteristics. Additionally, the personal care and pharmaceutical industries leverage its properties for product development. Xanthan gum's pseudoplastic behavior and stability across different pH levels ensure consistent performance under challenging conditions, including temperature changes, mechanical stress, and ionic interactions. The market is further supported by increasing consumer demand for gluten-free bakery products, plant-based dairy alternatives, and clean-label condiments. In the oil and gas industry, xanthan gum's salt tolerance enhances reservoir integrity in high-salinity drilling environments. Industry players are addressing market needs through strategic investments, with North American companies expanding production capacity and Asia-Pacific manufacturers focusing on operational optimization to improve regional supply security and manufacturing efficiency.
Key Report Takeaways
- By form, dry xanthan gum commanded 85.76% of the xanthan gum market share in 2025, while liquid grades are projected to expand at a 5.3% CAGR through 2031.
- By application, food and beverages contributed 47.92% of 2025 revenue and are expected to grow at a 3.88% CAGR through 2031, supported by texture innovation in plant-based and reduced-calorie products.
- By geography, Asia-Pacific retained 35.22% of global 2025 sales and is on track for a 4.58% CAGR through 2031, reflecting China’s fermentation scale and rising domestic demand across packaged foods and industrial fluids.
Note: Market size and forecast figures in this report are generated using Mordor Intelligence’s proprietary estimation framework, updated with the latest available data and insights as of 2026.
Market Trends and Insights
Drivers Impact Analysis of Xanthan Gum Market*
| Driver | (~) % Impact on CAGR Forecast | Geographic Relevance | Impact Timeline |
|---|---|---|---|
| Rising use in food and beverage industry as thickener and stabilizer | +0.8% | Global, with concentration in North America and Europe | Medium term (2-4 years) |
| Growing adoption in personal care and cosmetics for emulsifying properties | +0.5% | North America and Europe, expanding to Asia-Pacific | Medium term (2-4 years) |
| Increasing demand for clean-label, natural ingredients | +0.6% | Global, led by North America and Europe | Long term (≥ 4 years) |
| Rising demand for gluten-free and vegan products | +0.4% | North America and Europe, emerging in Asia-Pacific | Medium term (2-4 years) |
| Growing popularity of low-fat and reduced-calorie food products | +0.3% | Global, mature markets leading | Short term (≤ 2 years) |
| Expanding use in oil and gas industry for drilling fluids and enhanced oil recovery | +0.7% | Global, concentrated in major oil-producing regions | Long term (≥ 4 years) |
| Source: Mordor Intelligence | |||


Rising Use in Food and Beverage Industry as Thickener and Stabilizer
Food manufacturers have recognized the significant advantages of xanthan gum's pseudoplastic properties in their formulations. By incorporating this versatile ingredient, manufacturers effectively maintain product consistency while addressing the growing consumer demand for clean-label products with fewer ingredients. The biopolymer demonstrates remarkable efficiency by creating stable emulsions at minimal concentrations of 0.05%, making it a cost-effective solution for texture modification across dairy products, baked goods, and beverages [1]Source: U.S. Department of Agriculture, “Xanthan Gum,” ams.usda.gov. In the rapidly expanding plant-based milk alternatives market, manufacturers utilize xanthan gum to successfully replicate the smooth, creamy mouthfeel of traditional dairy products, delivering comparable viscosity profiles that meet consumer expectations. The FDA's continued approval without quantity limitations has strengthened industry confidence, encouraging manufacturers to explore new applications. This market driver particularly enhances the growth of dry xanthan gum segments, where the product's inherent shelf stability and ability to enable precise dosing align perfectly with the requirements of large-scale food processing operations.
Growing Adoption in Personal Care and Cosmetics for Emulsifying Properties
Xanthan gum's film-forming properties enable cosmetic formulators to enhance product texture while aligning with the growing consumer demand for natural ingredients in their personal care products. Research indicates that varying xanthan gum concentrations influence the characteristics of cosmetic film surfaces, allowing manufacturers to precisely control product texture and application properties. The ingredient demonstrates excellent compatibility with other natural gums, which helps reduce dependence on synthetic emulsifiers in surfactant-free formulations. This transition is particularly evident in European and North American markets, where regulatory frameworks increasingly favor naturally-derived ingredients over synthetic alternatives. The personal care industry's preference for liquid xanthan gum formulations continues to drive substantial growth in this product category, reflecting broader market trends toward natural solutions.
Increasing Demand for Clean-Label, Natural Ingredients
The growing consumer awareness and demand for ingredient transparency have compelled food manufacturers to transition from synthetic additives to more recognizable alternatives in their product formulations. Xanthan gum, though manufactured through a fermentation process, has established itself as a preferred natural thickening agent in food products. The clean-label movement has evolved beyond simple ingredient recognition to incorporate sustainability considerations, with xanthan gum's biodegradable characteristics supporting broader environmental packaging initiatives [2]Source: Brazilian Journal of Food Technology, “Emerging ingredients for clean label products and food safety,” scielo.br. The United States Department of Agriculture's designation of xanthan gum as an approved synthetic substance for organic products has facilitated its widespread adoption across premium food categories. This regulatory approval has proven especially advantageous in frozen food applications and dairy alternatives, where xanthan gum delivers essential functional properties while maintaining clean-label credentials. The ongoing transformation in consumer purchasing patterns, emphasizing transparency and natural ingredient preferences, signifies an enduring shift in market dynamics.
Expanding Use in Oil and Gas Industry for Drilling Fluids and Enhanced Oil Recovery
The petroleum industry increasingly relies on xanthan gum due to its exceptional thermal stability and salt tolerance, particularly in challenging drilling environments where conventional polymers fail to perform under extreme temperature and salinity conditions. In enhanced oil recovery operations, xanthan gum effectively modifies fluid properties while ensuring optimal injectivity into reservoir formations. The industry continues to witness substantial patent activities, indicating robust research and development efforts to enhance xanthan gum formulations for petroleum applications. These developments primarily address thermal stability improvements and minimize formation damage during drilling operations. The biopolymer's environmentally compatible nature positions it favorably in markets with strict regulatory frameworks governing drilling activities. As a result, the petroleum sector generates significant demand for specialized xanthan gum variants with advanced performance attributes, allowing manufacturers to implement premium pricing models in the market.
Restraints Impact Analysis of Xanthan Gum Market*
| Restraint | (~) % Impact on CAGR Forecast | Geographic Relevance | Impact Timeline |
|---|---|---|---|
| Potential allergic reactions in sensitive individuals | -0.2% | Global, heightened awareness in developed markets | Short term (≤ 2 years) |
| Stringent food safety and quality standards | -0.3% | Global, particularly Europe and North America | Medium term (2-4 years) |
| Availability of substitute products | -0.4% | Global, competitive pressure varies by application | Medium term (2-4 years) |
| Limited awareness in developing regions | -0.2% | Asia-Pacific, Middle East and Africa, Latin America emerging markets | Long term (≥ 4 years) |
| Source: Mordor Intelligence | |||
Potential Allergic Reactions in Sensitive Individuals
While xanthan gum consistently demonstrates robust safety profiles through extensive clinical studies, the emergence of isolated allergic reaction cases has prompted increased regulatory scrutiny and heightened consumer awareness, particularly in sensitive applications. The European Food Safety Authority's (EFSA) comprehensive re-evaluation has reinforced xanthan gum's safety status for the general population, including infants above 12 weeks of age [3]Source: European Food Safety Authority, “Re‐evaluation of Xanthan Gum (E 415) as a Food Additive,” efsa.europa.eu. However, the authority has implemented additional safeguards by recommending enhanced monitoring protocols for toxic elements in commercial products. In response to these developments, manufacturers now face more stringent documentation requirements to demonstrate comprehensive product purity and establish clear traceability pathways, especially in pharmaceutical and infant food applications. The European Union's implementation of a notification system specifically targeting non-compliant xanthan gum imports from China underscores the fundamental importance of maintaining rigorous quality control standards to ensure continued market access. These evolving regulatory considerations predominantly impact premium applications where adherence to stringent safety standards remains paramount for market success.
Availability of Substitute Products
The presence of alternative hydrocolloids such as carrageenan, guar gum, and locust bean gum continues to influence the xanthan gum market dynamics. These substitutes effectively serve various applications, creating downward pricing pressure and constraining market expansion opportunities. Laboratory research and industrial applications demonstrate that blending κ-carrageenan with locust bean gum produces comparable gel strength and texture properties in food applications, although with distinct sensory characteristics. The expanding hydrocolloid market demonstrates significant competition among natural thickeners, with alternative products offering cost advantages in specific applications, particularly where xanthan gum's unique properties provide minimal additional benefits. This competitive landscape necessitates xanthan gum manufacturers to strategically focus on applications where their product's functional superiority justifies premium pricing, thereby affecting the overall market growth potential.
*Our forecasts treat driver/restraint impacts as directional, not additive. The impact forecasts reflect baseline growth, mix effects, and variable interactions.
Xanthan Gum Market Segment Analysis
By Form:
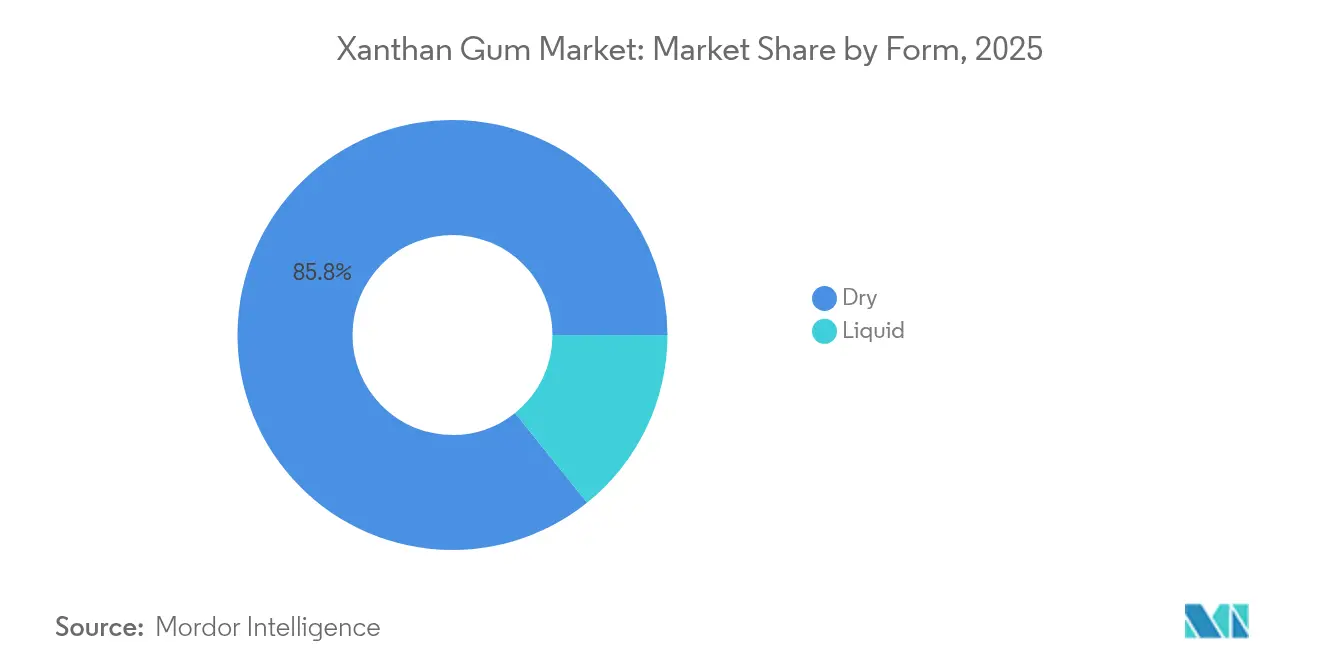
Dry Dominance Driven by Processing AdvantagesDry xanthan gum maintains a substantial 85.76% market share in 2025, demonstrating its strong position in the food manufacturing industry. Food manufacturers consistently choose dry xanthan gum due to its shelf-stable properties and seamless integration with existing powder handling systems. The segment's market leadership is built on its reliable storage characteristics and ability to provide precise dosing capabilities, which are fundamental requirements for food producers managing large-scale operations where product consistency and operational cost control are primary concerns.
In contrast, liquid xanthan gum occupies a smaller portion of the market but exhibits more robust growth potential, with a projected CAGR of 5.30% through 2031. This growth trajectory is primarily driven by specific industrial applications where immediate dissolution and enhanced mixing efficiency are critical operational requirements. The liquid format's performance characteristics make it particularly valuable in manufacturing processes that demand rapid incorporation and uniform distribution of the ingredient.


By Application:
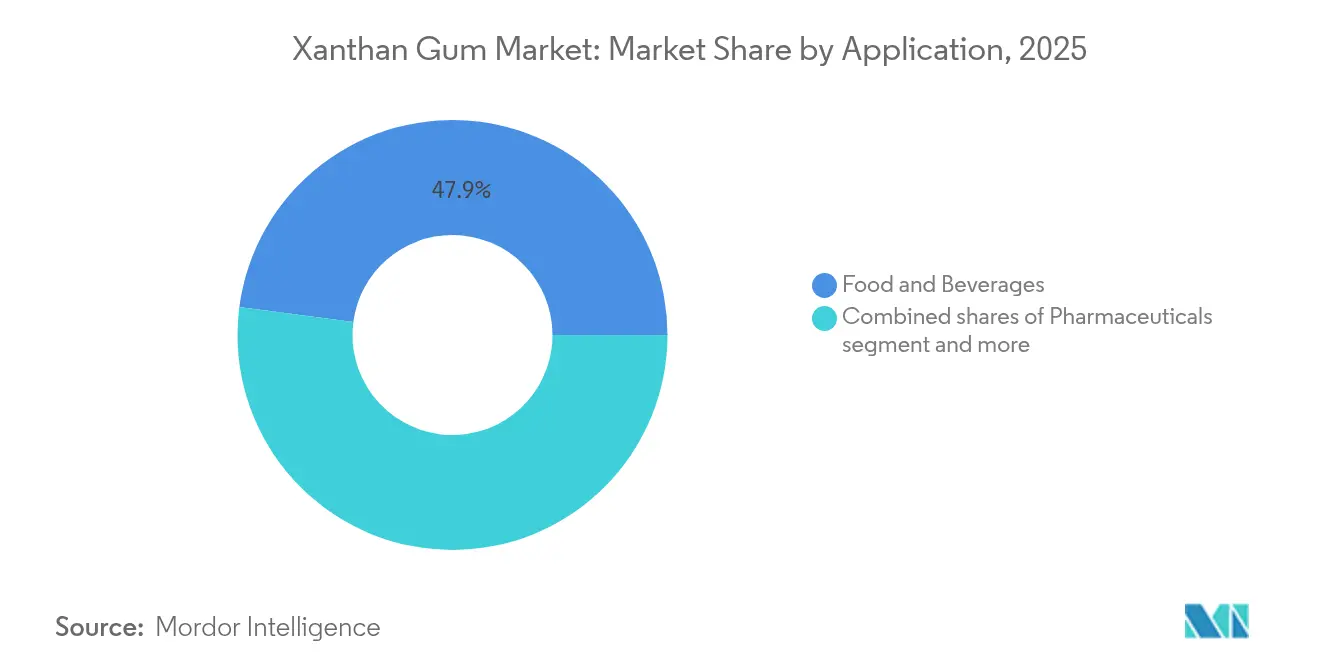
Food and Beverages Lead Through InnovationThe food and beverages segment currently commands a substantial 47.92% market share in 2025, establishing itself as the primary revenue generator in the xanthan gum market. This segment is expected to maintain its market leadership position with a steady CAGR of 3.88% through 2031, primarily due to the increasing incorporation of xanthan gum in plant-based alternative products and clean-label reformulations. The widespread adoption across various food applications, including bakery products, confectionery items, meat processing, frozen foods, dairy products, and beverages, demonstrates the ingredient's versatility in improving texture and maintaining product stability.
In the pharmaceutical sector, xanthan gum continues to gain significant traction, particularly in advanced drug delivery systems. The material's inherent properties of biocompatibility and biodegradability make it especially valuable in controlled-release formulations, where precise drug delivery timing is crucial for therapeutic effectiveness. This expanding pharmaceutical application base further reinforces xanthan gum's position as a versatile ingredient across multiple industries, contributing to its sustained market growth.
Geography Analysis
APAC Xanthan Gum Market
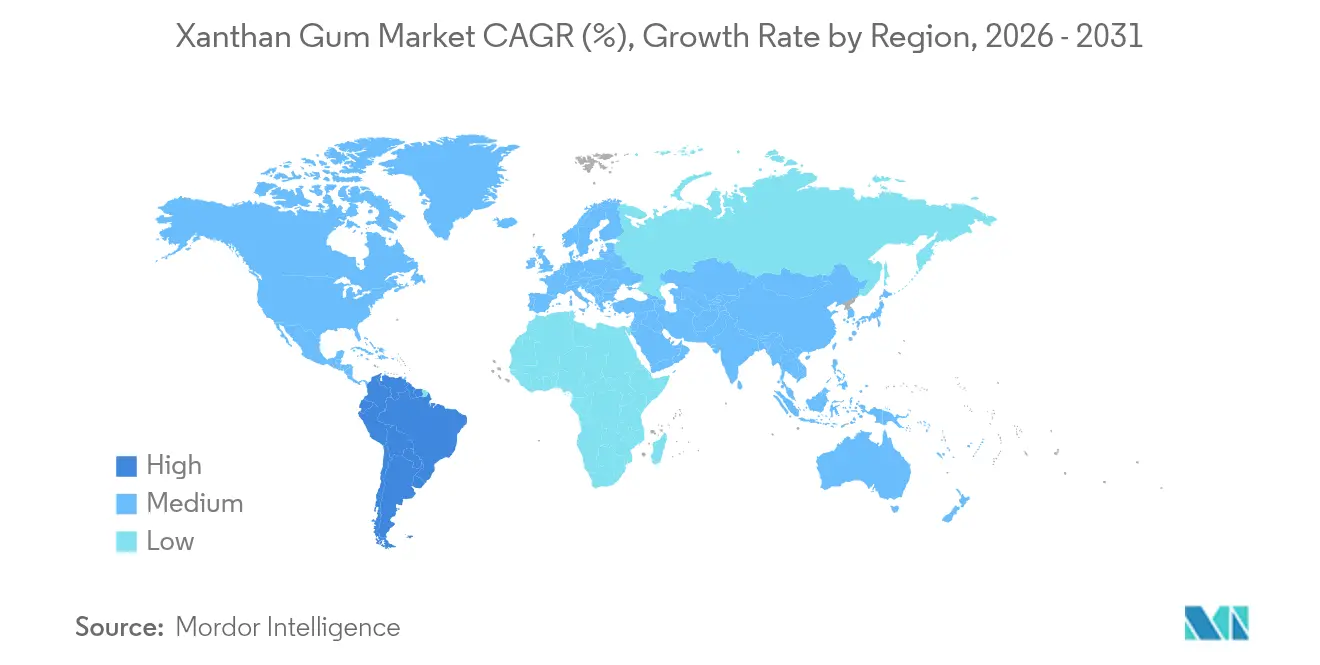
Asia-Pacific is set to dominate the xanthan gum market with a 35.22% share in 2025, driven by its cost-effective manufacturing and robust fermentation infrastructure. China plays a central role, leveraging its production capacity to cater to both domestic needs and global exports. The region is expected to grow at a compound annual growth rate (CAGR) of 4.58% through 2031, supported by innovations aimed at reducing manufacturing costs through alternative substrates and process optimization. Additionally, evolving regulatory frameworks are enhancing quality control standards to meet international export requirements and address compliance challenges that have previously impacted market access.
The Americas and EMEA Xanthan Gum Market
North America is expected to witness stable demand growth, fueled by clean-label trends and expanding industrial applications. The region benefits from strong regulatory frameworks that enable premium pricing for high-quality products. A significant development is Jungbunzlauer's USD 200 million facility in Canada, which expands regional production capacity and reduces reliance on imports. Furthermore, oil and gas applications, particularly in unconventional drilling, are driving demand due to xanthan gum's thermal stability and environmental benefits. The mature food processing industry and established regulatory pathways for pharmaceutical applications further reinforce the region's growth potential.Europe maintains a strong presence in premium applications, supported by stringent quality requirements and a focus on sustainability. The European Food Safety Authority's (EFSA) safety evaluations provide regulatory certainty, though enhanced monitoring for toxic elements adds compliance costs. Meanwhile, South America, the Middle East, and Africa present emerging opportunities as food processing industries grow and awareness of xanthan gum's benefits increases. However, limited technical expertise and higher costs compared to traditional alternatives pose challenges to adoption in these regions.

Regulatory Landscape
Xanthan gum is widely permitted as a food additive, but compliance is increasingly specification-driven across major jurisdictions. In the United States, 21 CFR 172.695 allows xanthan gum for use as a stabilizer, emulsifier, thickener, suspending agent, bodying agent, or foam enhancer, providing a clear baseline for food-grade production and labeling expectations.
In the European Union, Commission Regulation (EU) 2026/196 (adopted 28 January 2026) amended specifications for xanthan gum (E 415) by tightening heavy metal-related purity requirements, including a lower maximum lead limit and new maximum limits for arsenic, mercury, and cadmium, with transitional provisions for products already placed on the market before 18 August 2026. China also updated its national standard with GB 1886.41-2025 issued in September 2025 and implemented from 2 March 2026, replacing the 2015 version and raising the bar for exporters supplying China or sourcing from Chinese producers aligned to the new indicators.
Value Chain Analysis
The xanthan gum value chain begins with agricultural and fermentation inputs, then moves through fermentation, recovery and purification, drying, and application-specific finishing before distribution to end-use formulators. Upstream, manufacturers procure carbon sources such as glucose or sucrose (often derived from corn starch) and nitrogen sources (for example, yeast extract), and ferment them using Xanthomonas campestris. Downstream steps typically include purification using isopropyl alcohol recovery, followed by drying and milling to meet particle size and dispersibility targets for dry grades.
Quality and compliance requirements shape multiple steps of the chain, from fermentation controls to purification performance and traceability, particularly for food, pharmaceutical, and infant-related uses. Regulatory definitions, including the US FDA framework under 21 CFR 172.695 and the EU positioning of xanthan gum as E 415 (with EFSA-driven scrutiny on purity), push suppliers toward tighter process control, contaminant monitoring, and documentation. Distribution commonly flows through ingredient companies and distributors into food and beverage, personal care, pharmaceuticals, and oil and gas service channels, where customers often request technical support to match grade selection (dry versus liquid) to formulation and processing conditions.
Competitive Landscape
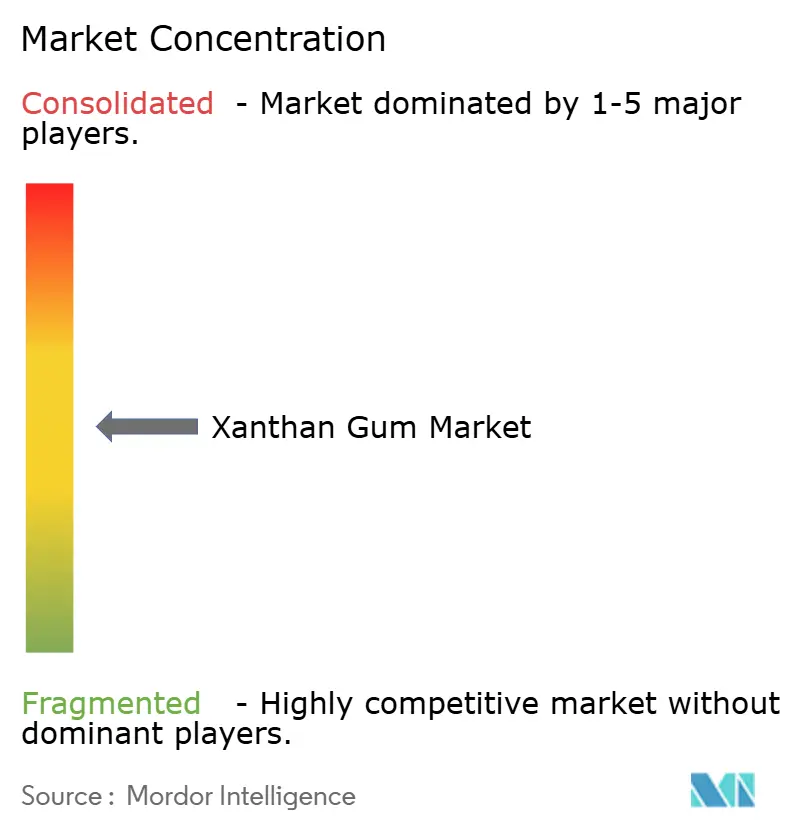
The xanthan gum market maintains a moderate concentration level, where established global manufacturers and regional producers engage in balanced competition. Market participants actively pursue opportunities through strategic cost optimization initiatives and continuous application innovation. While industry leaders Tate & Lyle PLC, Cargill, and ADM have built their competitive advantage through superior product quality, stringent regulatory compliance measures, and comprehensive technical support capabilities, Chinese manufacturers have successfully penetrated price-sensitive market segments by leveraging their cost advantages.
Companies in the market have adopted differentiation strategies by developing specialized grades tailored to specific applications. These innovations include enhanced thermal stability formulations designed for demanding oil and gas applications, alongside improved dispersibility variants engineered for efficient food processing operations. The industry's robust growth outlook is underscored by significant capacity investments, as demonstrated by Jungbunzlauer's substantial USD 200 million investment in their Canadian facility in September 2024 and Ingredion's strategic USD 50 million expansion of their Cedar Rapids operations in February 2025.
The industry's commitment to advancement is reflected in extensive patent activities focusing on fermentation optimization and product purification methods, indicating sustained efforts to reduce production costs while enhancing product performance. The market structure benefits from established regulatory barriers that favor experienced suppliers with documented compliance records. This is particularly evident in pharmaceutical and infant food applications, where extensive safety documentation requirements create substantial market entry challenges for new participants, effectively maintaining the competitive dynamics among established players.
Xanthan Gum Industry Leaders
Tate & Lyle PLC
Fufeng Group
Deosen Biochemical Ltd.
Cargill, Incorporated
Archer Daniels Midland
- *Disclaimer: Major Players sorted in no particular order
Xanthan Gum Market Companies Covered in this Report
- Tate & Lyle PLC
- Fufeng Group
- Deosen Biochemical Ltd.
- Cargill, Incorporated
- Archer Daniels Midland
- Ingredion Incorporated
- Solvay S.A.
- Jungbunzlauer Suisse AG
- Shandong Unionchem Co., Ltd.
- Hebei Xinhe Biochemical Co., Ltd.
- Foodchem International Corp.
- Meihua Holdings Group Co., Ltd.
- Qingdao BZ Oligo Biotech Co., Ltd.
- Ceamsa
- Seawin Biotech Group
- Mitsubishi Corporation
- International Flavors & Fragrances Inc.
- C.E. Roeper GmbH
- Kerry Group plc
- CP Kelco

Market Opportunities and Future Outlook
Specification tightening in major markets is creating room for differentiated, higher-purity xanthan gum and stronger documentation packages. The EU update via Commission Regulation (EU) 2026/196 in 2026, with stricter limits for lead and new maximum limits for arsenic, mercury, and cadmium for E 415, increases the value of suppliers with robust purification, contaminant monitoring, and traceability systems, particularly for premium food and pharmaceutical-adjacent applications.
Cost-down and sustainability-oriented process changes are another active opportunity across the fermentation value chain. Academic and industry research focuses on alternative, lower-cost substrates (including agricultural residues and food-processing byproducts) to reduce reliance on refined sugars, alongside bioprocess intensification and lower-solvent downstream approaches (for example, membrane filtration) aimed at managing energy and solvent footprints. On the demand side, additional regulatory pathways support application expansion beyond core foods, including EFSA FEEDAP work in 2025 related to xanthan gum as a feed additive for certain animal categories, broadening the addressable base for suppliers able to meet feed-grade specifications and customer qualification requirements.
Recent Industry Developments in Xanthan Gum Market
- April 2026: Cargill completed a EUR 25 million upgrade at its Baupte, France facility that produces carrageenan and xanthan gum, incorporating Mechanical Vapor Recompression technology. The project links manufacturing efficiency with emissions reduction, supporting customers seeking lower-footprint hydrocolloids while improving the site’s energy profile for cost management.
- February 2025: Ingredion announced a USD 50 million investment at its Cedar Rapids, Iowa facility to expand specialty industrial starch capacity for packaging and papermaking. While not a xanthan line addition, the move strengthens Ingredion’s broader natural polymer portfolio and application reach in industrial markets where texture and performance additives are co-formulated.
- September 2024: Jungbunzlauer invested USD 200 million to establish Canada’s first xanthan gum manufacturing facility in Port Colborne, Ontario, supported by a USD 4.8 million Invest Ontario grant. The facility build-out increases North American supply options and reduces reliance on imports, improving regional sourcing resilience for food and industrial users.


Xanthan Gum Market Report Scope and Research Methodology
Market Definition and Coverage
This market covers the value of xanthan gum sold as a standalone ingredient for commercial use, across major end uses such as food formulations, pharmaceuticals, personal care products, and industrial applications like drilling fluids, tracked in USD at the global level.
Scope exclusions: We exclude finished consumer products that only contain xanthan gum, plus in-house captive transfers that are not priced as external sales.
Segments Covered in This Report
- By Form
- Liquid
- Dry
- By Application
- Food and Beverages
- Bakery Products
- Confectionery
- Meat Products
- Frozen Food
- Dairy Products
- Beverages
- Others
- Pharmaceuticals
- Personal Care and Cosmetics
- Oil Refinery
- Other Applications
- Food and Beverages
- By Geography
- North America
- United States
- Canada
- Mexico
- Rest of North America
- Europe
- Germany
- United Kingdom
- Italy
- France
- Spain
- Netherlands
- Poland
- Rest of Europe
- Asia-Pacific
- China
- India
- Japan
- Australia
- Rest of Asia-Pacific
- South America
- Brazil
- Argentina
- Colombia
- Rest of South America
- Middle East and Africa
- South Africa
- Saudi Arabia
- United Arab Emirates
- Rest of Middle East and Africa
- North America
Data Sources, Market Sizing, and Validation
Desk Research
Desk work starts by mapping how xanthan gum demand is formed, since fermentation output, downstream formulation needs, and trade flows between producing and consuming regions determine where sales show up. We use public data to anchor the demand pool and to avoid assumptions that do not align with observed shipment patterns.
Typical sources we refer to include government trade and tariff statistics such as UN Comtrade and national customs portals, production and price notes from agencies such as the USGS (as applicable to inputs), food additive and safety references from regulators such as the US FDA and EFSA, and industry publications from groups such as the International Association for Food Protection. We also review company annual reports, investor presentations, and reputable press to understand capacity additions, plant utilization direction, and end-use mix changes. In a few places, paid subscriptions for company financials and patent databases are used to cross-check supplier footprints and identify new process or application activity. This source list is illustrative, and many other public and paid references were also used for data collection, validation, and clarification.
Primary Interviews and Surveys
Primary work focuses on validating what is hard to see in published data, like average realized pricing by grade, how demand shifts across food, personal care, pharma, and industrial uses, and what buyers do when input costs change. We speak with a mix of producers, distributors, formulators, and procurement and technical roles across key regions so the model assumptions can be adjusted to match on-the-ground selling patterns and shipment direction.
Distribution of primary research fieldwork respondents
| Company type | Respondent position | Region |
|---|---|---|
| Top tier: 25% | CXOs: 13% | APAC: 48% |
| Mid tier: 61% | Functional/Unit leaders: 35% | EMEA: 33% |
| Smaller Players: 14% | Managers: 52% | Americas: 19% |
Market-Sizing & Forecasting
The sizing starts with a top-down rebuild of the addressable pool by linking end-use output indicators to xanthan gum use intensity, then converting expected demand into value using price bands by form and application. Totals are corroborated with selective bottom-up checks, mainly supplier and distributor revenue direction, sample price quotes, and application-level volume logic. This step helps correct for gaps where public data is thin.
Inputs used in the model include, for example, regional processed food output and texture-stabilizer adoption, gluten-free and low-fat formulation trends that lift hydrocolloid usage, drilling activity indicators that influence drilling-fluid consumption, observed import-export balances for relevant HS codes, and average selling price movement by grade (food, industrial, and pharma oriented). When data is missing for smaller consuming countries, we fill the gaps using proxy indicators like packaged food growth and trade dependence, and then constrain the results within realistic per-capita consumption bands that interviews supported.
For forecasting, scenario analysis is used, supported by short time-series smoothing on price and demand drivers where the historical pattern is stable. The final forecast path is selected after primary discussions confirm whether capacity additions, substitution with alternative thickeners, and buyer destocking or restocking are expected to be temporary or structural.
Data Validation & Update Cycle
Outputs are checked through multiple steps so the numbers remain consistent with independent signals. We compare implied volumes and prices against trade flows, reported capacity moves, and end-use production direction, then investigate outliers at the country and application level before the model is approved.
A second analyst review is done to re-check formulas, unit conversions, and currency treatment, followed by a final sense-check against the latest news and public releases. The report is refreshed annually, and interim updates are made when there are material events like large capacity expansions, major trade restrictions, or sharp input-cost changes. Before delivery, a fresh verification pass is completed so clients receive the most current view available at that time.
Mordor Intelligence's Xanthan Gum Market Size Compared With Other Published Estimates
Different published values for xanthan gum often do not match because the counting boundary is not the same, and because price and application mixes are treated differently by each publisher. In practice, the split between food grade and industrial grade, plus how trade-linked volumes are converted into value, tends to create most of the spread.
Import-export balances by HS codes, drilling activity signals, and processed food output checks are used to keep Mordor Intelligence's estimate tied to sell-through demand rather than a broad chemicals basket that can unintentionally pull in adjacent hydrocolloids. Gaps also come from how pricing is handled, since some studies apply a single global average price, even though regional price bands move differently with input costs and freight, and from refresh cadence differences when capacity starts up or utilization changes mid-year.
Benchmark comparison
| Source | Market Size | Gaps in Research Methodology |
|---|---|---|
| Mordor Intelligence | USD 803.46 M (2026) | |
| Global Consultancy A | USD 674.34 M (2025) | Uses an earlier base year and appears to rely more on a broad market driver narrative, with less transparent separation of application mix and grade-level pricing, which can understate value when higher-priced uses expand. |
| Industry Publisher B | USD 714.10 M (2025) | Keeps a wide application scope but presents a single base-year value that can differ based on currency timing and how regional price dispersion is averaged, especially when trade-heavy regions see faster price changes. |
Taken together, the gap across figures is mainly explained by year selection, how grade and application mix are priced, and whether trade and end-use signals are used as guardrails. By keeping assumptions traceable to a few repeatable indicators and then stress-testing them with supplier and buyer feedback, the final number stays practical for planning and can be updated cleanly when new capacity or demand shifts show up.


Key Questions Answered in the Report
What is the projected value of the xanthan gum market by 2031?
The market is forecast to reach USD 948.17 million by 2031.
Which region currently holds the largest share in global sales?
Asia-Pacific leads with 35.22% of 2025 revenue.
Which form of xanthan gum is growing fastest?
Liquid grades are forecast to rise at a 5.30% CAGR through 2031.
Why is xanthan gum favored in gluten-free baking?
It replaces gluten’s network by providing viscosity that traps gas and retains moisture, yielding improved loaf volume.
How are producers mitigating supply-chain risk linked to China?
Companies such as Jungbunzlauer and Ingredion are adding production lines in North America to diversify sourcing.
Page last updated on:


 Your data is secure and never sold or shared.


