
Market Overview
| Study Period | 2021 - 2031 |
|---|---|
| Market Size (2026) | USD 23.66 Billion |
| Market Size (2031) | USD 30.48 Billion |
| Growth Rate (2026 - 2031) | 5.20 % |
| Fastest Growing Market | Asia Pacific |
| Largest Market | North America |
| Market Concentration | Medium |
Major Players
*Disclaimer: Major Players sorted in no particular order Image © Mordor Intelligence. Reuse requires attribution under CC BY 4.0. |
|
Starch Sweetener Market Analysis by Mordor Intelligence
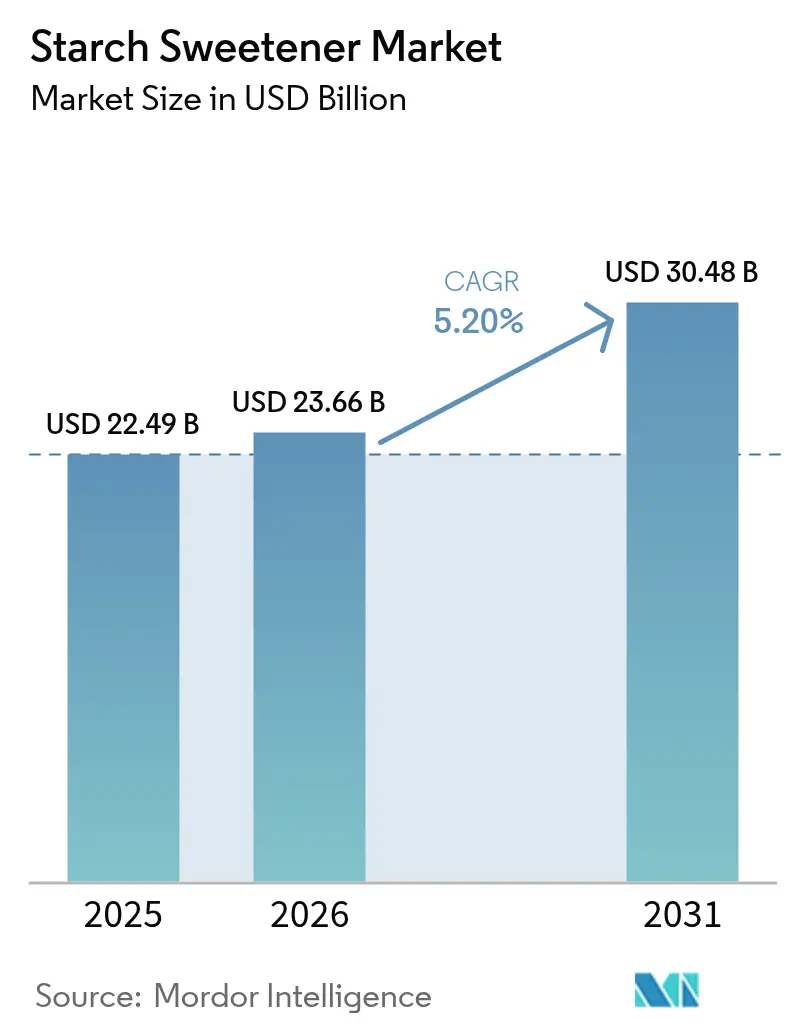
The starch sweeteners market size is expected to grow from USD 22.49 billion in 2025 to USD 23.66 billion in 2026 and is forecast to reach USD 30.48 billion by 2031 at 5.20% CAGR over 2026-2031. The market growth is driven by increased demand from the processed food industry, product reformulations focusing on reduced sugar content, and expanding pharmaceutical applications. Manufacturers are implementing advanced enzymatic and membrane technologies to reduce production cycles and energy consumption, helping manage costs during raw material price fluctuations. The Asia-Pacific region demonstrates the highest growth rate due to increasing disposable incomes and sugar reduction regulations, while North America maintains its position as the largest market volume due to its established corn processing infrastructure. The industry's shift toward diverse raw materials, including cassava, wheat, and potato starches, helps buffer against price volatility and supports environmental sustainability goals. Glucose syrups and high-fructose corn syrup (HFCS) continue to dominate the product segments, serving essential functions in food and beverage applications.
Key Report Takeaways
- By product type, high-fructose corn syrup held 47.72% of the starch sweeteners market share in 2025, while glucose syrup is forecast to expand at 6.55% CAGR between 2026-2031.
- By source, corn accounted for 64.70% share of the starch sweeteners market size in 2025, yet cassava/tapioca is projected to climb at 6.75% CAGR to 2031.
- By form, the liquid segment captured 60.55% revenue share in 2025; solid sweeteners are advancing at a 6.05% CAGR through 2031.
- By application, food and beverages dominated with a 45.10% share in 2025, whereas pharmaceuticals led growth at a 7.10% CAGR over the forecast period.
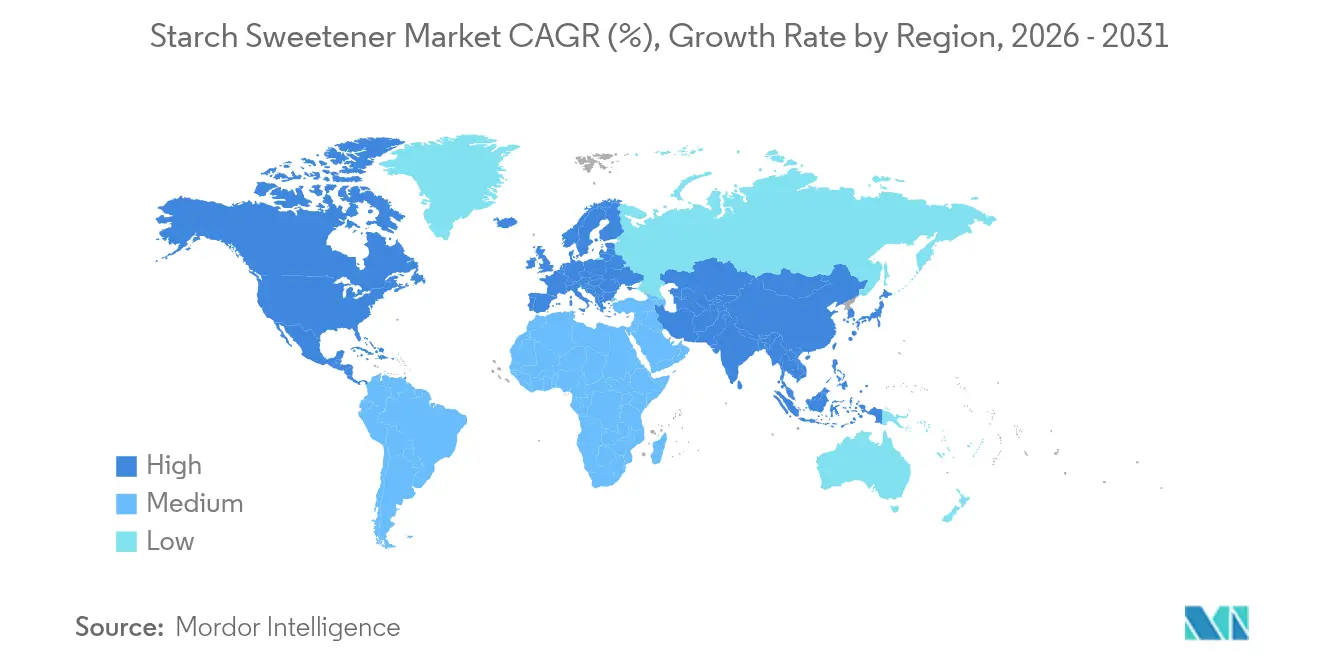
- By geography, North America controlled 45.60% of 2025 revenue, while Asia-Pacific is poised for the fastest expansion at 6.88% CAGR during 2026-2031.
Note: Market size and forecast figures in this report are generated using Mordor Intelligence’s proprietary estimation framework, updated with the latest available data and insights as of 2026.
Global Starch Sweetener Market Trends and Insights
Drivers Impact Analysis*
| Driver | (~) % Impact on CAGR Forecast | Geographic Relevance | Impact Timeline |
|---|---|---|---|
| Expanding processed food industry drives market growth | +1.2% | Global, with concentration in Asia-Pacific and North America | Medium term (2-4 years) |
| Consumer shift toward healthier alternatives | +0.9% | North America and Europe, expanding to Asia-Pacific | Long term (≥ 4 years) |
| Rising demand for natural sweeteners | +0.8% | Global, led by developed markets | Medium term (2-4 years) |
| Abundance and easy availability of feedstocks | +0.6% | North America, South America, Southeast Asia | Short term (≤ 2 years) |
| Increased awareness of health and wellness | +0.7% | Global, with early adoption in urban centers | Long term (≥ 4 years) |
| Technological advancements in enzymatic and fermentation processes | +0.5% | Global, concentrated in developed manufacturing hubs | Medium term (2-4 years) |
| Source: Mordor Intelligence | |||
Expanding Processed Food Industry Drives Market Growth
The global rise in processed and convenience food consumption is a significant driver of growth in the starch sweeteners market. As time-pressed consumers increasingly opt for ready-to-eat meals, snacks, and beverages, manufacturers are seeking ingredients that do more than simply sweeten; they must also enhance texture, support preservation, and maintain product stability throughout shelf life. According to Ayana Bio's 2023 "Ultra-Processed Food Pulse" survey, 82% of U.S. adults regularly consumed ultra-processed foods, underscoring the central role such products play in modern diets [1]Source: Ayana Bio, "Survey Data Reveals Two-thirds Of American Adults Would Eat More And Pay More For Ultra-processed Foods That Include More Nutritious Ingredients," ayanabio.com. The processed food sector's expansion creates a sustained demand for functional sweeteners, particularly starch-derived options like glucose syrups and high-fructose corn syrup (HFCS), which offer multiple technological benefits. In functional beverages, for instance, glucose syrups are increasingly used not only for sweetness but also as an energy source, particularly in immunity-boosting products gaining momentum in Asia-Pacific markets.
Consumer Shift Toward Healthier Alternatives
The global shift toward healthier food choices is emerging as a powerful driver in the starch sweeteners market, reshaping product innovation and ingredient selection. Consumers are becoming increasingly aware of the link between excessive sugar intake and chronic health conditions, particularly diabetes and obesity. According to the International Diabetes Federation's 2025 report, approximately 589 million adults aged 20-79 were living with diabetes as of 2024, with 81% residing in low- and middle-income countries. Projections indicate this number could rise to 853 million by 2045. The disease claimed 3.4 million lives in 2024 alone and drove global health expenditures beyond USD 1 trillion, a 338% increase over the past 17 years [2]Source: International Diabetes Federation, "Over 250 million people worldwide unaware they have diabetes, according to new IDF research," idf.org. These sobering figures have placed intense focus on dietary reform, propelling the demand for lower-calorie, healthier sweetening alternatives. In response, starch sweetener manufacturers are diversifying portfolios to include natural and reduced-calorie sweeteners such as stevia, monk fruit, and blends of starch-derived sweeteners with fiber or protein-based ingredients to improve glycemic response.
Rising Demand for Natural Sweeteners
The global shift toward clean-label, natural, and plant-based diets is significantly boosting the demand for naturally derived starch sweeteners. Consumers are becoming more conscious of what goes into their food, driving preference for ingredients that are not only functional but also perceived as safe and wholesome. Starch-based sweeteners sourced from corn, wheat, cassava, and potatoes are benefiting from this trend, especially when they support claims like "natural," "GMO-free," and "organic." According to Ingredion Inc.'s 2023 ATLAS study, 44% of consumers closely examine both ingredient and nutrition labels to make healthier food choices, highlighting the growing importance of transparency and clean formulations in product development [3]Source: Ingredion, "Delivering the right combination of benefits can grow dollar share and brand loyalty," ingredion.com. The International Food Information Council's 2024 report indicates that 36% of U.S. consumers associate the terms "natural" and "organic" with greater food safety, increasing trust in products that carry these labels [4]Source: IFIC, "2024 IFIC Food & Health Survey," foodinsight.org. In response, starch sweetener producers are advancing cleaner processing technologies and developing hybrid sweetening systems that combine natural starch derivatives with low-calorie alternatives.
Technological Advancements in Enzymatic and Fermentation Processes
Cutting-edge innovations in enzymatic and fermentation technologies are transforming the starch sweeteners market by improving production efficiency, sustainability, and adaptability to market demands. Traditional starch sweetener manufacturing processes are evolving through modern biocatalytic systems that enhance yield, reduce processing time, and minimize environmental impact. Enzyme optimization enables producers to control starch hydrolysis precisely, improving conversion rates and facilitating the production of glucose syrups, maltose, and high-fructose corn syrup (HFCS). Fermentation technology has expanded starch-based sweetener applications by enabling the development of clean-label, non-GMO, and specialty sweeteners with specific functional properties. These technologies support the utilization of alternative starch sources, including tapioca, cassava, and potato, which broadens feedstock options and enhances supply chain flexibility. These technological advancements result in cost-efficient processes that align with sustainability objectives and clean-label requirements.
Restraints Impact Analysis*
| Restraint | (~) % Impact on CAGR Forecast | Geographic Relevance | Impact Timeline |
|---|---|---|---|
| Health concerns and negative perceptions | -0.8% | Global, particularly in health-conscious developed markets | Long term (≥ 4 years) |
| Availability of close alternatives | -0.5% | Global, with concentration in developed markets | Medium term (2-4 years) |
| Fluctuating raw material prices | -0.6% | Global, with acute impact in import-dependent regions | Short term (≤ 2 years) |
| Limited shelf life of certain starch sweetener products | -0.3% | Global, particularly in tropical and humid climates | Short term (≤ 2 years) |
| Source: Mordor Intelligence | |||
Health Concerns and Negative Perceptions
Despite their widespread use and functional advantages, starch sweeteners face growing scrutiny due to health concerns and shifting consumer perceptions. The consumption of glucose syrup and high-fructose corn syrup (HFCS) has been associated with health issues, including obesity, type 2 diabetes, and metabolic disorders. These health implications have affected consumer perception, particularly in developed markets where consumers examine product labels and avoid processed ingredients. Global initiatives to reduce sugar consumption and increase awareness of health risks have led consumers and regulatory authorities to demand product reformulations and enhanced labeling requirements. HFCS usage has declined as food and beverage manufacturers remove or substitute it to meet clean-label and low-glycemic index requirements. The market also faces intensified competition from natural and plant-based alternatives such as stevia, monk fruit, and allulose, which consumers generally perceive as healthier options.
Fluctuating Raw Material Prices
Volatility in the prices of key raw materials such as corn, wheat, cassava, and potatoes poses a significant restraint to the starch sweeteners market. As primary feedstocks, these agricultural commodities are subject to a wide range of external factors, including climate change, geopolitical tensions, supply chain disruptions, and shifting trade policies. Even small fluctuations in global supply or demand can lead to sharp cost increases, directly impacting production margins for starch sweetener manufacturers. In regions heavily dependent on imports, currency fluctuations and logistics costs further exacerbate price instability. This unpredictability makes long-term pricing strategies difficult for both producers and end-users in the food, beverage, and pharmaceutical industries. Additionally, sustainability-driven shifts toward alternative crops or regenerative agriculture practices, while environmentally beneficial, may limit the availability or increase the cost of certain starch sources in the short term. To remain competitive, manufacturers are increasingly investing in supply chain diversification, integrated sourcing, and advanced processing technologies to optimize yields and reduce input dependency. However, until broader agricultural and trade stability is achieved, raw material price volatility will continue to be a critical challenge in the starch sweeteners industry.
*Our forecasts treat driver/restraint impacts as directional, not additive. The impact forecasts reflect baseline growth, mix effects, and variable interactions.
Segment Analysis
By Product Type: Glucose Syrups Accelerate Despite HFCS Dominance
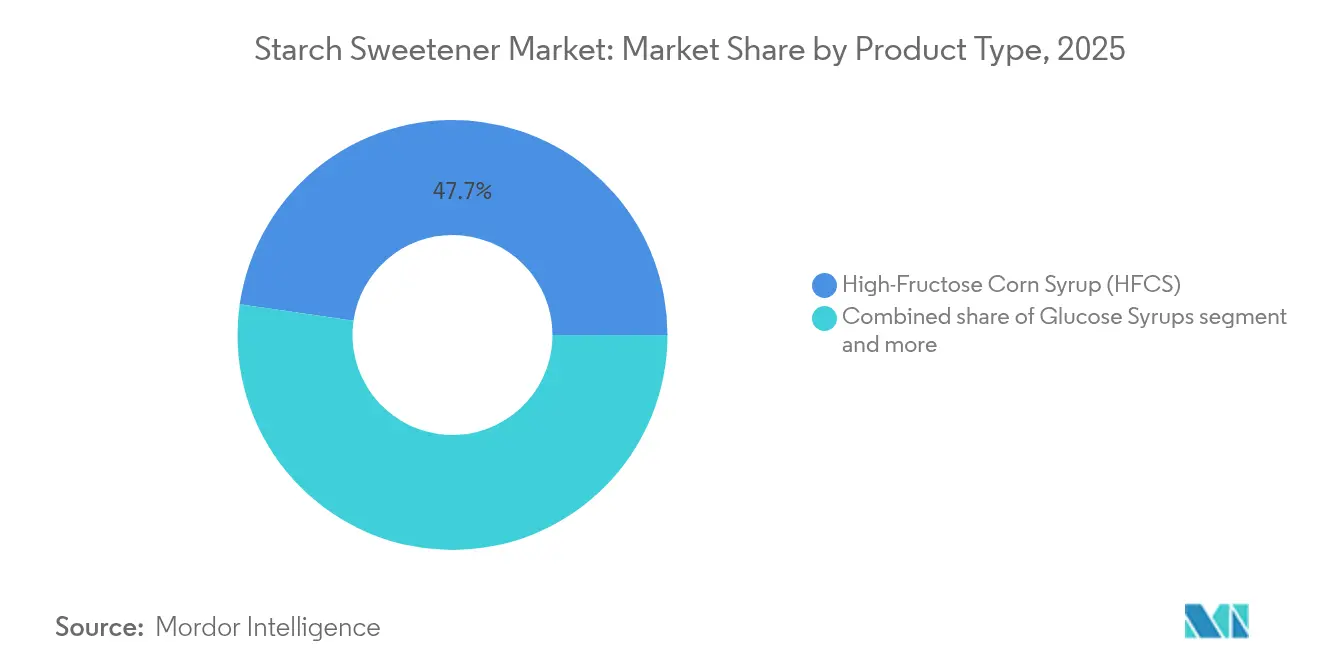
High-fructose corn syrup holds a 47.72% market share in 2025, supported by its established presence in the beverage and processed food industries and cost-effective production methods. Glucose syrups are projected to grow at a 6.55% CAGR from 2026-2031, primarily due to their applications in pharmaceuticals and alignment with clean-label trends. The adoption of enzymatic production methods for glucose syrups yields better quality and efficiency compared to acid hydrolysis, while raw materials such as cassava, wheat, and sorghum provide varied functional benefits.
Maltose syrup experiences increased adoption in Asian markets due to its moderate sweetness and compatibility with fermentation processes. Dextrin continues to expand its presence in pharmaceutical excipients and food texture modification applications. The market reflects a shift toward health-conscious alternatives while meeting technical requirements across industries. Despite its high sweetening power, fructose usage faces challenges from health-related regulations and product reformulation trends.



By Source: Cassava Disrupts Corn's Established Dominance
In 2025, corn commands a dominant 64.70% market share, underscoring its robust infrastructure and efficient processing. Meanwhile, cassava and tapioca sources are on the rise, boasting the highest growth rate at 6.75% CAGR from 2026 to 2031. This surge is largely attributed to production capacity expansions and sustainability benefits in the Asia-Pacific region. The growing demand for alternative and sustainable starch sources further drives this trend. Wheat sources leverage Europe's processing strengths and a non-GMO stance. In contrast, potato sources grapple with supply challenges due to subpar harvests in Germany, influencing global price dynamics.
The diversification toward alternative sources reflects supply chain resilience strategies and consumer preferences for varied ingredient origins. Unconventional tropical plants like Canna edulis and Xanthosoma sagittifolium emerge as potential starch sources, offering high productivity with minimal agronomic management in tropical regions. Corn steep liquor valorization through biotransformation demonstrates how processors maximize feedstock utilization, producing organic acids, enzymes, and natural pigments from processing byproducts.
By Form: Solid Sweeteners Gain Ground Through Innovation
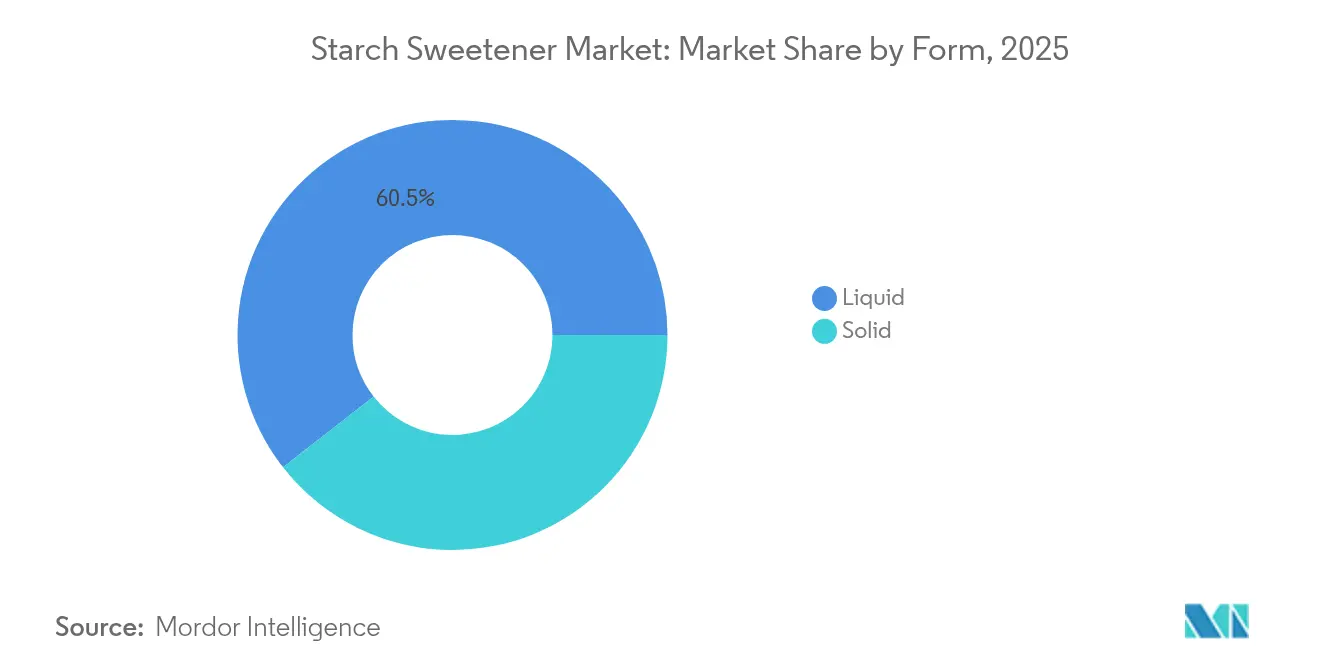
Liquid forms dominate with 60.55% market share in 2025, driven by processing convenience and established supply chains in beverage and food manufacturing. However, solid forms achieve faster growth at 6.05% CAGR from 2026-2031, propelled by pharmaceutical applications and specialty food requirements. Solid starch sweeteners offer advantages in controlled-release drug delivery systems, with modified starches demonstrating superior tablet disintegration properties and biocompatibility profiles.
Cross-linked starches enhance freeze-thaw stability and processing resistance, making them valuable in frozen food applications and industrial processes. The pharmaceutical industry's adoption of starch-based excipients drives demand for precisely controlled particle sizes and dissolution rates, with companies investing in specialized processing equipment to meet regulatory requirements. Powder handling and storage advantages of solid forms appeal to manufacturers seeking inventory optimization and reduced cold chain requirements, particularly in emerging markets with limited refrigeration infrastructure.
By Application: Pharmaceuticals Lead Innovation Wave
Food and beverages maintain the largest application share at 45.10% in 2025, encompassing traditional uses in bakery, confectionery, dairy, and beverage formulations. Pharmaceuticals emerge as the fastest-growing application at 7.10% CAGR from 2026-2031, driven by advanced drug delivery system development and regulatory approvals for novel starch-based excipients. Cyclodextrins derived from starch enhance drug solubility and bioavailability, with applications spanning oral, ophthalmic, and targeted therapies. Personal care and cosmetics applications benefit from starch sweeteners' moisturizing and texturizing properties, while other applications include industrial uses in paper manufacturing and biodegradable packaging.
The United States Department of Agriculture (USDA)'s development of starch-based delivery systems for plant-derived bioactive compounds represents a significant innovation frontier, addressing challenges in taste, solubility, and stability while promoting functional food development. The convergence of food and pharmaceutical applications creates opportunities for dual-purpose ingredients that deliver both nutritional and therapeutic benefits, aligning with consumer preferences for functional foods and preventive healthcare approaches.
Geography Analysis
North America commands a 45.60% market share in 2025, leveraging established corn processing infrastructure and mature food industry integration. Consumption growth remains steady as mass brands lower regular-sugar usage and roll out mid-calorie variants that rely on tailored glucose-fructose blends. Government partnerships promote regenerative corn cultivation, aligning supply security with environmental goals. The Asia-Pacific region is projected to grow at 6.88% CAGR from 2026 to 2031, driven by increasing health awareness, government sugar-reduction policies, and growing pharmaceutical manufacturing capabilities.
The Asia-Pacific region's agricultural production supports this expansion. The National Bureau of Statistics of China reports that farmers produced 207.5 million metric tons of rice and 140 million metric tons of wheat in 2024, which are essential raw materials for sweetener production. This domestic agricultural output enhances China's ability to manufacture starch-based sweetener alternatives. Moreover, China's revised GB 7718 food labeling regulations, which take effect in 2027, require detailed disclosure of sugar content. This regulatory change is driving manufacturers to use sweeteners derived from cassava, wheat, and rice. In Indonesia, the implementation of the Nutri-Level system is encouraging companies to develop reduced-sugar snacks, increasing the demand for glucose syrup and other sweeteners produced from starches.
Europe maintains steady demand through sustainability-focused initiatives and clean-label requirements. European Food Safety Authority (EFSA)'s clearance of isomaltulose syrup and the bloc's pending eco-design directive drive demand for low-carbon processing technologies. South America benefits from abundant cassava feedstock and newly commissioned Brazilian HFCS lines that export to regional bottlers. The Middle East and Africa represent emerging opportunities as urbanization and processed food consumption increase, though infrastructure limitations constrain immediate growth potential.

Regulatory Landscape
Regulation for starch-derived ingredients is increasingly tying sweetener selection to labeling requirements, vulnerable-population standards, and additive specifications. In the European Union, Commission Regulation (EU) 2026/196 (January 2026) tightens specifications for starch sodium octenyl succinate (E 1450), including a residual sulphur dioxide limit of 10 mg/kg (dry basis) and updated microbiological criteria. Terminology updates in EU rules replace references to soluble/solution with dispersible/dispersion, affecting compliance documentation and customer specifications.
For products intended for infants (categories 13.1.5.1 and 13.1.5.2), the maximum level for E 1450 is reduced to 10,000 mg/kg, with a final compliance deadline of February 18, 2028. That timeline is pushing suppliers to re-qualify grades, strengthen traceability, and adjust formulations for sensitive applications. In Asia-Pacific, labeling reform momentum continues to shape reformulation pathways, including China’s revised GB 7718 food labeling regulation taking effect in 2027, which requires more detailed sugar disclosure and encourages alternative sweetener strategies in packaged foods.
Value Chain Analysis
The value chain runs from crop and starch feedstocks (with corn remaining the largest source base, while cassava/tapioca and wheat expand in specific regions), through primary processing (wet milling, starch extraction, hydrolysis, and isomerization). Higher-value product systems typically add specialty conversion steps, including enzymatic and membrane processes, before downstream formulation into food and beverages, pharmaceuticals, and industrial applications. Global players such as Cargill, ADM, Ingredion, Tate and Lyle, and Roquette operate across multiple steps, using ingredient application labs alongside manufacturing assets to shorten reformulation cycles for glucose syrups, HFCS blends, and specialty sweetener systems.
Trade and logistics also influence sourcing and customer fulfillment strategies, particularly for liquid glucose. Red Sea and Suez routing disruptions persisted through 2025 and 2026, contributing to longer transit times and higher freight costs for Asia-to-Europe movements, which increases the relative value of regional manufacturing and local inventory hubs. At the same time, procurement and go-to-market models in parts of Southeast Asia are shifting as producers negotiate direct volume commitments with large beverage bottlers (for example, in Indonesia and Thailand), reducing dependence on layered distributor structures. Thailand is also used as an export manufacturing hub by some functional sugar players to diversify trade exposure and access competitive feedstock economics.
Competitive Landscape
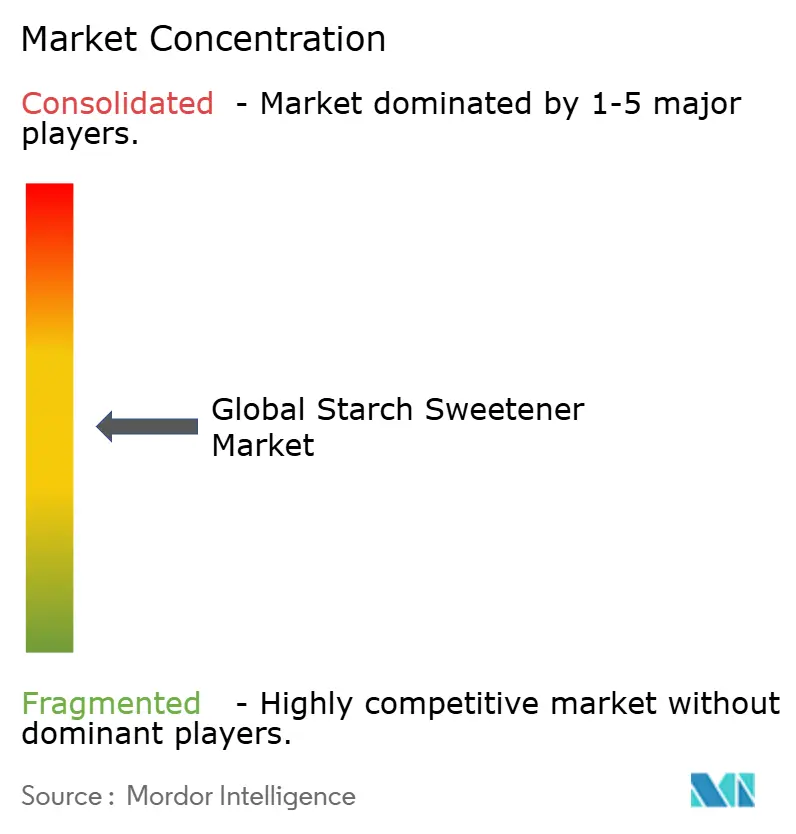
The starch sweeteners market exhibits moderate concentration, indicating competitive fragmentation that enables strategic consolidation opportunities. Global leaders such as Cargill Incorporated, Archer Daniels Midland, Tate & Lyle PLC, Ingredion Inc., and Roquette Frères pursue capacity upgrades, feedstock vertical integration, and specialty-ingredient acquisitions.
Mid-tier innovators focus on rare sugars and enzymatic breakthroughs. Roquette and Bonumose advance tagatose scale-up through proprietary biocatalysts. Roquette, Green Plains use Clean Sugar Technology to deliver low-carbon dextrose from corn fermentation with 40% lower greenhouse-gas intensity. Intellectual-property filings on enzyme immobilization, membrane filtration, and AI-guided strain development continue to rise, illustrating technology's role as a competitive differentiator.
Regional specialists, including Zhucheng Dongxiao Biotechnology in China and Gulshan Polyols in India, capture local demand through cost advantages and government support. Strategic joint ventures, exemplified by AGRANA-Ingredion's starch plant in Romania, underline the importance of geographic proximity to key customers.
Starch Sweetener Industry Leaders
-
Cargill Incorporated
-
The Archer Daniels Midland Company
-
Ingredion Inc.
-
Tate & Lyle PLC
-
Roquette Frères
- *Disclaimer: Major Players sorted in no particular order

Market Opportunities and Future Outlook
Sugar reduction programs and clean-label reformulation are creating room for integrated solutions that combine starch sweeteners with other ingredients to deliver sweetness, bulking, and texture in finished foods. In May 2026, Ingredion Incorporated entered a joint venture and acquired a 9% equity stake in Sanstar Limited to expand specialty ingredient access in Asia-Pacific. This move points to a broader expansion of regional capabilities. In July 2026, MANE acquired an exclusive global license for Arzeda's ViaLeaf Reb M technology to incorporate natural sugar reduction into reformulation strategies.
Capacity expansions and regional investments are supporting opportunities in Asia-Pacific and Europe. Ingredion's May 2026 collaboration; COFCO Biotechnology announced a 550,000-ton-per-year Taicang starch sugar facility in Taicang, Jiangsu, to serve the Yangtze River Delta (announced April 2025), and Shuangqiao (Jiaxing) Biotechnology filed for a 1,000,000-ton-per-year starch sugar and liquid sugar complex in Haining in May 2026. Shandong Bailong Chuangyuan Bio-Tech is constructing a Thailand-based facility for Allulose and Resistant Dextrin output in 2026-2027. Tighter EU additive specifications in January 2026 for E 1450, along with the February 18, 2028 infant-category compliance milestone, increases the commercial value of validated, low-residue, application-specific grades for sensitive uses.
Recent Industry Developments
- June 2026: ADM (Archer Daniels Midland) expanded its sugar reduction framework by Replace, Rebalance, Rebuild, leveraging SweetRight Stevia Echo and SweetRight Allulose to manage sweetness, flavor, and functionality in baked goods and beverages. This development supports ADM's integration of bio-based sweeteners within starch based formulations. It signals a move toward more integrated sweetener systems across starch and sweetener applications.
- June 2026: Cargill reinforced its bakery sugar reduction strategy by integrating EverSweet stevia with polyols, starches, and texturizing systems to replicate the structural roles of sugar. The approach is designed to replace sugar in core bakery products by aligning sweeteners with starch and texture systems. This strengthens Cargill’s ability to deliver sugar-reduced formulations across consumer bakery categories.
- January 2026: RSGB / Cargill India (acquirer) - RSGB acquired Cargill India's corn wet milling division in Davangere, Karnataka (~INR 250 crore). The acquisition returns RSGB to the starch business in India and strengthens local corn wet milling capacity and supply chain for starch derivatives in India. It supports expanded domestic production of starch based ingredients and related products.


Research Methodology Framework and Report Scope
Market Definition and Coverage
The market is defined as revenue from starch-based sweeteners sold in liquid or solid form for use across food, beverages, and other industrial end uses, tracked across major producing and consuming regions and converted to USD at consistent rates.
Scope exclusions: We exclude retail table sugar and high-intensity sweeteners that are not produced from starch feedstocks.
Segmentation Overview
-
By Product Type
- High-Fructose Corn Syrup (HFCS)
- Dextrin
- Fructose
- Glucose Syrups
- Maltose Syrup
- Others
-
By Source
- Corn
- Wheat
- Cassava/Tapioca
- Potato
- Others
-
By Form
- Liquid
- Solid
-
By Application
-
Food and Beverages
- Bakery and Confectionery
- Dairy and Desserts
- Beverages
- Meat and Poultry
- Other Food and Beverages
- Pharmaceuticals
- Personal Care and Cosmetics
- Other Applications
-
Food and Beverages
-
By Geography
-
North America
- United States
- Canada
- Mexico
- Rest of North America
-
Europe
- Germany
- France
- United Kingdom
- Spain
- Netherlands
- Italy
- Sweden
- Poland
- Belgium
- Rest of Europe
-
Asia-Pacific
- China
- India
- Japan
- Australia
- South Korea
- Indonesia
- Thailand
- Singapore
- Rest of Asia-Pacific
-
South America
- Brazil
- Argentina
- Chile
- Colombia
- Peru
- Rest of South America
-
Middle East and Africa
- United Arab Emirates
- South Africa
- Nigeria
- Saudi Arabia
- Egypt
- Morocco
- Turkey
- Rest of Middle East and Africa
-
North America
Data Sources, Market Sizing, and Validation
Desk Research
Desk research starts by mapping how starch sweeteners move from feedstock to end use, since the same plant can change output across syrups and polyols when margins shift. Public sources, such as USDA and FAOSTAT for crop availability, UN Comtrade for trade patterns, and Eurostat for EU production and consumption indicators, are used to anchor the supply and demand context.
We also lean on sources such as the International Starch Institute and US FDA labeling and food additive references to keep product boundaries clear, especially where sugar alcohols and specialty syrups can be grouped into broader categories. Annual reports, investor presentations, and credible press interviews help validate capacity changes, plant utilization commentary, and pricing direction. Where needed, paid subscriptions for company financials and intelligence, shipment-level import and export checks, and patent databases were used to confirm product focus shifts and new process additions. The specific list above is illustrative, and many other public and paid references were also used for data collection, validation, and clarification.
Primary Interviews and Surveys
Primary work focused on cross-checking what is actually sold as a starch sweetener, and how volumes and pricing are moving by application. We spoke with a mix of ingredient suppliers, processors, distributors, and large end users to validate share splits, typical contract structures, and substitution patterns between syrups and polyols across APAC, EMEA, and the Americas.
Distribution of primary research fieldwork respondents
| Company type | Respondent position | Region |
|---|---|---|
| Top tier: 39% | CXOs: 17% | APAC: 39% |
| Mid tier: 41% | Functional/Unit leaders: 31% | EMEA: 35% |
| Smaller Players: 20% | Managers: 52% | Americas: 26% |
Market-Sizing & Forecasting
The core model uses a top-down approach where production and trade signals are reconstructed into a demand pool for starch-derived sweeteners, and then translated into value using application-relevant price bands. To keep totals grounded, we corroborate results with selective bottom-up checks, such as sampled capacity by sweetener line, channel checks on syrup movements, and volume x ASP estimates for a handful of high-visibility product families.
Key inputs for this market include corn and cassava availability and price direction, starch processing capacity additions and utilization, import and export intensity for syrups and polyols, beverage and processed food output trends, and observed shifts in sugar reduction and labeling-driven formulations. For the forecast window, scenario analysis is built around three levers that practitioners consistently discussed, feedstock cost ranges, pricing pass-through lag, and the pace of reformulation that changes the mix between glucose syrup, HFCS type products, and sugar alcohols.
Data gaps are handled in a practical way, since not every country reports sweeteners cleanly. Where direct visibility is weak, proxy ratios are applied using trade shares, adjacent starch derivative indicators, and interview-backed conversion factors, which are then reviewed before final totals are locked.
Data Validation & Update Cycle
Outputs are checked against independent signals, such as whether modeled sweetener demand aligns with food and beverage production direction, trade balance changes, and known capacity ramps or shutdowns. When a region shows unusual jumps, we revisit assumptions and, if needed, re-contact respondents to confirm whether the shift is real or driven by reporting artifacts.
Before sign-off, the model and the written logic are reviewed in multiple steps so that unit conversions, currency timing, and scope boundaries stay consistent across years. Reports are refreshed annually, and interim updates are made when material events occur, such as sharp feedstock shocks or major plant commissioning. Right before delivery, an analyst does a fresh pass so clients receive the latest updated view.
Mordor Intelligence's Global Starch Sweetener Market Sizing Compared With Other Published Estimates
Published market sizes for starch sweeteners can look far apart, even when the same words are used, because underlying scope and pricing logic are not always aligned. Differences usually come from which sweetener families are counted, whether the figure is tied to manufacturing sales or wider ingredient resale, and how currency and average price progression are handled.
In this market, the biggest gaps tend to show up around inclusion of sugar alcohols, treatment of specialty syrups, and how much of the value chain is captured beyond producer revenues. Base year choice also matters, since feedstock-driven pricing can swing a one-year value strongly, and some estimates use more aggressive pass-through assumptions in beverages and bakery than what buyers report in contracts.
Benchmark comparison
| Source | Market Size | Gaps in Research Methodology |
|---|---|---|
| Mordor Intelligence | USD 22.49 B (2025) | |
| Trade Journal A | USD 26.21 B (2025) | This figure appears to bundle a wider starch sweeteners basket, and it likely mixes manufacturer sales with broader ingredient channel value, which can inflate totals in high-throughput regions. |
| Industry Publisher B | USD 8.41 B (2025) | This estimate seems to narrow the scope to a smaller set of syrup products and may exclude sugar alcohols and several specialty applications, which pulls the value down even if volumes are meaningful. |
The table shows a wide spread, and in Mordor Intelligence's model the value is counted at the starch sweetener product revenue level across syrups and sugar alcohols, rather than adding downstream resale markups or stripping out major product families. With clear inclusions and simple checks against trade, capacity movement, and application demand, the final number stays traceable to inputs that can be reviewed and repeated.


Key Questions Answered in the Report
What is the current size of the starch sweeteners market?
The starch sweeteners market is valued at USD 23.66 billion in 2026 and is projected to reach USD 30.48 billion by 2031.
Which segment is expanding the fastest?
Pharmaceuticals record the highest growth, with a 7.10% CAGR forecast for 2026-2031.
How large is Asia-Pacific in this market?
Asia-Pacific is the fastest-growing region at a 6.88% CAGR, driven by labelling reforms and rising disposable incomes.
Why are cassava-based sweeteners gaining attention?
Cassava grows well in tropical climates, supports non-GMO positioning, and posts the highest source-level CAGR at 6.75%.
Page last updated on:


 Your data is secure and never sold or shared.


