
Technology, Media and Telecom
5th MayPricing Strategy for Semiconductor Components
3 Min Read
The Wearable Payment Devices Market Report is Segmented by Device Type (Smart Watches, Fitness Trackers, and More), Technology (Near-Field Communication (NFC), Radio Frequency Identification (RFID), and More), Application (Retail and Grocery Stores, Healthcare Facilities, and More), Sales Channel (Direct Sales, Indirect Sales), and Geography. The Market Forecasts are Provided in Terms of Value (USD).
Market Overview
| Study Period | 2020 - 2031 |
|---|---|
| Market Size (2026) | USD 82.16 Billion |
| Market Size (2031) | USD 184.03 Billion |
| Growth Rate (2026 - 2031) | 17.49 % CAGR |
| Fastest Growing Market | Asia Pacific |
| Largest Market | North America |
| Market Concentration | Medium |
Major Players *Disclaimer: Major Players sorted in no particular order. Image © Mordor Intelligence. Reuse requires attribution under CC BY 4.0. |
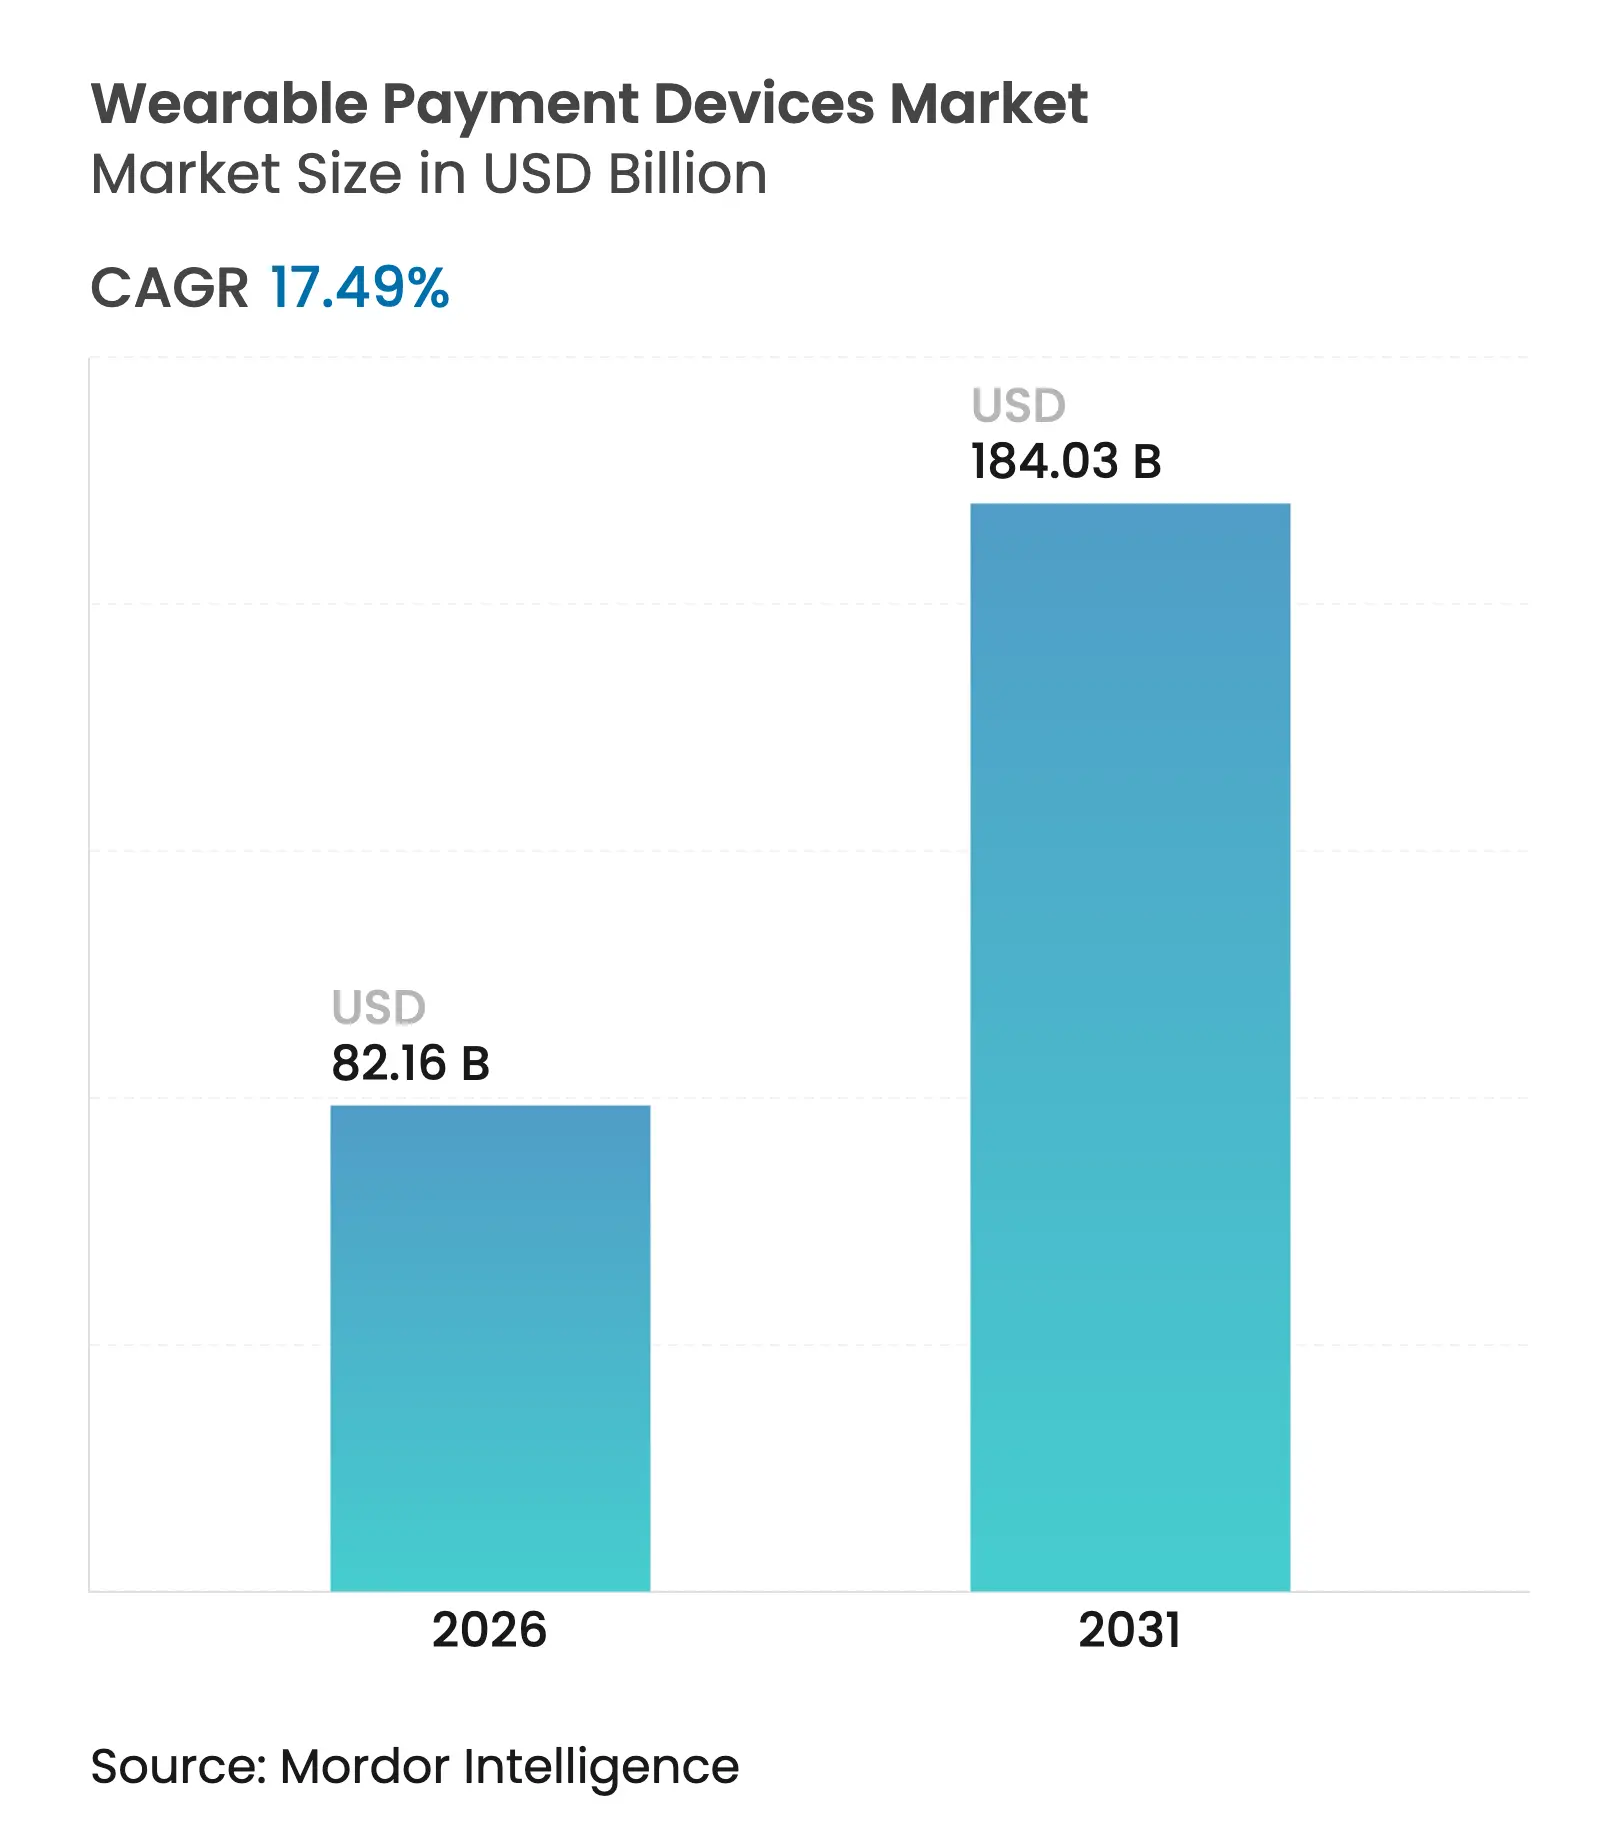
The wearable payment devices market size is expected to grow from USD 69.95 billion in 2025 to USD 82.16 billion in 2026 and is forecast to reach USD 184.03 billion by 2031 at 17.49% CAGR over 2026-2031. Strong preference for contactless payments, continuous innovation in miniaturized electronics, and financial-sector tokenization programs underpin this expansion. Consumers are gravitating toward form factors that blend health‐tracking, identity verification, and payments in one device, shifting competitive emphasis from hardware differentiation to integrated service ecosystems. Device makers are investing in biometric security, while payment networks scale tokenization rails that lower fraud risk and open acceptance in public transit, retail, and fitness venues. As a result, partnerships among technology companies, issuers, and acquirers are becoming central to market penetration strategies, particularly in emerging economies where smartphone-led payment habits accelerate wearable adoption.
Key Report Takeaways
Note: Market size and forecast figures in this report are generated using Mordor Intelligence's proprietary estimation framework, updated with the latest available data and insights as of 2026.
Drivers Impact Analysis
| Driver | (~) % Impact on CAGR Forecast | Geographic Relevance | Impact Timeline | |||
|---|---|---|---|---|---|---|
Surge of Tokenized NFC Transactions in European Mass-Transit Systems Surge of Tokenized NFC Transactions in European Mass-Transit Systems | +5.3% | Europe, with spillover to North America | Medium term (2-4 years) | (~) % Impact on CAGR Forecast :+5.3% | Geographic Relevance :Europe, with spillover to North America | Impact Timeline :Medium term (2-4 years) |
Biometric-Enabled Wearables Accelerating KYC-less Payments in North America Biometric-Enabled Wearables Accelerating KYC-less Payments in North America | +4.4% | North America, with adoption spreading to Europe | Short term (≤ 2 years) | |||
Subsidized POS Upgrade Programs in Southeast Asia Boosting Wearable Acceptance Subsidized POS Upgrade Programs in Southeast Asia Boosting Wearable Acceptance | +3.5% | Southeast Asia, with expansion to broader APAC | Medium term (2-4 years) | |||
Rise of "Pay-as-You-Train" Gym Membership Models Driving Fitness-Tracker Payments Rise of "Pay-as-You-Train" Gym Membership Models Driving Fitness-Tracker Payments | +2.7% | North America, Europe, Urban APAC | Short term (≤ 2 years) | |||
Embedded SIM (eSIM) Adoption Unlocking Cross-Border Wristband Payments Embedded SIM (eSIM) Adoption Unlocking Cross-Border Wristband Payments | +1.8% | Global, with early adoption in Europe and North America | Long term (≥ 4 years) | |||
| Source: Mordor Intelligence | ||||||
Surge of tokenized NFC transactions in European mass-transit systems
European transit operators have replaced closed-loop cards with open-loop, tokenized NFC payments that shorten boarding times and elevate security. London and other major hubs now treat a commuter’s smartwatch or ring as an all-access ticket, which quickly normalizes wearable payments for daily retail purchases surrounding stations. Visa reports that more than one-third of its global transactions are now contactless, with transit forming a significant share of first-time tap experiences. [1]Visa, “Transforming Urban Mobility,” visa.com Merchants capitalizing on this routine behavior see higher throughput and reduced cash handling costs.
Biometric-enabled wearables accelerating KYC-less payments in North America
Smart rings and advanced smartwatches now embed fingerprint, heartbeat, or vein-pattern sensors that authenticate a user continuously. This persistent identity model allows issuers to front-load Know Your Customer checks at device activation, streamlining subsequent transactions at the point of sale. Financial institutions gain risk-reduction benefits, while consumers enjoy frictionless payment flows. Early adoption by fitness-oriented millennials and Gen Z is pushing retailers to upgrade terminals to accept these devices, fostering a virtuous cycle of demand and acceptance.
Subsidized POS upgrade programs in Southeast Asia boosting wearable acceptance
Governments in Vietnam, Indonesia, and Thailand offer financial incentives that lower the cost of NFC-ready point-of-sale terminals for small merchants. In Vietnam, consumer usage of QR codes surged to 62% in 2023 from 35% in 2021. [2]Man The Nguyen & Tho Alang, “When do shoppers prefer using QR codes? Empirical evidence from Vietnam,” Future Business Journal, springeropen.com The resulting infrastructure backbone means a shopper with a basic fitness tracker or smartwatch can transact without carrying cash, jump-starting usage even in wet markets and street-side stalls. Payment networks view the region as a testing ground for low-cost tokenization solutions that can be exported to similar cash-heavy economies.
Rise of “pay-as-you-train” gym membership models
Fitness chains in the United Kingdom and United States increasingly tie access fees to actual facility usage, deducted automatically through NFC-enabled trackers that double as entry credentials and payment instruments. The UK fitness industry expanded 6.1% in 2024 to reach 11.5 million members and generated GBP 5.7 billion (USD 7.3 billion) in revenue. [3]ukactive, “UK Health & Fitness Market Report 2025,” ukactive.com Casual users, once deterred by flat monthly plans, now embrace micro-billing that tracks workout sessions, widening the customer base for both gyms and wearable providers.
Restraints Impact Analysis
| Restraint | (~) % Impact on CAGR Forecast | Geographic Relevance | Impact Timeline | |||
|---|---|---|---|---|---|---|
PCI-DSS 4.0 Mandates Inflating Compliance Costs for OEMs PCI-DSS 4.0 Mandates Inflating Compliance Costs for OEMs | -2.7% | Global, with heightened impact in North America and Europe | Short term (≤ 2 years) | (~) % Impact on CAGR Forecast :-2.7% | Geographic Relevance :Global, with heightened impact in North America and Europe | Impact Timeline :Short term (≤ 2 years) |
Lithium-ion Supply Constraints Limiting Premium Smart-Watch Shipments Lithium-ion Supply Constraints Limiting Premium Smart-Watch Shipments | -1.8% | Global, with manufacturing impacts concentrated in Asia | Medium term (2-4 years) | |||
Low Consumer Trust in Data Privacy for Ring-based Payments in DACH Region Low Consumer Trust in Data Privacy for Ring-based Payments in DACH Region | -1.4% | Germany, Austria, Switzerland, with spillover to broader Europe | Short term (≤ 2 years) | |||
Fragmented QR Code Standards in Latin American Retail Fragmented QR Code Standards in Latin American Retail | -1.2% | Latin America, particularly Brazil, Argentina, and Mexico | Medium term (2-4 years) | |||
| Source: Mordor Intelligence | ||||||
PCI-DSS 4.0 mandates inflating compliance costs for OEMs
The 2024 introduction of PCI-DSS 4.0 compels device makers to embed stronger encryption, multi-factor authentication, and continuous vulnerability monitoring in every payment-capable wearable. Smaller brands face certification fees and security audit schedules that strain working capital, slowing their product roadmaps and nudging them toward white-label partnerships with larger firms that already maintain compliance programs. [4]PCI Security Standards Council, “Payment Card Industry Data Security Standard: Requirements and Testing Procedures, v4.0.1,” pcisecuritystandards.org This dynamic raises entry barriers and may concentrate market share among well-capitalized incumbents.
Lithium-ion supply constraints limiting premium smartwatch shipments
Battery-grade lithium remains in short supply amid competing demand from electric vehicles and grid storage. Premium smartwatches require high-density cells to power bright displays and continuous biometric scanning, so manufacturers must either cut production forecasts or redesign devices for energy frugality. Material flow analysis suggests cumulative lithium demand will reach 6.65 million tons by 2050, signaling persistent pressure on supply chains. R&D teams are therefore exploring silicon-anode blends and flexible pouch architectures, but large-scale commercial adoption may take several years.
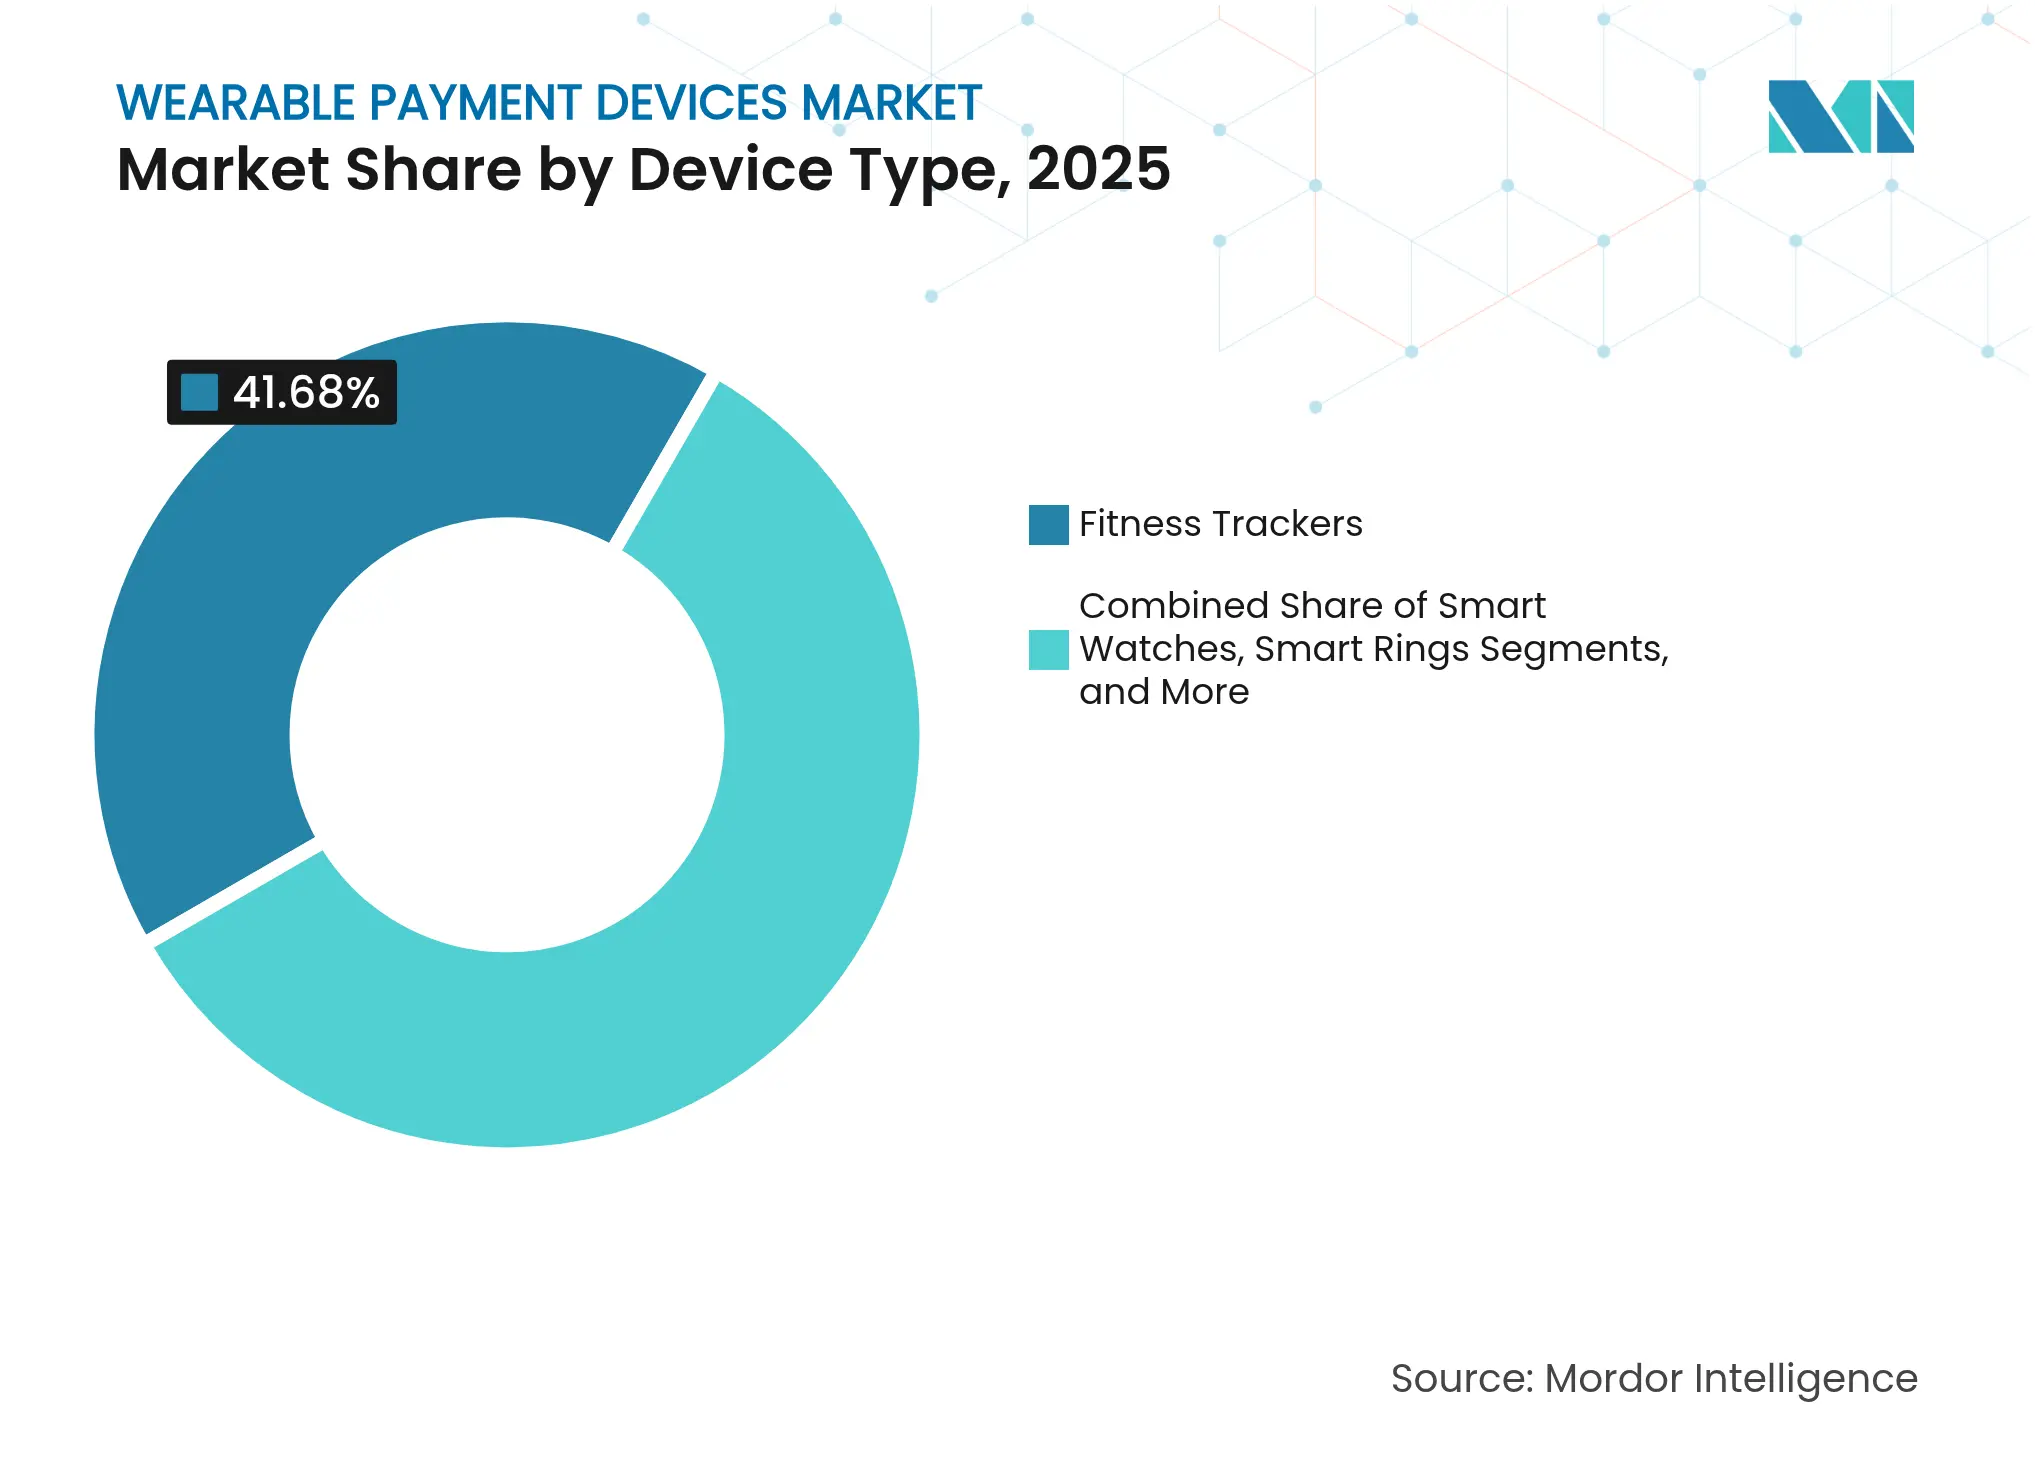
By Device Type: smart rings gain momentum within an evolving form-factor mix
The wearable payment devices market size for device types reached USD 34.16 billion in 2025, with fitness trackers accounting for a 41.68% share. The entrenched presence of trackers in health monitoring made it straightforward for vendors to embed NFC chips, converting millions of casual fitness users into contactless payers. Smartwatches still enjoy extensive app ecosystems and larger screens that facilitate on-watch receipt confirmation, yet production volumes remain tethered to lithium-ion availability.
Smart rings are the breakout category, forecast to post a 23.1% CAGR over 2026-2031. Their discreet design appeals to fashion-conscious consumers, while the contiguous skin contact enables continuous biometric validation. Samsung’s July 2024 Galaxy Ring launch confirmed mainstream intent and sparked follow-on announcements from startup rivals. Manufacturing hurdles such as antenna miniaturization and power management are easing, thanks to breakthroughs in flexible lithium-ion and ultra-low-power NFC controllers. As these challenges resolve, the smart-ring submarket is expected to expand its footprint into enterprise access control and hospitality check-in, broadening the wearable payment devices market.
Note: Segment shares of all individual segments available upon report purchase
By Technology: QR codes mount a rapid challenge to NFC dominance
The NFC protocol held 57.44% share in 2025 and remains foundational to high-value tap-to-pay experiences across North America and Europe. NFC’s robust security, standardized frequency at 13.56 MHz, and seamless integration with payment network tokenization keep it firmly embedded in mid-to-premium wearables. Nevertheless, QR and Barcode systems are scaling at a 21.78% CAGR, propelled by lower merchant hardware costs and ubiquitous smartphone camera compatibility. Governments in Southeast Asia actively endorse national QR standards that bypass legacy card infrastructure, nudging merchants to accept quick-scan payments that, by extension, validate QR-capable wearables.
Hybrid solutions are gaining traction, with flagship smartwatches embedding dual radios and on-device code generators. Such versatility cushions OEMs from regional standard fragmentation while delivering unified user experiences worldwide. Radio Frequency Identification retains relevance in closed-loop settings such as amusement parks, but its share is projected to decline as open-loop schemes see broader international acceptance.
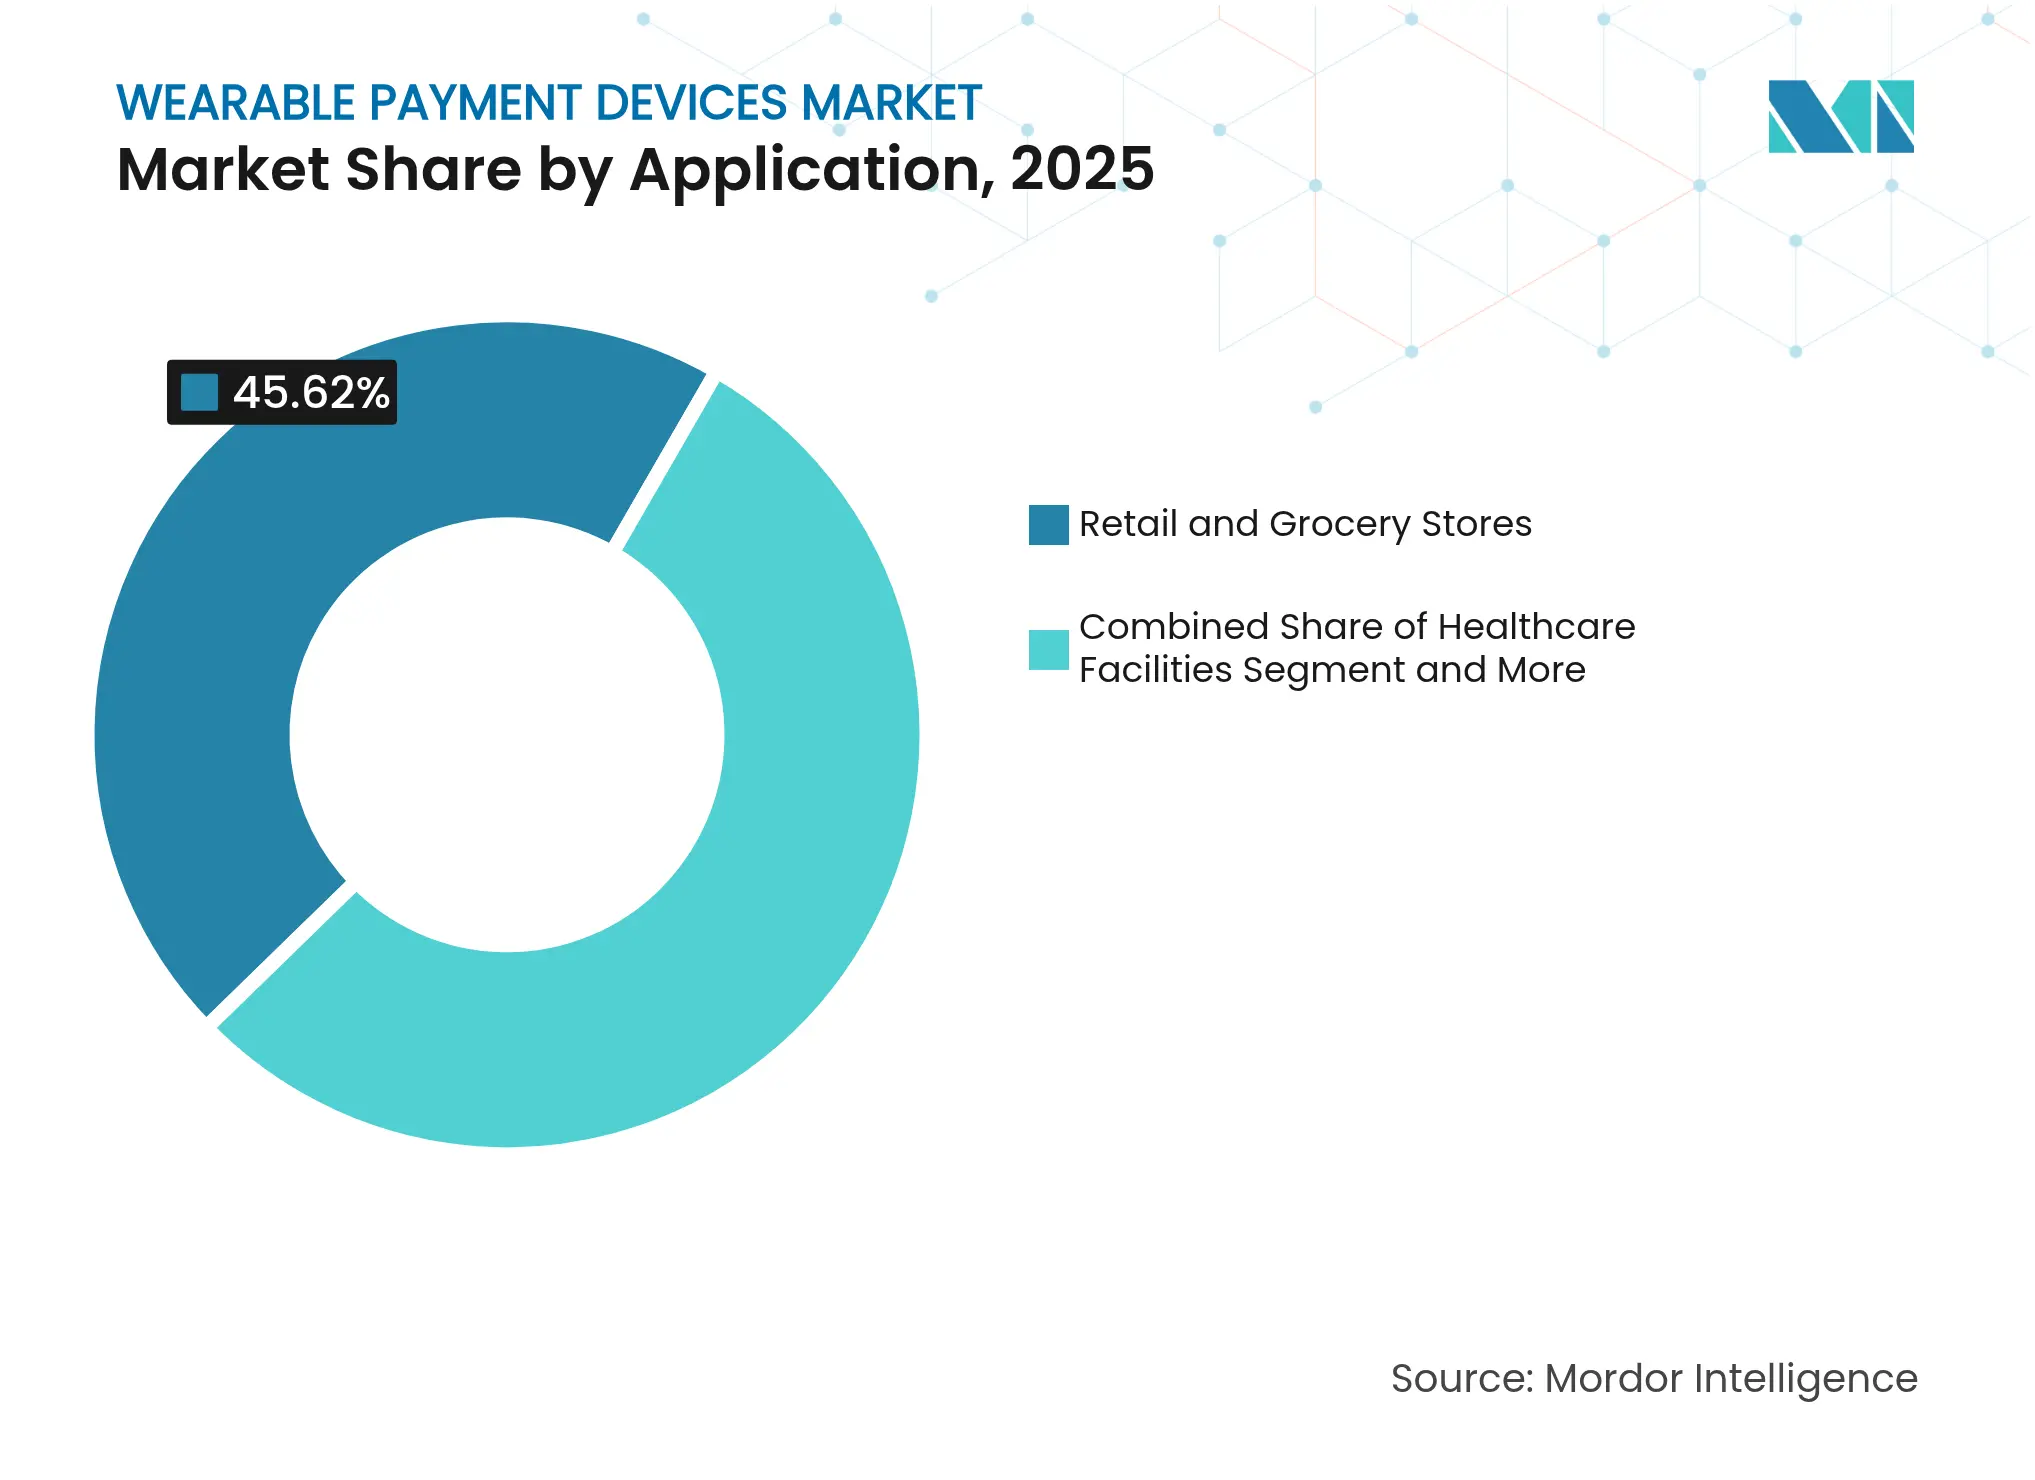
By Application: transit ecosystems accelerate consumer habituation to wearable payments
Retail and grocery stores represented 45.62% of application revenues in 2025, leveraging early pin-and-chip terminal upgrades that now support contactless. Yet transportation and ticketing is on track for a 22.05% CAGR through 2031, making it the fastest-growing application cluster. Open payment architecture in buses, metros, and commuter rails encourages daily tap behavior, effectively marketing wearable payments at scale. The trend feeds a network effect: once a commuter pays the fare with a ring, that ring becomes the default wallet at convenience stores inside the station.
Healthcare facilities follow closely, integrating wearables for patient identification and cafeteria purchases, aligning with HIPAA-compliant tokenization practices. Fitness and recreational centers, driven by usage-based pricing, blend workout metrics with micro-payments that update membership wallets in real time. Event venues and hospitality operators also explore payment wristbands that collapse ticketing, identity, and cashless spend into one artifact, reinforcing the cross-vertical appeal of the wearable payment devices market.
Note: Segment shares of all individual segments available upon report purchase
By Sales Channel: direct-to-consumer accelerates service-centric monetization
Indirect distribution through electronics retailers, mobile carriers, and e-commerce marketplaces commanded 63.25% share in 2025, fueled by broad channel reach and bundling with airtime packages. However, direct-to-consumer (DTC) storefronts are poised for a 19.52% CAGR as manufacturers seek higher lifetime value and richer customer data. Premium players now bundle subscription-based health insights, extended warranties, and exclusive accessory drops, all orchestrated from proprietary web shops and apps. This model elevates customer stickiness and provides recurring revenue that cushions hardware replacement cycles.
The rise of DTC also aligns with growth in embedded finance. Some brands pre-install virtual debit accounts on shipped devices, enabling instant activation and top-up via in-app rails rather than third-party wallets. Emerging-market consumers, who often lack traditional cards, benefit from such one-stop onboarding, helping the wearable payment devices market penetrate cash-heavy demographics.
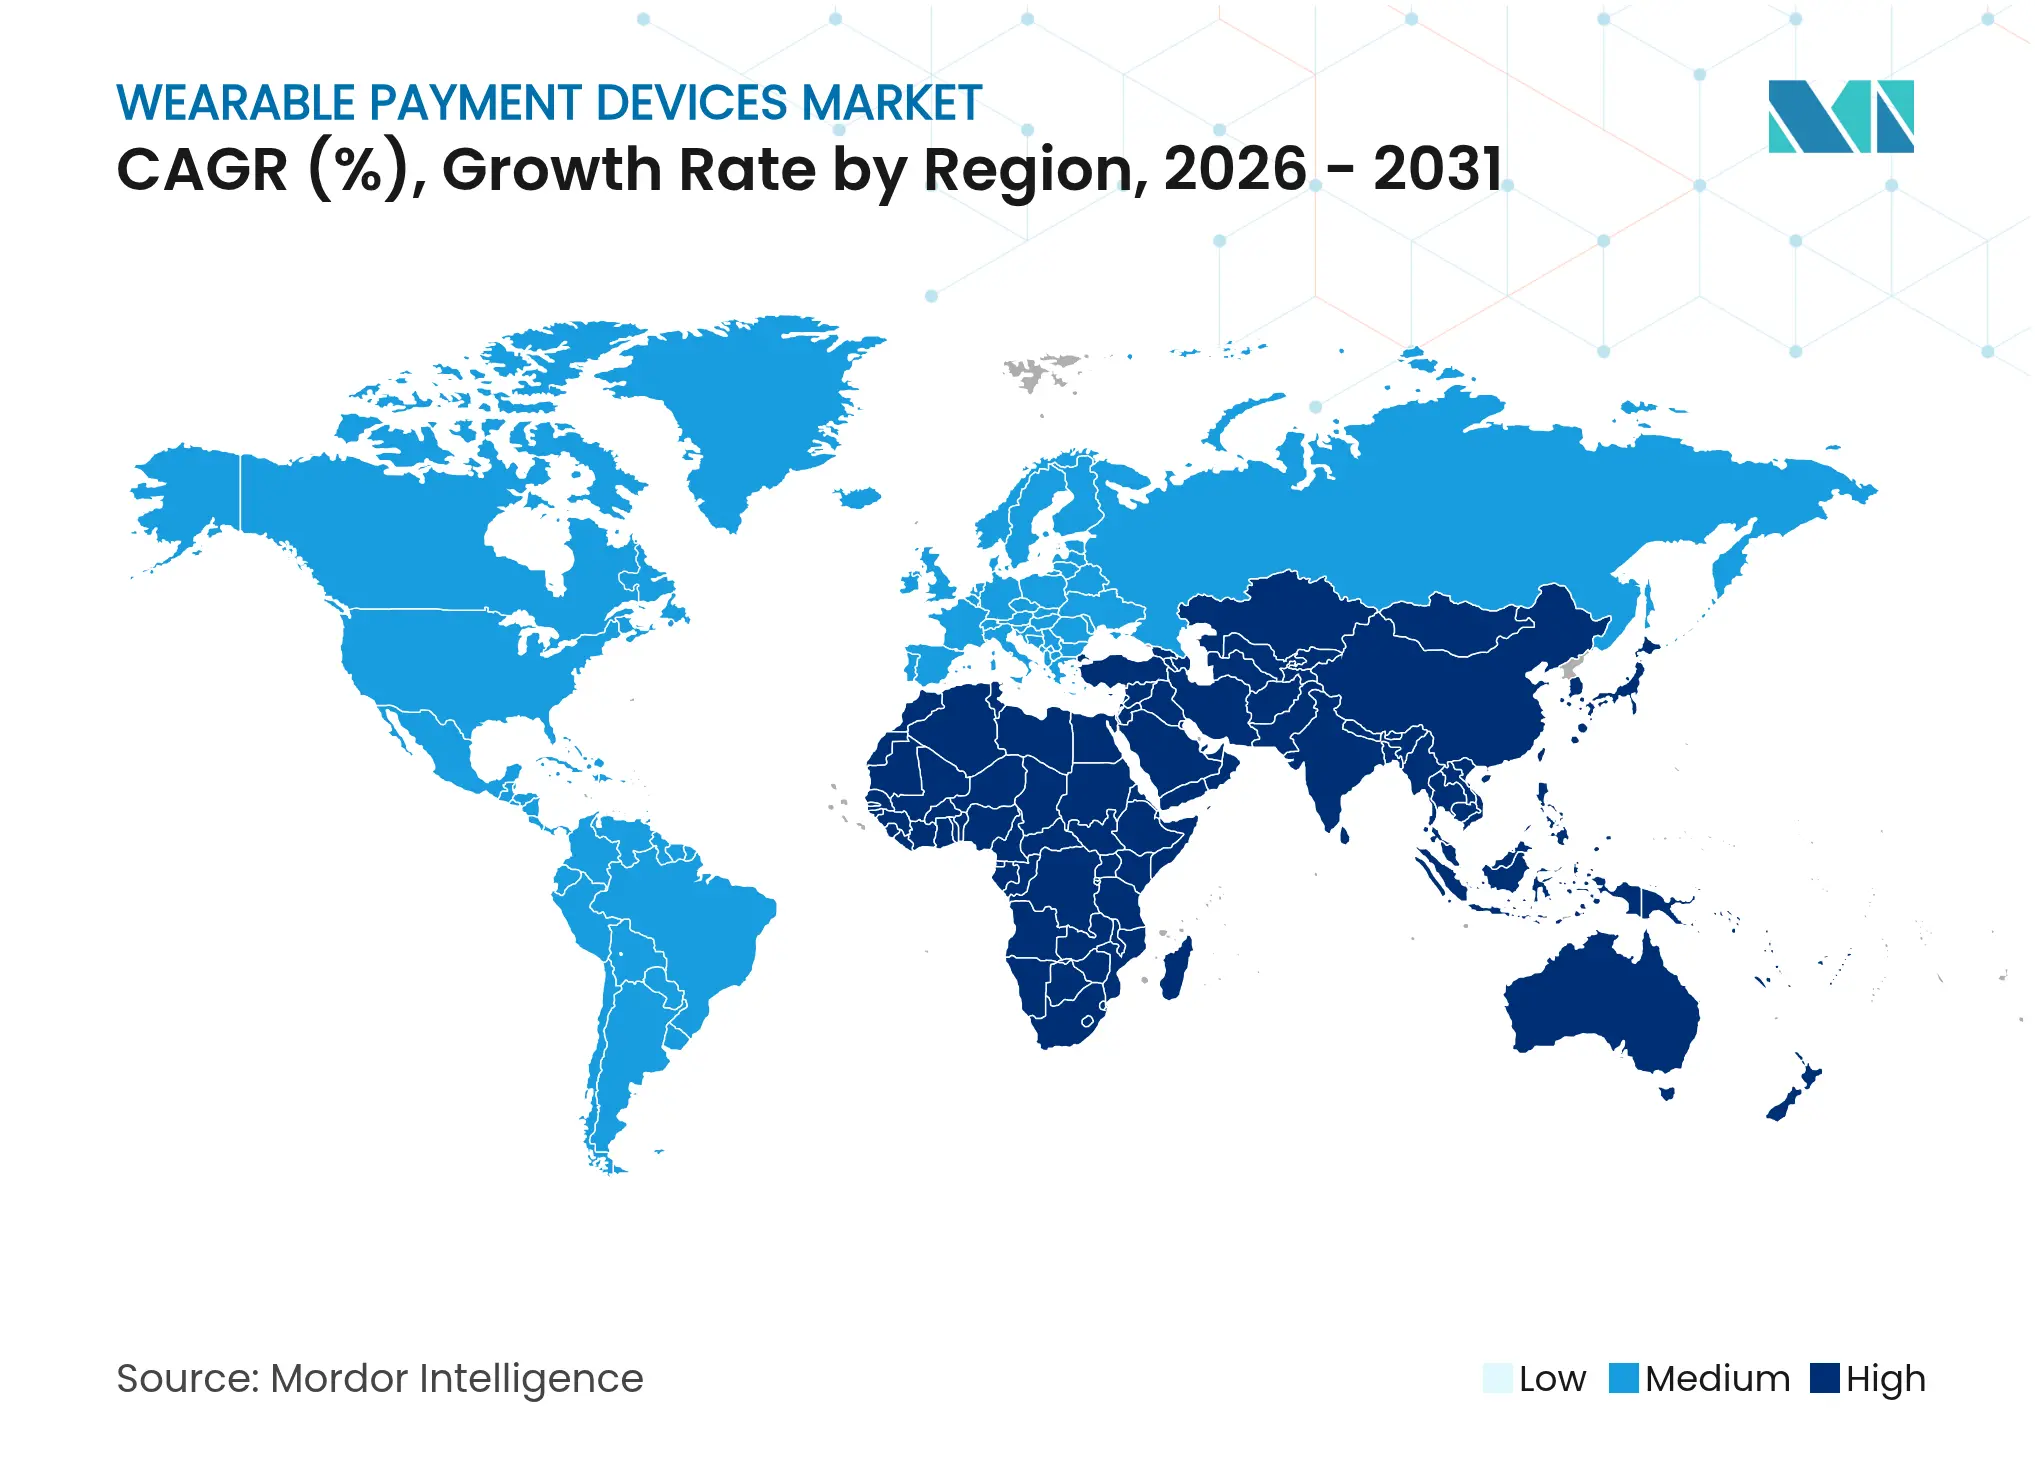
North America generated the largest regional revenue, capturing 29.96% of the wearable payment devices market in 2025. High contactless penetration, an established issuer-acquirer network, and consumer appetite for biometric security underpin the region’s leadership. The United States showcases deep collaboration between technology companies and financial institutions that launch co-branded devices bundled with loyalty programs. Canada complements this momentum through open banking initiatives that foster secure data sharing across fintech and health insurance ecosystems.
Asia-Pacific is the fastest-growing region and is expected to deliver a 19.88% CAGR from 2026-2031. China’s super-app culture normalizes QR-based micropayments, providing fertile ground for wristbands and rings that integrate seamlessly with in-app wallets. India’s Unified Payments Interface makes token provisioning straightforward, while Japan and South Korea exhibit early adoption of multimodal biometric authentication in mass transit. Southeast Asian governments actively subsidize NFC POS upgrades, adding new acceptance nodes daily and lowering friction for wearables launched by domestic smartphone brands.
Europe maintains strong momentum on the back of standardized open-loop transit fares that catalyze habitual tap-to-pay behavior. The UK spearheads rollout of biometric smart rings in boxing gyms and boutique wellness studios, while Germany focuses regulatory attention on privacy assurances to unlock DACH adoption. In Latin America, urban Brazil, Argentina, and Mexico experience sporadic growth restrained by fragmented QR standards, but private-sector coalitions are coalescing to harmonize specifications. Middle East and Africa remains nascent yet attractive, with Dubai’s hospitality corridor piloting NFC wristbands that serve as hotel keys, loyalty IDs, and retail wallets for international visitors.
Market Concentration
Competition is intensifying across devices, platforms, and value-added services. Apple, Samsung, and Google anchor the smartwatch and fitness tracker tiers, leveraging proprietary operating systems and vertically integrated chipsets to optimize power consumption and security. These incumbents partner with Visa and Mastercard to embed network token vaults directly on secure elements, minimizing issuer integration overhead. The mid-market witnesses fiercer fragmentation, as Xiaomi, Amazfit, and Huawei iterate rapidly on low-cost models for price-sensitive consumers in Asia and Latin America.
Smart rings represent a differentiated battleground. Oura Health maintains first-mover advantage in biometric analytics, while McLear focuses on minimalist design that disguises payment credentials within jewelry-grade titanium. Samsung’s Galaxy Ring entry broadened retail shelf space and validated the category for mainstream buyers. Component suppliers such as Infineon and NXP couple secure NFC controllers with energy-harvesting modules, letting OEMs shrink battery footprints and extend standby time. At the service layer, fintech newcomers launch ring-only digital banks that bypass plastic, drawing interchange and subscription revenue away from traditional issuers.
Strategic moves in 2024-2025 highlight a pivot toward vertical integration. Mastercard rolled out embedded SDKs that let device makers tap network tokenization without external secure elements, while Thales introduced chipsets pre-certified for PCI-DSS 4.0, reducing OEM compliance cycles. Garmin expanded its running-watch portfolio with higher-grade payment security, targeting endurance athletes who value both ruggedness and cashless convenience. These developments underscore a shift from hardware-led differentiation to holistic ecosystems where data insights, security credentials, and recurring services decide market share.

*Disclaimer: Major Players sorted in no particular order
1. INTRODUCTION
2. RESEARCH METHODOLOGY
3. EXECUTIVE SUMMARY
4. MARKET LANDSCAPE
5. MARKET SIZE AND GROWTH FORECASTS (VALUES)
6. COMPETITIVE LANDSCAPE
7. MARKET OPPORTUNITIES AND FUTURE OUTLOOK
Wearable payment devices, including smartwatches, fitness bands, rings, and clothing accessories, are compact gadgets with payment technology. These devices enable users to transact without needing cash, cards, or smartphones. They support contactless payments using technologies such as Near Field Communication (NFC) and Radio Frequency Identification (RFID). Designed for convenience and security, these devices are increasingly adopted by consumers seeking efficient and seamless payment methods.
The wearable payments devices market is segmented by type (fitness trackers, smart watches, payment wristbands, smart rings), by technology (near-field communication technology (NFC), radio frequency identification (RFID), QR and barcode), by applications (healthcare, retail, transportation, fitness, others), by geography (North America [United States, Canada, Mexico, and Rest of North America], Europe [Germany, United Kingdom, France, Spain, and Rest of Europe], Asia-Pacific [India, China, Japan, New Zealand, Australia and Rest of Asia-Pacific], Latin America [Brazil, Argentina, and Rest of Latin America], Middle East and Africa [United Arab Emirates, Saudi Arabia, and Rest of Middle East and Africa]).
The report offers market forecasts and size in value (USD) for all the above segments.
Pricing Strategy for Semiconductor Components
3 Min Read
Accelerating Additive Manufacturing Adoption in India
3 Min Read
US Market Entry for Taiwanese Machine Tool Manufacturers
5 Min Read
When decisions matter, industry leaders turn to our analysts. Let’s talk.