
Market Overview
| Study Period | 2020 - 2031 |
|---|---|
| Forecast Data Period | 2026 - 2031 |
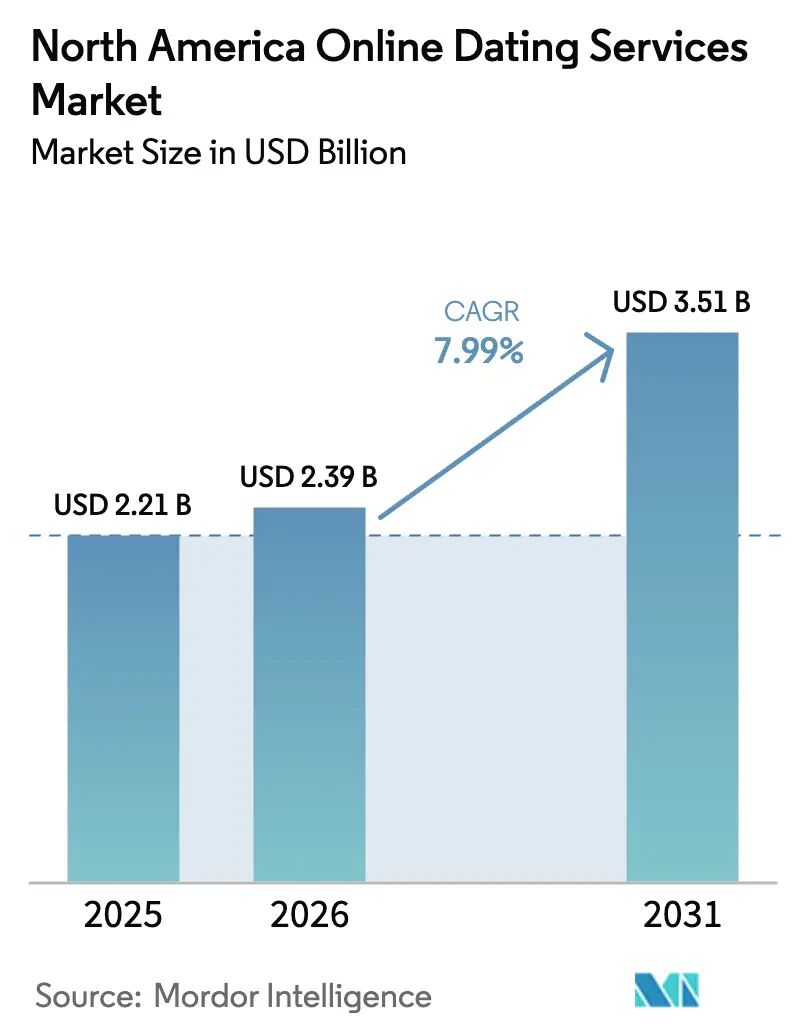
| Base Year Market Size (2025) | USD 2.21 Billion |
| Market Size (2026) | USD 2.39 Billion |
| Market Size (2031) | USD 3.51 Billion |
| Growth Rate (2026 - 2031) | 7.99 % |
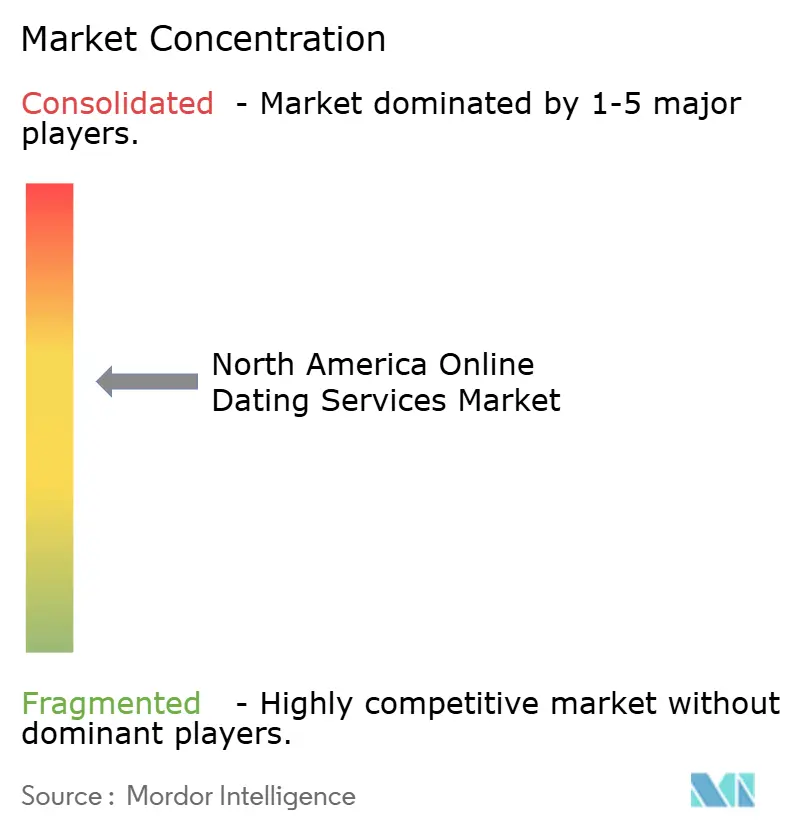
| Market Concentration | Medium |
Major Players *Disclaimer: Major Players sorted in no particular order Image © Mordor Intelligence. Reuse requires attribution under CC BY 4.0. | |
North America Online Dating Services Market Analysis by Mordor Intelligence
North America online dating services market size in 2026 is estimated at USD 2.39 billion, growing from 2025 value of USD 2.21 billion with 2031 projections showing USD 3.51 billion, growing at 7.99% CAGR over 2026-2031. Strong smartphone penetration, rapid integration of artificial intelligence, and a growing preference for digital-first relationship formation underpin this sustained expansion. Premium safety features, video-led engagement formats, and demographic diversification toward older user cohorts further reinforce revenue resilience. Competitive intensity remains high, yet established brands leverage network effects, data science capabilities, and granular micro-transaction pricing to defend their positions and capture incremental wallet share. Monetization strategies increasingly prioritize value extraction from existing users rather than pure volume growth, signaling a mature yet opportunity-rich landscape for differentiated offerings within the North America online dating services market.
Key Report Takeaways
- By service type, non-paying online dating held 62.10% of the North America online dating services market share in 2025, while the paying segment is forecast to expand at a 10.35% CAGR through 2031.
- By revenue model, subscription-based offerings accounted for 53.60% of the North America online dating services market size in 2025; à-la-carte micro-transactions are set to grow at a 12.35% CAGR over 2026-2031.
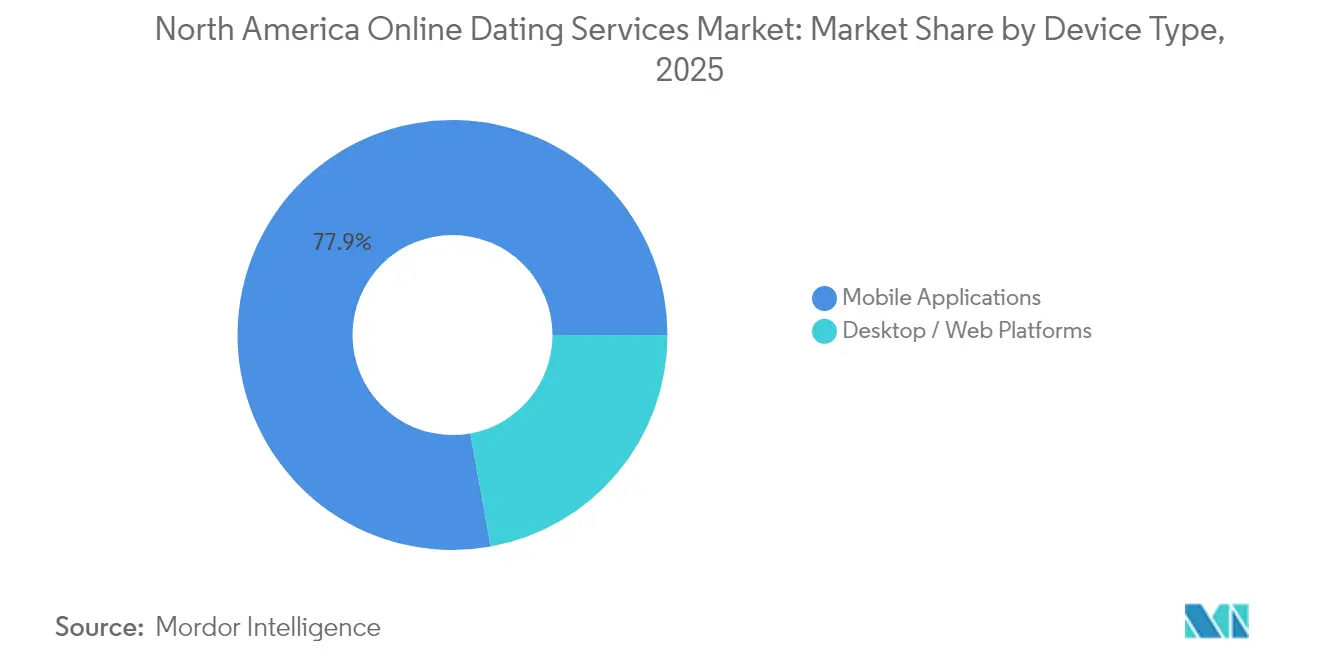
- By device type, mobile applications dominated with 77.85% revenue share in 2025, whereas desktop/web platforms are projected to record 11.1% growth to 2031.
- By age group, the 30–40 years cohort led with 38.10% of the North America online dating services market size in 2025; the 40 + years segment is advancing at a 9.6% CAGR.
- By country, the United States captured 83.10% of the North America online dating services market share in 2025, while Mexico is projected to grow at an 10.9% CAGR.
Note: Market size and forecast figures in this report are generated using Mordor Intelligence’s proprietary estimation framework, updated with the latest available data and insights as of 2026.
Market Trends and Insights
Drivers Impact Analysis of North America Online Dating Services Market*
| Driver | (~) % Impact on CAGR Forecast | Geographic Relevance | Impact Timeline |
|---|---|---|---|
| Surging Adoption of AI-driven Matchmaking Algorithms Tailored to North American Cultural Nuances | +2.1% | United States & Canada, with spillover to Mexico | Medium term (2-4 years) |
| Rising Acceptance of Niche Faith- & Ethnicity-Focused Platforms among U.S. Gen-Z | +1.8% | United States, concentrated in urban corridors | Long term (≥ 4 years) |
| Monetization Upside from Premium Safety Features amid Rising Scam Awareness in Canada | +1.4% | Canada, with early adoption in Toronto, Vancouver, Montreal | Short term (≤ 2 years) |
| Integration of Short-Form Video & Livestream Dating Driving User Engagement | +1.9% | Global, with early gains in U.S. metropolitan areas | Medium term (2-4 years) |
| Growing LGBTQ+ Community Visibility Accelerating Platform Expansion in Urban Corridors | +1.6% | North America urban markets, strongest in U.S. and Canadian cities | Long term (≥ 4 years) |
| Source: Mordor Intelligence | |||
Surging Adoption of AI-Driven Matchmaking Algorithms Tailored to North American Cultural Nuances
Platforms now deploy deep-learning engines that move beyond simple demographic filters to incorporate conversational context, shared values, and region-specific communication cues. eHarmony and OkCupid apply collaborative-filtering models proven to raise long-term match success rates in North America. Match Group is piloting “AI wingmen” that draft opening messages in real time, reducing first-contact friction and boosting subscription conversions. These tools address choice overload and improve perceived value, encouraging users to upgrade for premium algorithmic insights. The result is a measurable uplift in recurring revenue even as overall user growth normalizes.
Rising Acceptance of Niche Faith- & Ethnicity-Focused Platforms among U.S. Gen Z
Demand for culturally aligned communities is reshaping acquisition strategies. Spark Networks, owner of ChristianMingle and JDate, has redirected marketing budgets toward micro-influencers and on-campus events to attract Gen Z users despite short-term revenue contraction.[1]EC, “Spark Networks SE Form 6-K Q1 2023,” sec.gov Community-specific platforms gain loyalty advantages and higher engagement time per session, which translate into stronger upsell potential for exclusive features. The trend signals a shift from scale-seeking mass apps to depth-oriented ecosystems serving distinct identity groups.
Monetization Upside from Premium Safety Features amid Rising Scam Awareness in Canada
Quebec’s Law 25 and related federal discussions mandate enhanced identity verification and transparent data governance. Platforms such as Bumble upsell verified badges, photo-blur controls, and real-time scam detection, adding a new premium tier that resonates with privacy-conscious users.[2]House of Commons, “Data Privacy and Online Platforms Report,” ourcommons.ca Compliance investments raise entry barriers for smaller competitors, while established brands turn regulatory complexity into a revenue driver across Canadian cities.
Integration of Short-Form Video & Livestream Dating Driving User Engagement
Video-centric interactions counter swipe fatigue by enabling richer self-expression and spontaneous chemistry checks. Grindr introduced “Loop” short-form clips, leading to longer in-app sessions and higher gift-purchase rates. [3]Grindr Inc., “2024 Annual Report,” investors.grindr.comAdvertisers benefit from brand-safe placement within moderated streams, opening ancillary revenue channels. For users, immersive formats justify micro-transactions for profile boosts and virtual gifts, accelerating top-line growth across the North America online dating services market.
Restraints Impact Analysis of North America Online Dating Services Market*
| Restraint | (~) % Impact on CAGR Forecast | Geographic Relevance | Impact Timeline |
|---|---|---|---|
| Intensifying Regulatory Scrutiny around Data Localization & Cross-Border Transfers | -1.3% | Canada leading, with U.S. state-level variations | Short term (≤ 2 years) |
| User Fatigue from Swipe-Based Interfaces Reducing Lifetime Value per Customer | -2.2% | Global, with strongest impact in mature U.S. markets | Medium term (2-4 years) |
| Heightened Competition from Social-Media-Embedded Dating Features | -1.8% | North America, concentrated in mobile-first demographics | Medium term (2-4 years) |
| Rising Acquisition Costs on Digital Ad Channels Pressuring Smaller Apps | -1.5% | Global, with particular pressure in competitive U.S. markets | Short term (≤ 2 years) |
| Source: Mordor Intelligence | |||
Intensifying Regulatory Scrutiny around Data Localization & Cross-Border Transfers
Canada now requires personal data to stay within provincial borders unless explicit consent is documented, adding infrastructure costs and complicating data-science workflows. The U.S. Federal Trade Commission’s May 2025 “junk-fee” rule demands up-front disclosure of total subscription pricing, constraining stealth upsell tactics and raising churn risk. Compliance spending diverts resources from feature innovation, pressuring margins during the adjustment window.
User Fatigue from Swipe-Based Interfaces Reducing Lifetime Value per Customer
Swipe mechanics face diminishing returns as novelty wanes and perceived superficiality rises. Match Group reported a 7% revenue contraction at Tinder—even after price optimizations—because daily active users slid for four consecutive quarters. To restore engagement, incumbents must invest in personality-first formats, real-time video, and interest-based communities. These re-platforming efforts lengthen development cycles and compress EBIT margins in the medium term.
*Our forecasts treat driver/restraint impacts as directional, not additive. The impact forecasts reflect baseline growth, mix effects, and variable interactions.
North America Online Dating Services Market Segment Analysis
By Service Type:
Freemium Scale Versus Subscription YieldNon-paying formats remain the on-ramp for mass adoption, yet premium tiers capture superior unit economics. In 2025, non-paying users generated 62.10% of transaction volume across the North America online dating services market. Conversion engines leveraging AI-curated boosts, read receipts, and compatibility analytics lifted paying user ARPU to USD 20.05 at Grindr. The paying category is therefore forecast to grow at a 10.35% CAGR, outpacing overall market momentum.
Platforms blend ad-supported free access with strategically placed paywalls—such as profile super-likes or advanced search filters—to shift high-intent users into recurring plans. Subscription stack depth, bundled with identity verification and fraud protections, enhances stickiness and reduces regulatory compliance risk. Consequently, the North America online dating services market size for paying users is expected to climb steadily through 2031.




By Revenue Model:
Micro-Transactions Unlock Granular ValueSubscription dominance is plateauing at 53.60% market contribution as transparency regulation limits hidden premium upgrades. In response, operators emphasize à-la-carte offerings priced between USD 1 and USD 5, allowing users to test specific value propositions. This micro-transaction segment is projected to expand 12.35% annually, making it the fastest-growing component of the North America online dating services market.
Granular pricing aligns with shifting consumer behavior in the broader digital economy, where users favor paying only for features they perceive as immediately useful. For management teams, micro-transactions provide an analytics-rich environment to refine feature portfolios and optimize product-market fit, thereby lifting retention without inflating headline subscription costs.
By Device Type:
Mobile Primacy with a Desktop ResurgenceMobile applications captured 77.85% of 2025 revenue owing to location-based discovery, push notifications, and on-the-go messaging. Despite this dominance, the desktop/web cohort is poised for an 11.1% growth burst as professional demographics seek larger displays for deeper profile analysis. The North America online dating services market size for desktop users is increasing because these users often commit to longer sessions and display higher propensity to purchase multi-month plans.
Cross-platform parity enhances lifetime customer value. Companies now allocate engineering resources to synchronized chat histories and profile data across web and mobile, ensuring consistent user journeys irrespective of device. As hybrid work blurs home-office boundaries, a balanced device strategy mitigates churn and extends engagement windows.
By Demographic Age Group:
Mature Cohorts Propel Incremental RevenueWhile the 30–40 years population leads with 38.10% share, the 40 + segment is the breakout, expanding at 9.6% CAGR on rising digital literacy among Baby Boomers and Gen X. Higher disposable incomes and a focus on serious relationships drive willingness to pay for premium guidance, background checks, and live matchmaking consultations. These dynamics channel disproportionate revenue into platforms that tailor tone, typography, and customer service toward mature audiences within the North America online dating services market.
Younger users remain a vital pipeline but display lower platform loyalty and heightened price sensitivity. Consequently, firms allocate acquisition spend toward micro-influence channels while designing monetization paths—such as virtual gift economies—that resonate with Gen Z entertainment expectations. Age-segmented roadmaps reduce cannibalization and optimize return on user acquisition cost across cohorts.
Geography Analysis
United States and Canada Online Dating Services Market
The United States remains the revenue engine, driven by diversified portfolios, venture-backed innovation, and sophisticated ad-tech ecosystems that lower acquisition friction. Domestic legislation, while evolving, still favors platform scale and data pooling, allowing incumbents to optimize recommendation engines continuously. Canada’s privacy-first environment generates premium pricing arbitrage as users exhibit higher trust in platforms that openly display data practices. Verified-only chat rooms and AI scam shields command incremental fees, demonstrating that compliance can be monetized when bundled with clear user value.
Mexico and LATAM Online Dating Services Market
Mexico’s growth trajectory mirrors broader Latin American digital maturation. Rising fintech penetration, particularly mobile wallets, simplifies micro-payment adoption and boosts platform cash conversion cycles. Cultural acceptance of online dating has accelerated through pandemic-driven social shifts, enabling fast onboarding of first-time users. Local partnerships with telecom operators and media influencers amplify reach while mitigating language and cultural barriers. Collectively, regional variability necessitates tailored go-to-market blueprints to maximize opportunity across the North America online dating services market.
Regulatory Landscape
Regulatory oversight in North America is tightening around privacy, data sharing, and user safety on online dating platforms. In the United States, the Federal Trade Commission (FTC) escalated enforcement in March 2026 by taking action against Match Group Americas and OkCupid over alleged deceptive practices related to sharing personal data with third parties, reinforcing expectations for clear consent flows and accurate privacy representations across subscription and freemium models.
At the state level, Colorado introduced a more prescriptive safety regime with C.R.S. 6-1-731.5 effective January 2025, requiring online dating services to adopt safety policies and submit annual safety reports to the state attorney general, and referencing accessibility requirements aligned to WCAG 2.1. At the federal legislative layer, the Romance Scam Prevention Act (H.R.2481/S.841, 119th Congress) proposes a uniform standard for fraud-ban notifications, including a 24-hour notification concept, signaling continued movement toward standardized anti-scam and transparency obligations that raise compliance demands while creating space for monetized verified identity and safety add-ons.
Value Chain Analysis
The value chain in North America online dating services starts with product design and platform engineering, including mobile-first UX, AI-driven matching, and trust-and-safety systems such as identity verification, moderation, and fraud detection. Upstream enablers include app-store distribution, cloud infrastructure, and payments, followed by data operations and analytics that tune recommendation engines and pricing. Portfolio operators such as Match Group use multi-brand structures (for example, Tinder and Hinge alongside other brands) to centralize consumer insights and platform capabilities, while differentiating front-end experiences by community and intent.
Downstream, user acquisition and re-engagement are carried out through digital advertising, influencer and community channels, and cross-promotion within brand portfolios. Monetization is then captured via subscriptions and a-la-carte micro-transactions. Customer support, safety reporting, and compliance workflows increasingly function as core operating activities due to heightened scrutiny from the FTC and state-level requirements such as Colorado's annual safety reporting, so governance and transparency are part of the operating backbone rather than a peripheral cost center.
Competitive Landscape
Market concentration is moderate, with Match Group’s multi-brand strategy illustrating portfolio economics at scale. The firm’s ownership of Tinder, Hinge, OkCupid, and Plenty of Fish allows cross-promotion and data synergies, yet brand-level performance diverges sharply. Hinge delivered 23% year-on-year revenue growth in early 2025 by emphasizing intentional dating and video prompts, whereas Tinder’s swipe fatigue drove a revenue dip despite price optimization. Bumble capitalizes on women-first positioning and AI-enhanced safety to sustain robust user sentiment and a growing premium base.
Grindr demonstrates the power of focused community networks, with 32.7% revenue growth to USD 344.6 million in 2024 and 37.9% free-cash-flow margins supported by minimal marketing outlays. Niche platforms targeting faith or ethnicity segments face scaling hurdles as rising digital marketing costs dilute acquisition efficiency, yet well-capitalized entrants remain positioned to capture unserved pockets. Competitive dynamics are therefore shifting from mass-audience landgrabs toward micro-community depth and differentiated feature innovation—key to long-term defensibility within the North America online dating services market.
North America Online Dating Services Industry Leaders
Match Group, Inc.
eharmony Inc.
Zoosk, Inc.
BlackPeopleMeet.com, Inc.
Bumble Inc.
- *Disclaimer: Major Players sorted in no particular order
North America Online Dating Services Market Companies Covered in this Report
- Match Group, Inc.
- Zoosk, Inc.
- Badoo
- BlackPeopleMeet.com, Inc.
- Bumble Inc.
- The Meet Group, Inc.
- Coffee Meets Bagel, Inc.
- The League App, Inc.
- HER (Dattch Ltd.)
- Taimi Inc.
- Grindr LLC
- eHarmony, Inc.
- Hily Corp.
- Raya App, Inc.
- PlentyOfFish Media ULC
- OkCupid LLC
- Spark Networks SE
- OurTime.com
- SilverSingles
- ChristianMingle (Spark)
- Ashley Madison (Ruby Corp.)
Read Analysis of North America Online Dating Services Companies

Market Opportunities and Future Outlook
Opportunities are expanding around safety-first monetization and compliance-led product differentiation as regulation shifts from general privacy principles to more operational requirements. Colorado's C.R.S. 6-1-731.5 (effective January 2025) and active U.S. federal movement via the Romance Scam Prevention Act (H.R.2481/S.841) create a clearer framework for standardized fraud handling and user notifications. That environment supports premium tiers tied to verified badges, scam detection, and reporting transparency, and it also makes it easier to justify paid trust features.
The FTC's March 2026 action involving Match Group Americas and OkCupid further increases the commercial value of privacy controls and consent management that can be packaged as differentiating product capabilities across portfolios. White space remains in differentiated community platforms and new engagement formats that raise time-in-app without relying only on swipe mechanics. Match Group's April 2026 USD 100 million investment in Sniffies highlights the pull toward niche communities with defined product-market fit, and broader adoption of AI-led discovery and assistive messaging tools supports conversion improvements alongside a shift toward micro-transactions and feature-specific spend. Platforms that pair privacy-forward operations with video-led or community-led interaction design can reprice engagement through a-la-carte boosts, safety features, and premium discovery tooling, particularly when users prioritize trust and authenticity.
Recent Industry Developments in North America Online Dating Services Market
- May 2026: Match Group winds down Archer gay-male dating app as part of strategic reallocation following Sniffies investment, with expected $10 million in annualized cost savings. The change reallocates resources to higher-potential platforms.
- May 2026: Match Group folds MG Asia into the E&E business unit to achieve roughly $15 million in annualized cost savings. This restructuring aims to streamline operations and boost cross-regional efficiency.
- April 2026: Match Group invests $100 million in Sniffies, a cruising map and dating platform for non-heterosexual men, with minority ownership and option to acquire remaining equity. The investment strengthens presence in the LGBTQ+ dating segment and expands the product ecosystem.


North America Online Dating Services Market Report Scope and Research Methodology
Market Definition and Coverage
For this study, we define the North America online dating services market as revenue earned from digital platforms and apps that help users discover, match, communicate, and form relationships, including paid subscriptions and in-app purchases, across the United States and Canada.
Scope exclusions: We exclude offline matchmaking and coaching services, and we also exclude revenue from general social networking that is not primarily built for dating.
Segments Covered in This Report
- By Service Type
- Non-Paying Online Dating
- Paying Online Dating
- By Revenue Model
- Subscription-Based
- Freemium
- Advertising-Based
- À-la-Carte Micro-Transactions
- By Device Type
- Mobile Applications
- Desktop / Web Platforms
- By Demographic Age Group
- 18–30 Years
- 30–40 Years
- More than 40 Years
- By Country
- United States
- Canada
- Mexico
Data Sources, Market Sizing, and Validation
Desk Research
Desk work starts by building a clear view of the user base and monetization base, then aligning it with what platforms can realistically capture. We used public sources such as the US Census Bureau and Statistics Canada for population and age cohort context, the US Federal Trade Commission for scam and complaint signals that affect trust and paid conversion, and app store ranking and policy disclosures to understand product changes that can shift the revenue mix.
To tighten assumptions, we also reviewed company filings and shareholder updates where available, platform help-center pages for pricing and feature bundles, and reputable press coverage on safety tools and regulatory actions. In parallel, we used paid subscriptions that support company financials and industry intelligence, patent databases, and news and financials to reduce gaps around monetization patterns and product refresh cycles. The sources named above are illustrative, and we also used other public and paid references for cross-checking, clarification, and data validation.
Primary Interviews and Surveys
Primary work was used to pressure-test adoption, paying share, and average revenue per paying user, since these variables are not consistently visible in public data. We spoke with product and growth leaders, payments and monetization owners, and customer safety or trust teams, and we also included views from agencies and ecosystem specialists who track app performance across North America.
When the desk inputs pointed to wide ranges (for example, churn after price changes or uplift from new verification features), we re-contacted sources to narrow assumptions and keep the final model realistic for the region.
Distribution of primary research fieldwork respondents
| Company type | Respondent position |
|---|---|
| Top tier: 37% | CXOs: 14% |
| Mid tier: 42% | Functional/Unit leaders: 34% |
| Smaller Players: 21% | Managers: 52% |
Market-Sizing & Forecasting
Our sizing logic starts with a top-down build that reconstructs the paid demand pool, then connects it to observed monetization behavior. We estimated the addressable dating-app user base by country using adult population and smartphone usage as guardrails, applied realistic online dating penetration ranges, and translated active users into payers using paid conversion benchmarks validated in interviews.
Revenue is then modeled using a structure that a client can trace: payers multiplied by average revenue per payer, plus a smaller stream from non-subscriber spend where it is common. The key inputs we leaned on include subscription pricing and plan mix, payer conversion and churn, the share of revenue coming from a-la-carte features, and shifts in engagement formats like video prompts and verification flows that can change willingness to pay. To keep totals grounded, we corroborated results with selective bottom-up approximations such as sampled price points by plan, channel checks on promotional discounting, and roll-ups of publicly discussed revenue ranges, then adjusted for gaps where disclosure was limited.
For forecasting, we used scenario analysis with a light multivariate regression layer on a few drivers that move together over time: adult population by age band, smartphone usage, pricing progression, and the expected pace of product-led improvements in safety and matching quality. Where assumptions were uncertain, we kept a base case and a tighter downside case, and we widened the range only when primary feedback showed a real split in expectations.
Data Validation & Update Cycle
Validation is done through repeated cross-checks, not a single pass. We compare model outputs with independent demand signals such as app store category movement, search interest direction, and public commentary on subscription changes, then flag anomalies for rework.
Before sign-off, the model and write-up go through multi-step internal reviews so unit logic, currency conversions, and growth assumptions are consistent across the time series. Reports are refreshed annually, and interim updates are triggered when material events occur, such as policy shifts, major safety regulation changes, or noticeable pricing resets. Right before delivery, an analyst performs a fresh check so clients receive the most current view supported by the latest available inputs.
Mordor Intelligence's North America Online Dating Services Market Estimate Compared With Other Published Estimates
Published market sizes for online dating in North America can differ even when they sound like they cover the same topic, because underlying revenue streams and geography rules are not always aligned. Differences usually come from what is counted as dating revenue, how paid versus free usage is converted into dollars, and how quickly assumptions are refreshed when pricing and product bundles change.
By tracking payer conversion, churn, and price-plan changes each update, Mordor Intelligence keeps the market number tied to app-based dating revenue in the United States and Canada, rather than blending in adjacent social discovery or offline matchmaking revenues. Another common gap is currency and timing, where some estimates mix fiscal-year revenue with calendar-year demand drivers, or apply a single ARPU across all age cohorts even when paying behavior is not uniform.
Benchmark comparison
| Source | Market Size | Gaps in Research Methodology |
|---|---|---|
| Mordor Intelligence | USD 2.21 B (2025) | |
| Trade Journal A | USD 2.70 B (2025) | Tends to fold in broader dating-related revenue, including offline events and coaching, and it often applies optimistic ARPU uplift without checking churn after price changes. |
| Regional Consultancy B | USD 1.85 B (2025) | Leans on conservative payer conversion and assumes a higher share of ad-supported usage, and it uses slower refresh cycles that can miss recent plan repricing and feature bundling. |
The spread in the table is mostly explained by scope boundaries and how payer economics are handled. When revenue is restricted to app and platform dating services and then built from user base, paying share, and realistic ARPU checks, the outcome is easier to audit and replicate. That is why our estimate stays transparent, with each step traceable to a small set of inputs that can be re-tested as the market evolves.


Key Questions Answered in the Report
What is the current value of the North America online dating services market?
The market is valued at USD 2.39 billion in 2026 with expectations of reaching USD 3.51 billion by 2031.
Which revenue model is growing the fastest?
À-la-carte micro-transactions are expanding at a 12.35% CAGR as users favor paying for discrete features over all-inclusive plans.
Why are premium safety features monetizable in Canada?
Provincial privacy regulations require heightened data protection, and users are willing to pay for verified badges and scam-shield tools that comply with these rules.
Which demographic offers the highest growth potential?
Users aged 40 + exhibit the fastest adoption, growing at a 9.6% CAGR due to increasing digital literacy and a focus on serious relationships.
How is video changing user engagement?
Short-form clips and livestream dates extend session length, improve authenticity perception, and create new micro-transaction opportunities such as virtual gifts.
What impact will the FTC fee-transparency rule have on dating apps?
Platforms must reveal total subscription costs upfront, prompting a redesign of checkout flows and encouraging experimentation with lower-commitment bundles to maintain conversions.
Page last updated on:


 Your data is secure and never sold or shared.


