
Waterborne Coatings Market Size and Share
Market Overview
| Study Period | 2020 - 2031 |
|---|---|
| Market Size (2026) | USD 67.84 Billion |
| Market Size (2031) | USD 88.51 Billion |
| Growth Rate (2026 - 2031) | 5.47 % |
| Fastest Growing Market | Asia Pacific |
| Largest Market | Asia Pacific |
| Market Concentration | Low |
Major Players *Disclaimer: Major Players sorted in no particular order Image © Mordor Intelligence. Reuse requires attribution under CC BY 4.0. | |
Waterborne Coatings Market Analysis by Mordor Intelligence
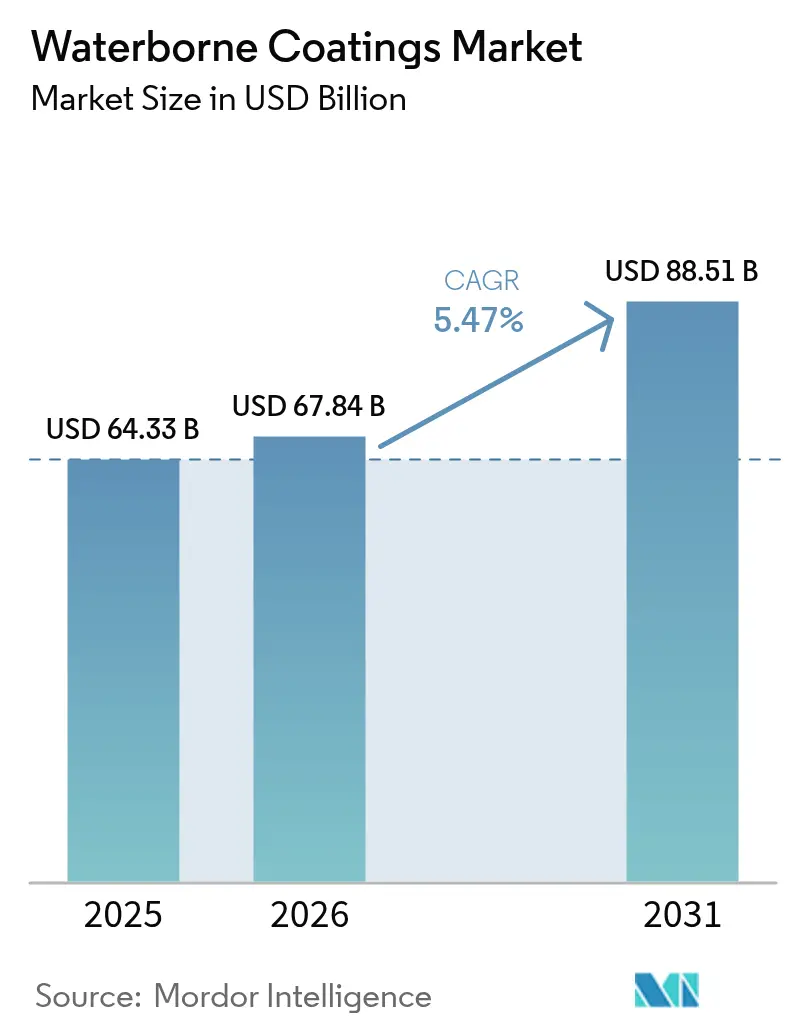
Waterborne Coatings Market size in 2026 is estimated at USD 67.84 billion, growing from 2025 value of USD 64.33 billion with 2031 projections showing USD 88.51 billion, growing at 5.47% CAGR over 2026-2031. Robust demand is anchored in tighter volatile-organic-compound caps, large-scale infrastructure programs, and accelerating OEM conversions that together steer spending toward low-emission chemistries. The Environmental Protection Agency’s January 2027 compliance date extension under the National Aerosol Coatings Rule illustrates the regulatory tightrope producers must walk as they shift portfolios toward greener formulations. Asian construction booms, automotive refinishing upgrades, and bio-based resin breakthroughs further reinforce the long-term trajectory of the waterborne coatings market. Competitive strategies increasingly revolve around supply-secure rheology packages, PFAS-free durability improvements, and digital color platforms, creating fresh avenues for value capture despite raw-material cost volatility.
Key Report Takeaways
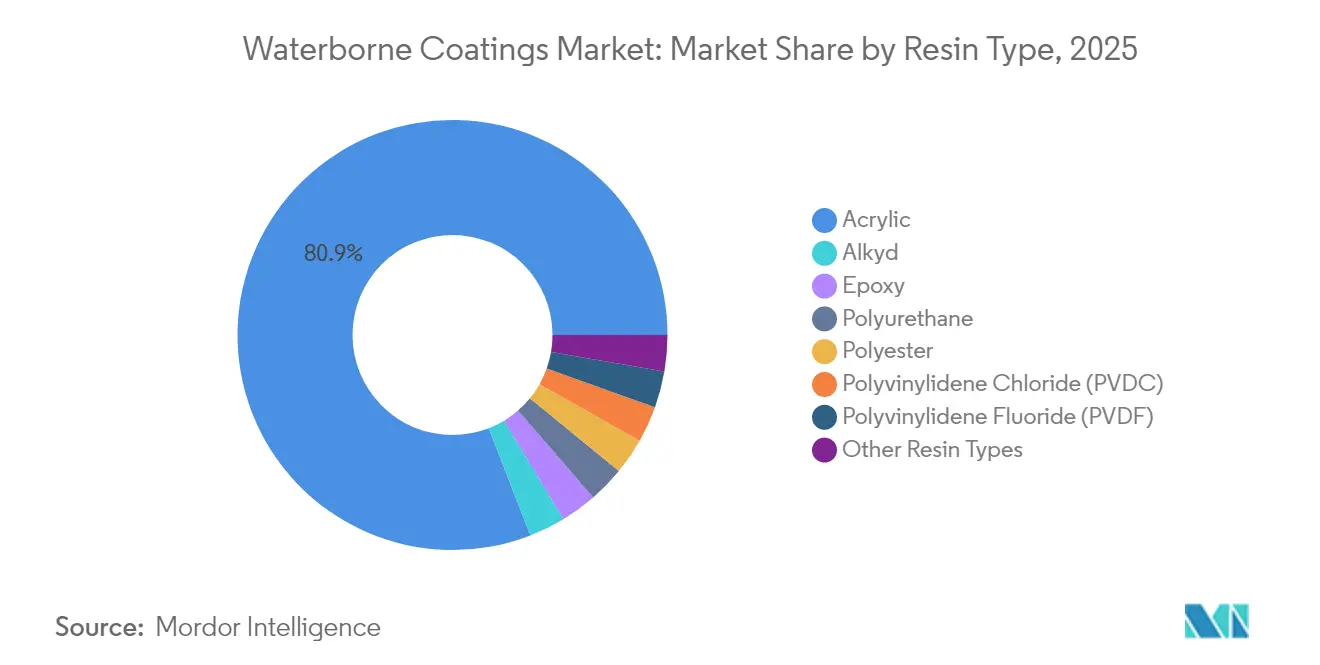
- By resin type, acrylic dominated with 80.90% of the waterborne coatings market share in 2025; polyurethane is projected to expand at a 5.82% CAGR through 2031.
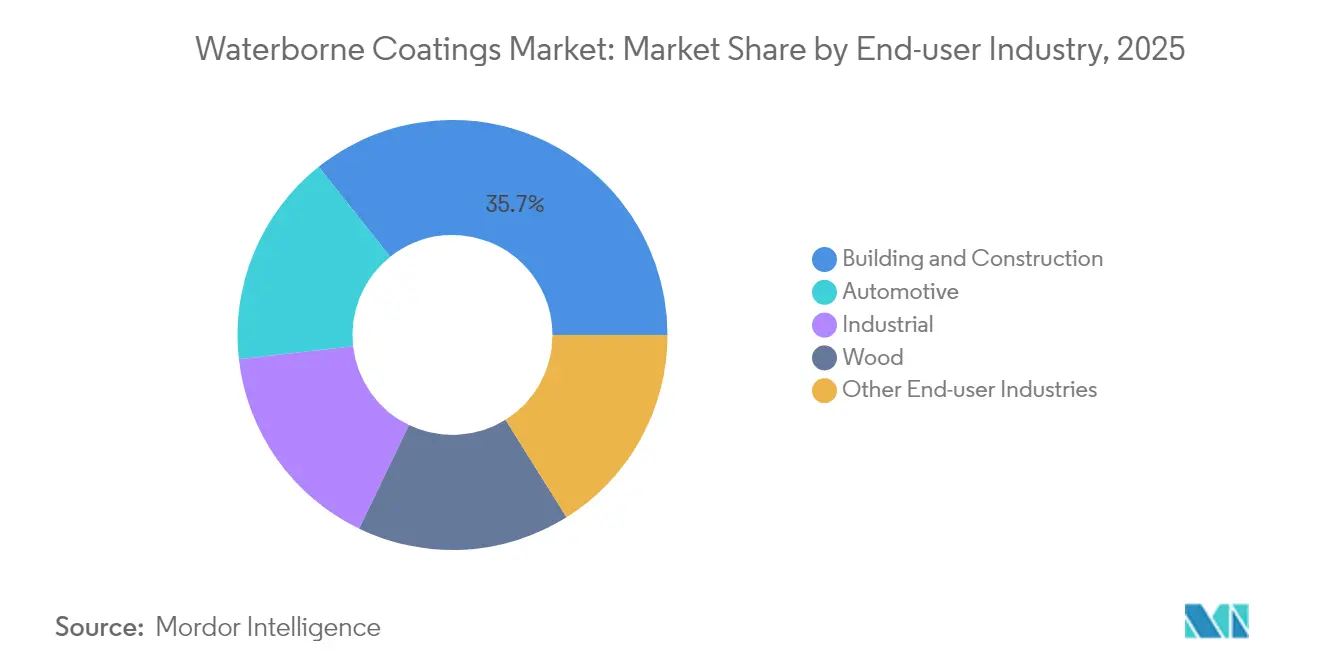
- By end-user industry, building and construction held 35.70% share of the waterborne coatings market size in 2025, while automotive applications are set to grow the fastest at 5.84% CAGR to 2031.
- By geography, Asia-Pacific led with 42.40% revenue share in 2025; the region is anticipated to compound at a 5.93% CAGR, outpacing all other regions.
Note: Market size and forecast figures in this report are generated using Mordor Intelligence’s proprietary estimation framework, updated with the latest available data and insights as of 2026.
Market Trends and Insights
Drivers Impact Analysis of Waterborne Coatings Market*
| Drivers | (~) % Impact on CAGR Forecast | Geographic Relevance | Impact Timeline |
|---|---|---|---|
| Stricter VOC and decarbonization mandates | +1.8% | North America and EU highest, global spill | Medium term (2-4 years) |
| Rapid infrastructure buildouts in Asia and Africa | +1.5% | APAC core, MEA extension | Long term (≥ 4 years) |
| OEM one-component conversion from solvent to water systems | +1.2% | Germany, Japan, US hubs | Short term (≤ 2 years) |
| Bio-based resin breakthroughs | +0.7% | North America and EU early, APAC scaling | Long term (≥ 4 years) |
| Smart-factory low-temperature cure demand | +0.5% | Germany, China, US | Medium term (2-4 years) |
| Source: Mordor Intelligence | |||
Stricter VOC and Decarbonization Mandates
California’s Air Resources Board restricts industrial-maintenance VOCs to 50 g/L, nearly a ten-fold tightening against federal thresholds, forcing formulators to engineer ultra-low emission blends that still pass adhesion, gloss, and durability tests[1]South Coast Air Quality Management District, “Rule 1151 Proposed Amendments,” aqmd.gov. Similar tightening unfolds across Canada, where national limits on 130 product classes took effect in January 2024 and extend compliance risk for multinationals with globally harmonized SKUs. In Europe, the updated REACH Restrictions Roadmap targets PVC additives and ortho-phthalates, compressing the adoption window for PFAS-free polyols. As jurisdictions converge on ambitious decarbonization metrics, companies able to harmonize one waterborne specification across continents will lower compliance overhead and speed market entry, leaving laggards boxed into fragmented legacy lines.
Rapid Infrastructure Buildouts in Asia and Africa
China’s stimulus-driven industrial revival and India’s highway and metro expansions underpin the largest share of incremental liters for the waterborne coatings market. GCC construction pipelines add a climatic angle: quick-drying, low-odor waterborne primers now coat more than 45% of new residential stock in Bahrain and Oman, a share expected to widen as regional contractors chase LEED and Estidama credentials. The Asian Development Bank’s 2024 Key Indicators emphasize that USD 1.7 trillion annual infrastructure spending must integrate climate resilience, thrusting waterborne chemistries with minimal indoor-air pollutants to the top of procurement lists[2]Asian Development Bank, “Key Indicators 2024,” adb.org. Conference dialogues from Indonesia to Kenya indicate that technical consultants increasingly recommend water-based epoxies for hospitals and schools, confirming an entrenched preference that raises the floor for long-run demand growth.
OEM One-Component Conversion from Solvent to Water Systems
Automotive OEMs now routinely specify waterborne basecoats able to slash VOCs by 60 to 70% while matching solvent-borne appearance, accelerating the waterborne coatings market expansion inside paint shops from Detroit to Nagoya. Collision-repair migration already reached 64% shop penetration by 2018 and keeps climbing as insurers reward shops that reduce flammability risk. PPG’s 100–300 g/L technology demonstrates real-world emission cuts without lengthening bake cycles. Infrared‐enhanced booths and robotics fine-tune film builds, allowing one-component water systems to replace older two-component solvent lines without throughput penalties.
Bio-Based Resin Breakthroughs
Lignin, algae, and vegetable oil derivatives are mainstreaming after Aalto University showed lignin’s superior stain resistance versus petro-acrylics. Borregaard’s rheology-active lignin blocks deliver 20 to 40% formaldehyde cutbacks in waterborne dispersion adhesives. Polyurethane systems containing 70% biomass now match conventional tensile and thermal metrics, blurring the historical trade-off between renewability and performance. Prefere Resins targets 90% phenol replacement across its resin lines by 2030, signaling that bio-content will become a baseline spec rather than a niche premium.
Restraints Impact Analysis of Waterborne Coatings Market*
| Restraints | (~) % Impact on CAGR Forecast | Geographic Relevance | Impact Timeline |
|---|---|---|---|
| Scarcity and price volatility of specialty rheology additives | -0.8% | APAC manufacturing hubs are acute | Short term (≤ 2 years) |
| Humidity-related drying defects in tropical regions | -0.6% | Southeast Asia, Sub-Saharan Africa, Latin America | Medium term (2-4 years) |
| PFAS-free performance gap for extreme anticorrosion | -0.4% | Global marine and harsh-service assets | Long term (≥ 4 years) |
| Source: Mordor Intelligence | |||
Scarcity and Price Volatility of Specialty Rheology Additives
Rheology packages, barely 4% by weight yet 13% of raw-material spend, swing overall production margins when supply tightens. Producer consolidation around complex ASE and HASE chemistries magnifies price shocks; a single outage can inflate global quarti-ton costs by double digits. Ribbon polysilicates promise pH-stable flow at lower dosages but need extensive compatibility trials, stretching innovation timelines to one year or more. Interim stock buffers remain the only hedge, locking capital that could fund new research and development.
PFAS-Free Performance Gap for Extreme Anticorrosion
Marine platforms, semiconductor fabs, and chemical reactors rely on PFAS to repel aggressive media. Maine and Minnesota bans accelerate the clock, yet silicone-based wetting aids fall short of the water-beading thresholds designers need. Non-fluorinated superhydrophobics with polyacrylate-SiO₂-graphene matrices already touch 150° contact angles, but must prove 15-year sea-spray exposure before specifiers switch. Approval cycles of two to three years drag on cash-flow and slow market penetration.
*Our forecasts treat driver/restraint impacts as directional, not additive. The impact forecasts reflect baseline growth, mix effects, and variable interactions.
Waterborne Coatings Market Segment Analysis
By Resin Type:
Acrylic Stability Underpins GrowthAcrylic formulations anchored 80.90% of the waterborne coatings market in 2025, reflecting a time-tested blend of UV resistance, color retention, and cost efficiency that builders and DIY consumers favor worldwide. The waterborne coatings market size for acrylic resins is projected to expand steadily, supported by municipal repaint programs and widening do-it-yourself channels.
Polyurethane, though a smaller base, is accelerating at 5.82% CAGR to 2031 as vehicle makers and industrial-maintenance engineers shift to one-component waterborne chemistries that cut booth times and raise chemical resistance. Epoxies retain their foothold in heavy anticorrosive service, though PFAS exit paths demand parallel innovation to sustain barrier metrics. Alkyds, squeezed by VOC levies, find reprieve in bio-sourced variants that swap azelaic acid for petroleum feedstocks, easing regulatory scrutiny while keeping familiar workability.



By End-user Industry:
Construction Leadership Meets Automotive MomentumInfrastructure investments kept building and construction at 35.70% of the waterborne coatings market size in 2025, confirming the segment’s role as volume bedrock. Urban apartment builds, public transit hubs, and commercial retrofits all gravitate toward low-odor, quick-reoccupy coatings that meet green-building credits. Meanwhile, the automotive segment races ahead at a 5.84% CAGR, powered by OEM mandates that every paint line meet sub-250 g/L VOC across primers, basecoats, and clears.
Waterborne polyurethane and acrylic blends prove pivotal, combining high gloss with improved coverage per coat, thereby trimming total paint kilograms per vehicle. Industrial maintenance holds a solid base share, yet shifts toward higher solids and PFAS-free topcoats complicate product-mix planning. Wood finishing edges upward thanks to lignin-enhanced recipes that fight UV while preserving grain aesthetics, luring both furniture exporters and upscale millwork shops.
Geography Analysis
APAC Waterborne Coatings Market
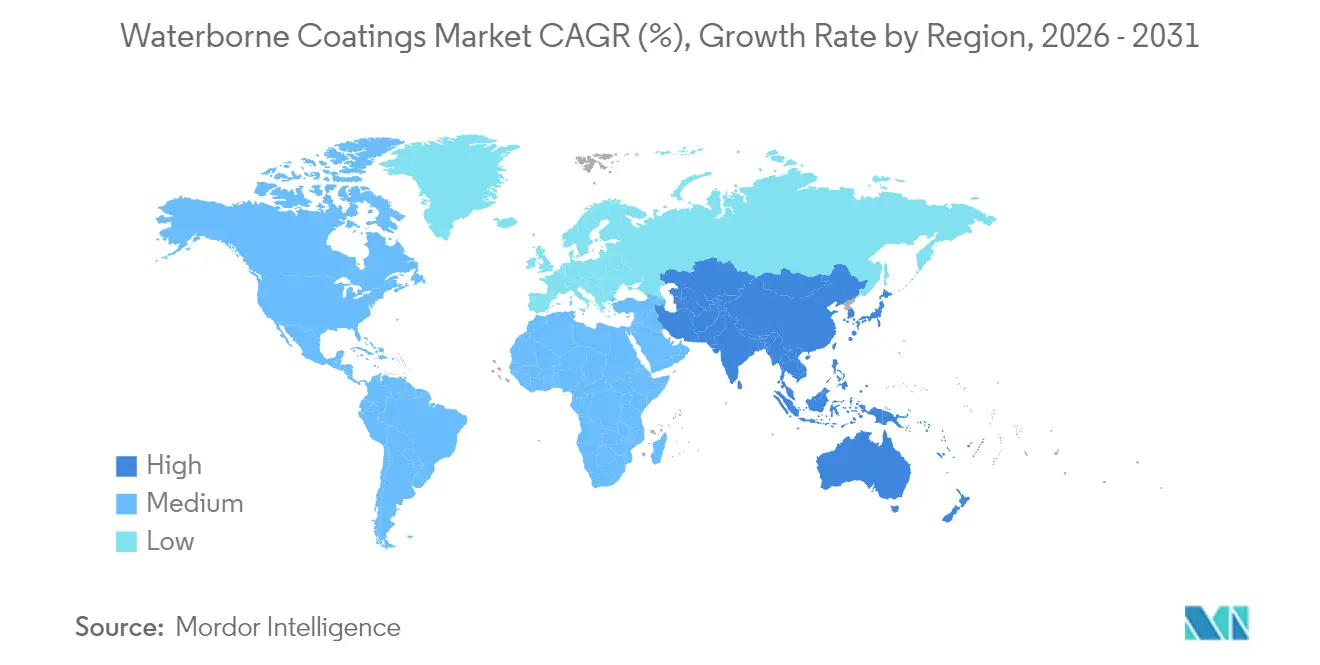
Asia-Pacific commanded 42.40% of global revenue in 2025 and is on track for a market-leading 5.93% CAGR to 2031, cementing its position as the growth engine for the waterborne coatings market. China’s stimulus packages revive industrial output, expanding baseline demand for general-industrial enamels, while India’s concrete-intensive smart-city corridors open long-haul orders for elastomeric roof and bridge membranes.
North America Waterborne Coatings Market
North America reflects regulatory maturity mixed with technology leadership. California’s 50 g/L cap forces nationwide SKUs to align at the lowest permissible VOC, rippling through distribution chains and spurring rapid reformulation. Canada’s national VOC rulebook harmonizes provincial limits, smoothing market access for compliant waterborne lines from Quebec to British Columbia.
Europe Waterborne Coatings Market
Europe remains a sustainability trend-setter through the Chemicals Strategy for Sustainability, accelerating waterborne adoption across architectural, industrial, and DIY shelves. AkzoNobel’s BASF-enabled Dulux Easycare relaunch in the UK advances its pledge to cut product carbon by 5% minimum, strengthening brand pull among eco-conscious shoppers. Eastern-European urbanization also drives incremental liters, especially in municipal road and rail renovations funded by EU recovery programs.

Value Chain Analysis
The waterborne coatings value chain starts with upstream feedstocks and intermediates, including acrylic, polyurethane, epoxy, and alkyd building blocks, plus high-sensitivity functional additives such as dispersants and rheology modifiers. Additives and binder availability is a recurring bottleneck because specialty rheology packages represent a small fraction of formulation weight but a disproportionate share of raw-material spend, so supply disruptions quickly translate into cost swings and reformulation cycles.
Midstream participants include dispersion and additive producers and integrated coatings manufacturers that compound, tint, and package products for architectural, industrial, automotive OEM/refinish, and wood uses. Downstream, coatings move through a mix of direct-to-OEM and project channels (automotive and industrial maintenance), distributors and applicator networks (protective and maintenance), and retail/DIY platforms (architectural). Recent supplier-side product moves, such as BASF introducing certified biomass-balanced additives for architectural coatings in July 2026 (Dispex and Rheovis grades), highlight how upstream innovation is being pulled into mainstream waterborne systems to address both performance and carbon-footprint requirements while keeping manufacturing changeovers manageable.
Competitive Landscape
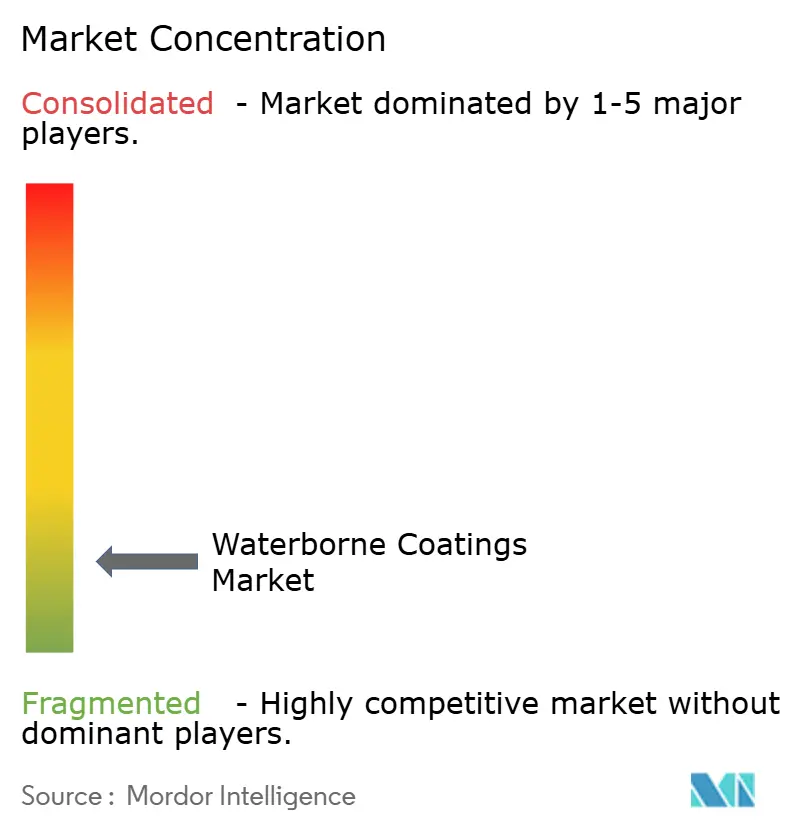
The market is fragmented in nature. PPG Industries, AkzoNobel, and BASF sit atop, fortified by global research and development networks and multi-site capacity that buffer supply shocks. Innovation vectors increasingly differentiate rivals. Regional players such as Asian Paints and Nippon Paint blend local distribution intelligence with agile production to guard their share against global giants, sometimes partnering for raw-material pooling yet competing fiercely at retail countertops. Niche specialists pivot toward marine antifouling, food-grade barrier coats, and high-solids protective segments where service packages and application know-how fetch premium margins.
Waterborne Coatings Industry Leaders
Akzo Nobel N.V.
Asian Paints Ltd.
BASF
PPG Industries, Inc.
The Sherwin-Williams Company
- *Disclaimer: Major Players sorted in no particular order
Waterborne Coatings Market Companies Covered in this Report
- Akzo Nobel N.V.
- Arkema
- Asian Paints Ltd.
- Axalta Coating Systems, LLC
- BASF
- Benjamin Moore & Co.
- Berger Paints India
- Chokwang Paint
- Dow
- Hempel A/S
- Jotun
- Kansai Paint Co., Ltd.
- KCC Corporation
- Masco Corporation
- Nippon Paint Holdings Co., Ltd.
- PPG Industries, Inc.
- RPM International Inc.
- Sika AG
- Teknos Group
- Tenaris
- The Sherwin-Williams Company
- Tikkurila

Market Opportunities and Future Outlook
Opportunities are concentrated where regulation and procurement practices convert waterborne from a preference into a specification, particularly in large-volume architectural and industrial categories. China implemented mandatory national standards GB 30981.1-2025 and GB 30981.2-2025 in June 2026, tightening VOC limits (including 50 g/L for interior wall coatings) and adding SVOC controls, which raises the value of compliant binder and additive packages that maintain film formation and appearance under low-emission constraints. In Europe, the European Commission updated EU Ecolabel criteria with a dedicated product group for water-based aerosol spray paints effective December 2025, creating a clearer route for differentiated, labeled waterborne portfolios in retail and professional channels.
A second whitespace sits in local and regional supply reliability for dispersions, binders, and performance additives, especially in emerging markets that are scaling infrastructure and manufacturing. BASF expanded dispersion production in Durban, South Africa (February to March 2026 timeline in company communications) and began work on a new dispersions line at Mangalore, India, while JAT Holdings completed a second-phase binder plant expansion in Sri Lanka in March 2026 (capacity up 76%). On the demand-facing side, Asian Paints announced a greenfield water-based coatings facility in Indore, India (EUR 217 million, 400 million litres annual capacity target), signaling room for suppliers and formulators that can support fast scale-up with humidity-tolerant waterborne systems, PFAS-free durability upgrades for protective segments, and validated low-carbon formulations using mass-balance or biomass-balanced inputs (for example, BASF launched certified biomass-balanced additive grades in July 2026).
Recent Industry Developments in Waterborne Coatings Market
- July 2026: BASF launched three certified biomass-balanced additives for architectural coatings, Dispex AA 4145 MB, Rheovis PU 1333 MB, and Rheovis HS 1169 MB. The launch targets carbon-footprint reduction through certified feedstock accounting while keeping compatibility with existing waterborne formulations, supporting faster adoption in high-volume paints where reformulation and qualification time is costly.
- November 2025: BASF Coatings commissioned a new production plant for automotive OEM coatings at its Muenster, Germany site, designed around high-runner color products and enhanced automation. The added footprint strengthens regional supply capability for OEM paint shops converting to lower-emission systems and raises competitive intensity around reliable, standardized waterborne-capable production.
- November 2024: BASF opened a new production line in Heerenveen, the Netherlands for water-based dispersions under brands such as Joncryl and Acronal Pro. The expansion supports local availability of key waterborne building blocks used across coatings and adjacent applications, helping shorten lead times and reduce supply-chain risk for European formulators.


Waterborne Coatings Market Report Scope and Research Methodology
Market Definition and Coverage
This market covers water-based coating materials sold for use in construction, automotive, industrial, and wood applications, where water is the main carrier and the product is supplied as a coating for protection or appearance.
Scope exclusions: Solvent-borne, powder, and radiation-cured coatings are excluded even when they compete in the same end uses.
Segments Covered in This Report
- By Resin Type
- Acrylic
- Alkyd
- Epoxy
- Polyurethane
- Polyester
- Polyvinylidene Chloride (PVDC)
- Polyvinylidene Fluoride (PVDF)
- Other Resin Types
- By End-user Industry
- Building and Construction
- Automotive
- Industrial
- Wood
- Other End-user Industries
- By Geography
- Asia-Pacific
- China
- India
- Japan
- South Korea
- Southeast Asia
- Rest of Asia-Pacific
- North America
- United States
- Canada
- Mexico
- Europe
- Germany
- United Kingdom
- France
- Italy
- Russia
- Rest of Europe
- South America
- Brazil
- Argentina
- Rest of South America
- Middle-East and Africa
- Saudi Arabia
- United Arab Emirates
- South Africa
- Egypt
- Rest of Middle-East and Africa
- Asia-Pacific
Data Sources, Market Sizing, and Validation
Desk Research
Desk research is used to set the market structure and to anchor demand signals that are visible in public data. We rely on sources such as US EPA publications on VOC rules, Eurostat manufacturing and construction indicators, UN Comtrade trade flows for key coating raw materials, and World Bank macro series that help normalize regional demand cycles.
To translate these signals into a workable sizing model, we review annual reports, investor presentations, sustainability disclosures, and technical papers from peer-reviewed journals that discuss resin and formulation shifts. In a few places, paid subscriptions for company financials and news were used to check reported revenue splits and to spot capacity additions or plant shutdowns that can move supply. These sources are not exhaustive, and additional public references were used for data collection, validation, and clarification during the study.
Primary Interviews and Surveys
Primary work is used to pressure-test assumptions that desk research cannot settle cleanly, such as price ranges by resin family and the pace of switching from solvent systems. We spoke with coating formulators, raw material suppliers, distributors, and large buyers across APAC, EMEA, and the Americas, so regional demand patterns and compliance-driven substitutions could be cross-checked.
Distribution of primary research fieldwork respondents
| Company type | Respondent position | Region |
|---|---|---|
| Top tier: 30% | CXOs: 15% | APAC: 43% |
| Mid tier: 52% | Functional/Unit leaders: 34% | EMEA: 36% |
| Smaller Players: 18% | Managers: 51% | Americas: 21% |
Market-Sizing & Forecasting
Sizing starts with a top-down build where coatings demand is reconstructed from end-use activity in construction output, vehicle production, and industrial production indices, then filtered through typical waterborne penetration by use case. Once that demand pool is established, we corroborate it using selective bottom-up checks, including sampled supplier revenues, channel feedback on volumes, and ASP times volume sanity checks for major resin groups.
Key inputs that repeatedly moved the model were regional construction starts and renovation activity, automotive OEM and refinish volumes, industrial coatings consumption indicators, VOC regulation timelines, and typical price ladders by acrylic, alkyd, epoxy, and polyurethane waterborne systems. Where bottom-up reference points were incomplete for smaller countries, gaps were handled through comparable-market scaling using per-capita coatings consumption signals and known industrial mix, before totals were rebalanced.
For forecasting, scenario analysis was used to reflect different speeds of regulatory tightening and substitution rates, and then the chosen scenario was aligned to expert consensus from interviews. Growth was smoothed to avoid unrealistic step-changes unless a capacity shift or a policy milestone was clearly evidenced in the inputs.
Data Validation & Update Cycle
Model outputs are triangulated against independent signals such as regional coatings production trends, trade movements in key inputs, and publicly visible construction and auto cycles, and then the biggest variances are investigated. When a region shows a jump that is not supported by the demand indicators, the assumptions are revisited and, if needed, a quick re-contact is done with industry participants to confirm what changed.
Before sign-off, the work is reviewed in steps so calculations, currency handling, and year mapping are consistent across regions and segments. Reports are refreshed annually, with interim updates when material events occur, and a final pre-delivery check is performed so clients receive the latest view available at the time of publication.
Mordor Intelligence's Waterborne Coatings Market Estimate Compared With Other Published Estimates
Different published numbers for waterborne coatings are common because firms often start from different years, use different end-use mixes, and apply different assumptions for pricing and substitution. The spread usually becomes larger when one estimate leans more on stated revenues, while another leans more on demand indicators tied to construction and industrial output.
Powder and radiation-cured coatings are kept outside Mordor Intelligence's scope, which tends to pull the total below figures that group multiple low-VOC technologies together under a broader coatings bucket.
Benchmark comparison
| Source | Market Size | Gaps in Research Methodology |
|---|---|---|
| Mordor Intelligence | USD 67.84 B (2026) | |
| Industry Research Publisher A | USD 74.98 B (2026) | Uses a different base structure where application mapping and conversion of reported sales can capture adjacent low-VOC technologies and a wider set of water-based product forms, which inflates the 2026 total versus a strict waterborne coatings-only cut. |
| Market Research Publisher B | USD 55.54 B (2024) | Anchors the model to a 2024 base year and applies a lower growth path and more conservative ASP progression, which can understate current-cycle pricing effects in regions where construction and industrial demand rebounded later. |
Across the three figures, most of the difference comes from what is counted as waterborne versus other low-VOC coating technologies, and from how base-year pricing is carried forward. By keeping the steps tied to visible end-use activity and then cross-checking with interview-led pricing and penetration assumptions, the final number stays easier to trace and replicate.


Key Questions Answered in the Report
What is the expected growth rate of the waterborne coatings market between 2026 and 2031?
The global waterborne coatings market is forecast to grow at a 5.47% CAGR, rising from USD 67.84 billion in 2026 to USD 88.51 billion by 2031.
Which region generates the highest demand for waterborne coatings?
Asia-Pacific leads with 42.40% revenue share in 2025 and is set to grow the fastest at 5.93% CAGR through 2031, powered by extensive infrastructure programs and industrial output gains.
Why are acrylic resins dominant in waterborne formulations?
Acrylics combine strong UV stability, color retention and cost competitiveness, giving them 80.90% of 2025 market share across diverse architectural and decorative uses.
What is driving the rapid uptake of waterborne coatings in automotive applications?
OEM and collision-repair shops adopt water systems to comply with stringent VOC caps while benefiting from fewer coats, lower flammability risk and improved color matching.
How are producers addressing the impending PFAS bans?
Companies are developing silicone-based wetting aids and graphene-reinforced superhydrophobic films that aim to match PFAS durability, though multi-year field validation is still required.
Page last updated on:





